Month: February 2018

Steady as she goes for lamb but mutton finding a lift

It was another unusually steady week for lamb prices, as supply seems to be closely matching demand.  Mutton prices found some strength however, especially in NSW, but regular readers will know this was not unexpected.

The thing about writing market analysis weekly is that no one really remembers the predictions you made unless they are particularly bold.  This is both good and bad.  Good when you get it wrong, bad when you get it right.  At least we have the opportunity to remind readers when we were right.

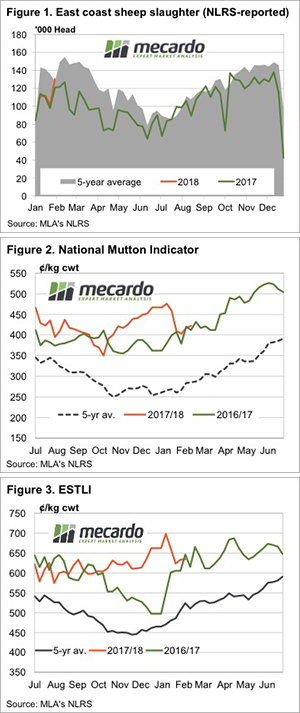
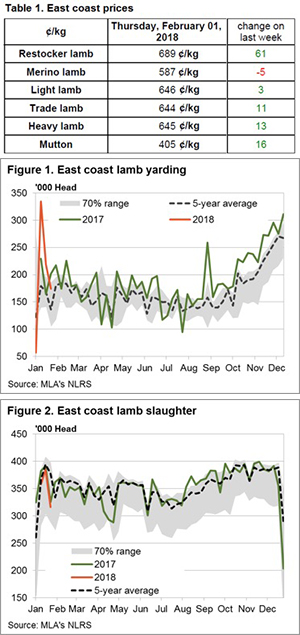
A couple of weeks back we surmised that after Australia Day demand for lamb wanes, more kill space might open up for mutton, boosting prices from what were three month lows.  Figures 1 and 2 show that we actually got this one right.

East Coast Mutton Sheep Slaughter rose to levels not seen in two years, and the extra demand has dragged the National Mutton Indicator 20¢ higher over the last two weeks to sit at 422¢/kg cwt.

Most of the mutton action was in NSW, where the indicator is at 430¢, and WA which has the highest prices sheep at 456¢/kg cwt.  Sheep in WA are 45% above the same time last year.

Lamb prices tracked sideways this week, with the ESTLI stalled at 634¢/kg cwt (figure 3).  Lambs are more expensive in Victoria, at 659¢, and cheaper in NSW at 630¢.  SA prices have recovered following the summer flush, and the decline in slaughter capacity, now sitting at 596¢/kg cwt.

The week ahead

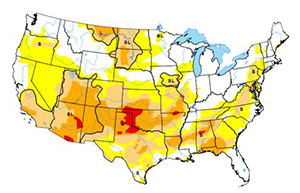
Figure 3 shows that on average lamb prices are likely to track sideways to slightly higher at this time of year.  There is a risk prices could fall if the dry weather continues, especially in the parts of NSW where they might expect rain at this time of year.  On the other hand, a good widespread rain might see enough tightening to rally values back above 650¢.  There is nothing on the map for the next week, so expect steady lamb and mutton prices for the next week or so.


Stunning recovery for wool

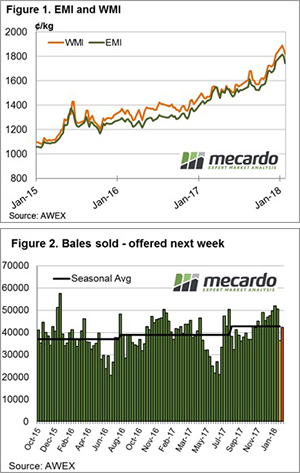
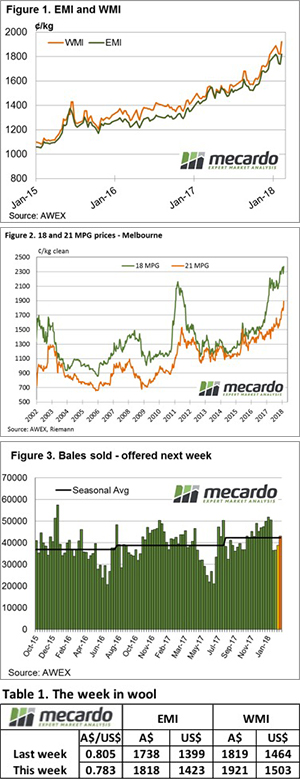
This AWEX report probably summed up the sentiment of the wool market this week – “The recent wool market decline halted in stunning fashion”. Every one of the AWEX reported indices posted an improvement, some of the increases had to be seen to be believed.

The A$ also contributed and was quoted down 2.25 cents to US$0.7825 at the close of selling, helping the Eastern Market Indicator (EMI) to rise by $0.80 for the week to close at 1818¢. The Western Market Indicator (WMI) rose a massive 102cents to 1921¢ – figure 1.

To put this in context, the previous peaks were reached in the first sales of this year, then the EMI hit 1818 for the first time, while the WMI was quoted at 1888. To underline this recovery, the EMI in US$ terms is just shy of its 1434 peak in January at 1423. This has been an unprecedented reversal of the price declines of the last couple of weeks and reinforces the volatility of the market.

There are some interesting factors with the various indices; if we take Melbourne quotes as an example the 18 MPG on the opening sale week in January was quoted at 2363, it fell to 2225 over the following 2 weeks, and this week it sits at 2363; all this movement occurring over 4 selling weeks.

The 21 MPG over the same period started at 1800, fell to 1765 and now sits at 1891.

Cardings turned around their downward trend also, posting strong gains in all centres however of note was Melbourne and Fremantle, where gains of 100 & 120 cents respectively were recorded. Crossbred also joined in with 40 – 70 cent gains common.

Growers passed in only 2.1% of the offering in a positive response to the market.

This is a time for sellers to act in the wool market, fresh shorn stocks need to be baled and trucked to store for testing as soon as possible, and wool in store should be sold, either at auction or on Wool Trade.

Growers then should discuss forward sales with their broker representative. It’s not a question of whether sales should occur or not, these prices are unprecedented. The discussion needs to be around how much to lock in, and what is the best contract to use; these are questions that will have unique answers for each wool producing business.

The week ahead

Tasmania will eagerly look toward their traditional February special sale next week; while growers and brokers may have been nervous over the past couple of weeks, as it turns out the timing could not have been better.

Sales are scheduled for all three centres with Melbourne selling on Tuesday, Wednesday & Thursday while Sydney & Fremantle will only offer on Wed & Thur. A total of 43,000 bales on offer, almost 5,000 bales more than the clearance of 38,700 of this week.

WASDE the matter now?

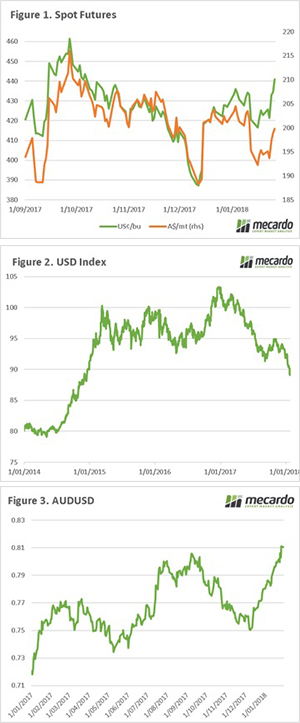
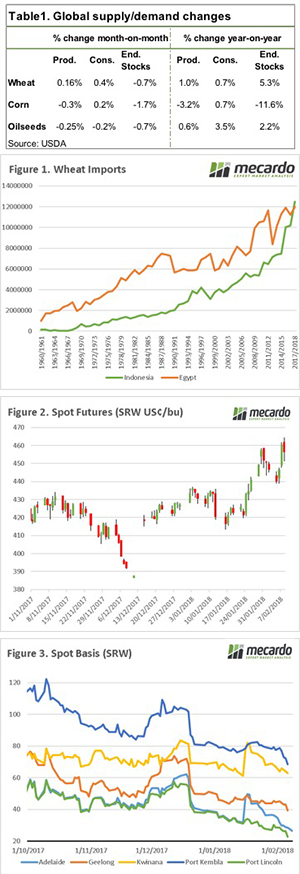
An exciting week in markets, with volatility across equities and currency. In the past week wheat futures have performed well, but has the benefit been passed onto local growers? Overnight the WASDE was released, and it provides some data that is good for Australian grain in the long term.

The WASDE report was released overnight. The report was largely bereft of much in the way of surprises, with tinkering around the edges. The summary of the report is provided in table 1. On a month on month basis, the end stocks for wheat, corn and oilseeds were all reduced. This has to be tempered by the fact that season on season, end stocks are still strongly up, with the exception of corn.

An interesting piece of data in the report, was the imports of wheat. Egypt has traditionally been the largest importer of wheat; this year Indonesia is expected to take the crown. As we can see in figure 1, there has been a rapid increase in imports in the past five years. Increased Indonesian imports are of benefit to Australian farmers, as we have a geographic advantage into this destination. The question remains on whether imports have been higher due to low pricing, or whether this will continue to be a long-term trend when prices rise.

The futures market overnight took a tumble (figure 2), nonetheless futures when converted into A$ remain $15 higher than the same time last week. At a local level the full benefit of the futures rally has not been passed onto local growers, with basis levels (figure 3) falling between $5 and $11 dependent upon zone.

One thing to keep in mind is that although basis levels have fallen since harvest, they have fallen from close to record levels. In our articles prior to harvest, we recommended selling basis, as it was very top heavy.

I recommend re-reading the article ‘3 elements that need to be considered when selling grain’, this will gives some indication on how we can improve our risk management strategies.


What does it mean/next week?:

The A$ is currently falling, which if it continues this trend will add additional value to export pricing, and make it more attractive to buy in Australia.

The key focus will be on the US weather, with drought seemingly spreading further their productive potential will be constrained, if no rain is received in the next six weeks.


Tentative recovery for wool

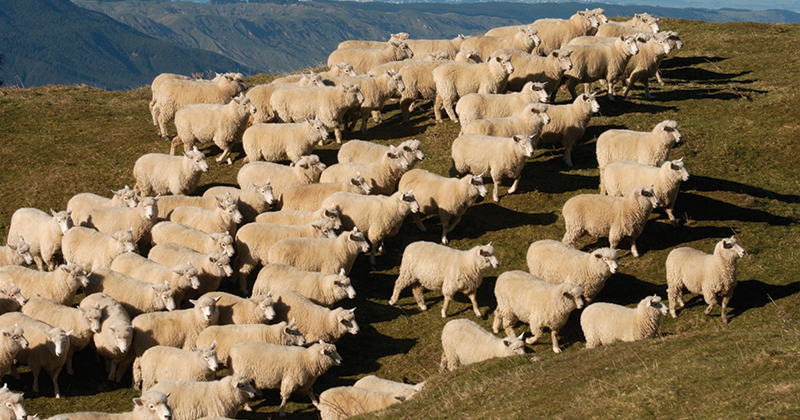
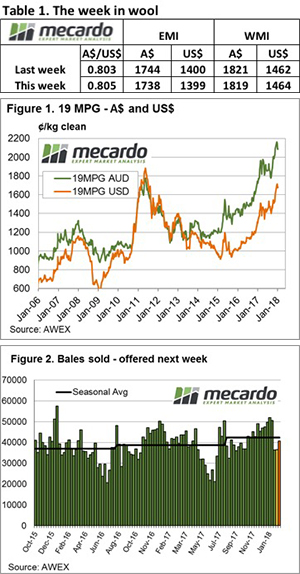
This week the wool market appeared to draw breathe after the sharp falls of the previous two weeks. It was the fine end that fared the best, and of note was the strong competition for sound wool with low mid-breaks.

The higher A$ saw only a 1 cent fall in US $ terms, while the Eastern Market Indicator (EMI) ended the week down 6¢ to close at 1738¢. The Western Market Indicator (WMI) also eased marginally to register a 2¢ decline to 1819¢ – figure 1.

While the early sales for the week had buyers again showing caution causing the market to open weaker, by the end of the week a more positive tone had emerged. This was especially noted in the fine wool types (17MPG +21 in Sydney & +14 cents in Melbourne), as well as the mid micron categories. The 21 MPG in Melbourne improved 33 cents for the week while in Fremantle AWEX quoted the 21 MPG up 10 cents.

Since the market peak in the first sale of this year, the EMI is down 4.4% although in US$ terms it is only 2.2% of the peak. The 17 MPG is in fact higher, up 1.4% %, while 19 MPG is 3.5% weaker.

Cardings again were out of favour losing 30 – 40 cents, now having accumulated a drop over the last 3 weeks of 280 cents, a massive 21% down from the first January sale.

Growers passed in 7.6% of the offering. 42,000 bales were rostered, however only 39,500 were offered with 36,584 bales sold. The past 2 weeks sales of 36,500 bales have been the lowest auction clearances since last September.

A review of export destinations for the year to date reinforces the reliance the wool market has on China. 74% of all wool exported has been to China, with India taking 6% and Italy and the Czech Republic taking 5% each.

The week ahead

The weaker market has seen the numbers cleared to the trade fall to the lowest weekly total since September last year, well below the season average of 42,300 per week.

Sales are scheduled for Wednesday and Thursday next week in all three centres with a total of 40,000 bales on offer. Sydney has a dedicated Superfine sale.

A review of the past month.

Time flows like water down the river rapids, we are now into February and the holiday season is now but a distant memory. January has come to an end, and it’s worth examining how the start of the year has gone.

The futures market has risen sharply in the past three weeks (figure 1), this has been as a result of a depreciating US dollar (discussed here) and weather concerns. The market is concerned about weather patterns in the US (see map), which show abnormally dry conditions across much of the country. Although still early in the season, the speculative short in the market as at close to record levels, which can lead to sudden swings in the market. Time will tell whether the weather risks, are enough to warrant a sustained rally or whether the large global stocks are enough to constrain pricing.

The A$ has been like a steamroller since the beginning of December (figure 2), with 81¢ being achieved last week. Whilst there has been

a modest fall, it has remained stubbornly above 80¢. The RBA have their first meeting of the year next week, and it is expected by most that rate will remain at current levels (1.5%). However, currency analysts are having divergent views on when rates will rise, with the following forecasts:

  • ANZ forecast two rises in 2018, with the first possible in Q2
  • Credit Suisse believe that there is the potential for a rate cut in 2018
  • UBS forecast no rate hike in 2018
  • Morgan Stanley forecast no rate hike in 2018, but a rise in 2019

I was asked this week why local prices have not moved in line with futures. The futures prices have rallied, at the same time as the A$. This takes some shine off when converting to a local value. However, the basis level has slid downwards since harvest. It has to be remembered that basis levels are still very strong, and technically we are actually receiving very strong prices compared to the rest of the world.

In recent months, we have discussed the reality of high basis prices and provided some advice on ways to lock in basis through a physical sale, and keeping exposure to the futures market. Those who followed this advice, have now benefitted from locking in a historically strong premium, and can now also benefit from futures rises.

I recommend reading the following article on, which briefly explains a number of strategies:

How to defer grain pricing

What does it mean/next week?:

As always at this time of year the market will be looking towards the weather, what does it have in store for the northern hemisphere crop. It is currently a balancing act between potential depleted production in 18/19 against record global stocks.

The RBA interest rate announcement will be made, it is likely to remain the unchanged and remain at record low levels.


Supply normal, prices stable, watching the sky.

After a significant spike to throughput for sheep and lamb at the start of January yardings figures have returned back within the normal seasonal range, combined with cool temperatures and a bit rain, prices have managed to hold firm for most categories of sheep and lamb this week.

The ESTLI barely changed, rising a slight 4¢ on the week to close at 637¢/kg cwt, similarly National mutton gained 4¢ to close at 407¢/kg. Table 1 highlights the Eastern States closing prices yesterday for a range of lamb and sheep categories with all but Merino lamb posting an increase.

East coast Restocker lambs staged a late rally jumping 30¢ yesterday to close the week up 9.7%, the best performer in the group. East coast Merino lamb the laggard, but only off 5¢ to register a 0.8% decline. A bit of a tussle between Victorian and NSW Merino prices this week, with Victorian Merino back above 600¢ after a 9.5% gain while NSW lost 4.3% to close at 582¢/kg cwt. In the West Trade Lambs the strongest category this week up 2.8% to 627¢, but still 10¢ shy of the ESTLI.

Figure 1 demonstrating that East coast lamb throughput has returned to more normal ranges, albeit it 27% above the seasonal average for this time in the year with just over 173,000 head yarded. A similar pattern displayed this week by East coast sheep with yarding levels sitting 20% above the seasonal average, but also within the 70% range, with around 70,000 head changing hands at the sale yard.

East coast lamb slaughter showing no signs of capacity issued despite the TFI disaster at Murray Bridge. SA lamb slaughter trekking well below average for this time of the season and sitting 38% under the seasonal average, understandably. However, some of the supply being taken up by Victorian and NSW meat works with the total East coast lamb slaughter running just 16% under the seasonal average – figure 2.

What does it mean/next week?:

A mixed bag for forecast rainfall into next week with the Western sheep rearing regions getting some good falls but most of the South-east missing out. However, BOM modelling for February shows a good chance of above average rain over the whole month for the South East and a very high change for continued rain in the West which is likely to provide further pricing support into the coming few weeks.

A little bit of rain and steadying prices

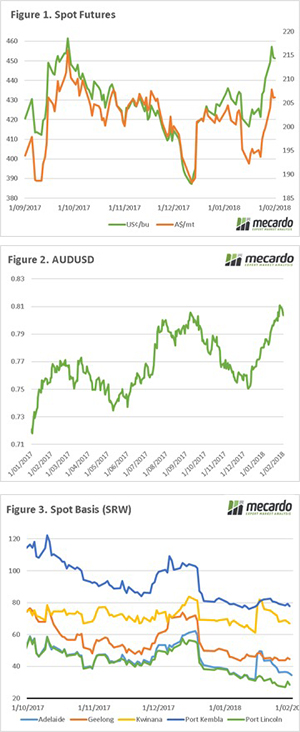
There was a bit of rain about in the south this week, and the markets stopped falling, and even gained some ground in some categories.  There is good rain forecast in Queensland over the coming week, so we might expect a bit more upside.

There was plenty of rain in the country’s North West, but this has little bearing on cattle markets on the east coast.  Eastern and Northern Victoria also saw some reasonable falls, which seems to have tightened supply.  It’s hard to know now that weekly yarding figures are almost a week old.

Figure 1 shows that Victorian Trade Steers had a solid rebound this week, after dropping to a two and a half year low.  The Vic trade steer indicator is sitting at 502¢/kg cwt, and NSW and Queensland have fallen to almost meet it, at 536 and 513¢/kg cwt respectively.

Feeder prices were relatively steady, and restockers a bit weaker, but the Eastern Young Cattle Indicator (EYCI) rallied 7¢ for the week, getting back to 538¢.  More interesting is the very weak EYCI supply.  At 13,787 head EYCI yardings were at winter levels.

Export markets had a small rise, with the 90CL indicator gaining 4¢ to 568.6¢/kg cwt, to move to a 5% premium to the EYCI.  Cattle prices seem to be a little underpriced, relative to the export market, and some rain in Queensland over the coming days might help correct this.

In the West the WYCI appears to be closer to ‘fair value’.  It lost 16¢ today to hit 573¢/kg cwt, but remains at a strong premium to its east coast counterpart.

The week ahead

Figure 2 shows us that it’s going to be a wet few days in most of Queensland.  Whether this is enough to move the market over all of the east coast is questionable, but figure 3 shows it’s about this week that southern supply starts to tighten, and prices start to rise.

We didn’t see a late summer rise last year, but you might say we are due.

Do more mouths equal more money?

Key Points

  • Real prices of wheat have fallen drastically since the 1970’s, whilst population has drastically risen.
  • Farmers around the world have increase production to meet demand, without utilizing more land. The increases have been because of yield improvements.
  • Since the 1970’s the world has produced around 100kg of wheat per person.

It’s a statement heard regularly for the past century, the world is growing and it will need to eat. The logic is that with more mouths, there will be more demand. As demand rises, then prices should follow. However, in grain that doesn’t seem to be the case, why is that?

A couple of weeks ago, I was contemplating the price of wheat versus the rise in global population over the past decades. I ended up with figure 1, this shows the real price of wheat (in 2012 prices) against the world population. It is clear that in real terms prices have fallen substantially, at the same time that the population has risen.

It is logical to assume that demand has increased, as the world grows. However, there must be a reason behind the lack of upward movement in pricing. Let’s take a look at production, and what has occurred in the same period.

In figure 2, global wheat acreage and production is displayed. As we can see acreage, has largely remained within a narrow band. We can however see that production has drastically increased in the same period, if it’s not through land increases, it’s obviously yield.

In figure 3, the population and yield are presented. Since the early 60’s to present yields have drastically increased. The average yields in the 1960s was 1.2mt/ha, this decade it is 3.2mt/ha. An astronomical increase brought about through technology, agronomy and management practices.  When we compare population and yield, they both run in a very tight parallel as can be seen in the linear trendline.

To further demonstrate our ability to produce wheat on a very large scale, the generative capacity per population is shown. This is the amount of wheat available per person, if shared equally on an annual basis. After a strong increase in yields during the 1960s, the world has continued to provide an average of 100kg’s of wheat per person.

Clearly, human society has been able to advance wheat yields to keep in line with population, at an almost step for step change. This has been because of farmers adopting farming practices which enable them to produce larger crops. However, by meeting demand, has this resulted in a constrain in prices?

What does it mean/next week?:

The world population is expected to follow a linear path until it reaches between 9bn by 2050, and as high as 12bn in 2100. The world will be required to produce a global average yield of 4.3mt/ha to maintain a 100kg’s per person productive capacity.

Is this possible? Well there are still vast tracks of land in the world that are still unproductive, which could bump up yields. There is a lot of buzz around agtech, will new precision ag technologies allow for improve production and efficiencies?

Prices do not always equal profitability, as an efficient farmer with low prices will be more profitable than an inefficient farmer with high prices.

The question is, is higher production the best solution for farmers?. Although production increases will help societies prosper through lower malnutrition, will it provide increases in price?

Cardings take the heat

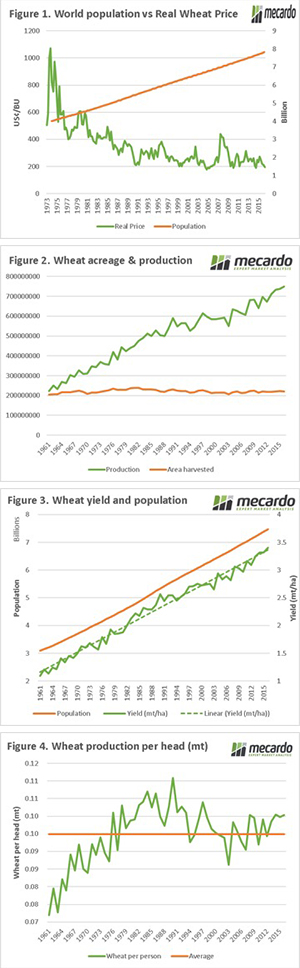
The wool market took a bit of a hit this week with most categories losing ground, with the exception of the very fine end. Cardings were hit particularly hard with the combined average fall for all three centres coming off nearly 200¢.

The higher A$ saw the falls in US $ terms lessened, but the benchmark Eastern Market Indicator (EMI) ended the week off 57¢ to close at 1744¢. The Western Market Indicator (WMI) mirrored the Eastern falls to register a 39¢ decline to 1821¢ – figure 1.

The Southern Carding indicator the worst performer of the three centres off a whopping 230¢ to see it move back under 1300¢. Northern and Western Cardings off 179¢ (1334¢) and 184¢ (1319¢), respectively.

17 micron and finer managed slight gains between 5-15¢ but most of the medium to coarse categories posted losses of a 20-70¢ magnitude. Reports from the auction floor stated that buyers were happy to pay for better prepared, quality lines but anything that was poorly prepared or suspect in quality was reasonably discounted, with buyers showing a willingness to step aside.

Growers reluctant to chase the falling market lower saw the pass in rate lift to 14.3% with 36,430 bales sold from a total offer of 45,525 – figure 2.

The week ahead

Chinese mills likely to begin the wind down in activity as we head toward the New Year festivities there and may mean buyer interest continues to wane in the coming week. A rampaging A$ above 81US¢, thanks to Trumps comments over the weekend unlikely to provide a lifeline for wool prices this week.

Sales are scheduled for Wednesday and Thursday in all three centres with a total of 42,244 bales on offer.

The opposing views of the white house

The week has overall ended up positive for grain producers in Australia. The market has been largely driven by noises from the white house, which seem to have very opposing views on the future of their economy. In this weeks comment, we take a look at the descent of the Chicago futures, and the strong ascent of the Australian dollar.

The futures market has regained some traction in the past week, with Chicago spot futures up 4% since the 19th Jan. There are some concerns about weather in the northern hemisphere, but the increase in futures has largely come from weakness in the US Dollar. In figure 1, the spot Chicago futures are shown in both US¢/bu and A$/mt.

The fall in the US$, and the subsequent rise in A$ has led to the increase in A$ wheat swaps being weaker, albeit still reasonable at 3% week on week.

The US$, has been weakening in the past fortnight due to mixed signals from the US administration. The US secretary of state, had made comments pointing towards a weaker US$ being positive for the economy. This sentiment points to the likelihood of limited interest rate rises in the coming year. However, President Trump provided a conflicting view that the dollar will be stronger, and that was the aim of the government.

In figure 2, the US dollar index (DXY) is plotted. The DXY is an index based on a trade weighted basked of currencies against the US$. In recent weeks, the greenback has declined to it’s lowest point since December 2014.

This weakness has flowed through to the A$, which has gained ground to close above 81¢ (figure 3). The improving value of the A$, contributes to making local export commodities less competitive on the world stage, however in theory imports should be cheaper.

The current rise in the A$ is largely as a result of US weakness, and with the unknowns of the political machinations of the white house, we could be in for a rocky period of time. If the market regains confidence in President Trump’s claims of a stronger dollar, we could see a decline in the A$.

What does it mean/next week?:
The market continues to look towards the northern hemisphere. We are currently experiencing La Nina conditions which can lead to a drier than normal conditions in the US, this is starting to be seen.

We are still a long way from the finish line when it comes to the US crop, but signs are point towards relatively poor conditions, and with low planting figures any issue can be exacerbated.