Month: March 2018

Wheat a WASDE time.

It’s been an interesting end to February, providing reasonably strong increases in futures prices. Overnight the WASDE report for March was released, has it provided any fire?


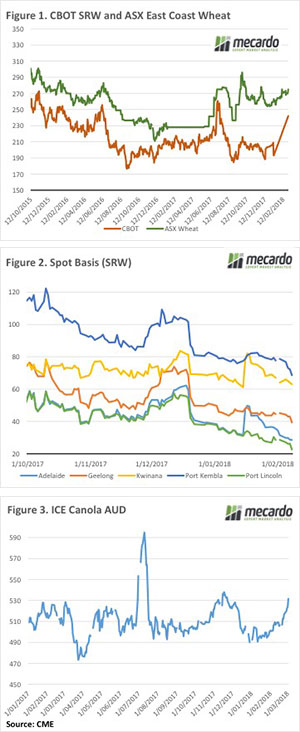
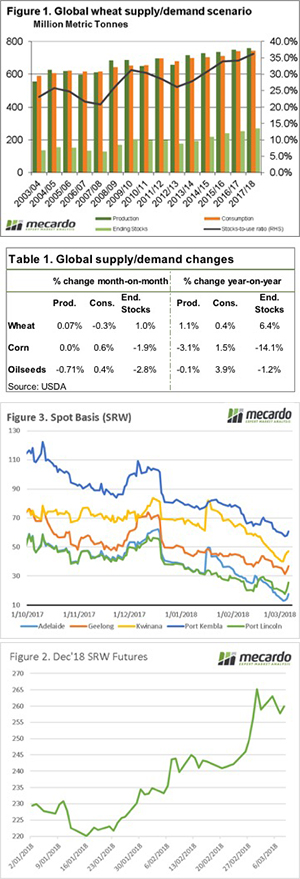
The USDA have yet to switch over to forecast the coming crop, therefore at this point in the year the potential for large changes is limited. The main takeaways from the report, were a continued increase in end stocks for the 17/18 season to 268mmt (figure 1).

The report was largely neutral to bearish for wheat. The story for corn was somewhat more bullish, with South American weather woes leading to a 7.7% production fall in Argentina. The end stocks are forecast to end 14% (table 1) lower than last season, and the lowest since 2013/14.

The futures market has provided some good increases in value for producers in the past three weeks, but last week the market has traded in a directionless band whilst the trade awaits potential rains. In figure 2, the December futures (in A$/mt) is displayed. At present, the pricing level has provided better opportunities for locking in profitable prices for the approaching harvest.

What about basis? Well as expected premiums have fallen dramatically since harvest (figure 3). In past analysis articles, we have pointed towards the record levels and the likelihood of a correction. This has led to our prices at a flat price remaining relatively flat, as futures increase, basis levels fall.

Our article outlining our strategy in October, would have worked perfectly for producers this year. We advocate that producers move away from flat pricing and look to lock in component pricing separately to ensure that little is left on the table.

Lock in premiums, keep exposure

What does it mean/next week?:

It will be interesting to see if there are any reactions to the Trump tariffs. Will this lead to a trade war which could begin to envelope agriculture commodities?

What a difference a rain event makes.

A good dumping of rain in Queensland over the week has seen East coast cattle throughput fall back toward more normal levels, led by declines in Queensland. The rain and lower supply has provided some support to northern cattle prices and has given the Eastern States Young Cattle Indicator a lift, closing 5% higher to end the week at 565.5¢/kg cwt.

Figure 1 shows the effect of the significant tropical low over Queensland that generated total weekly falls in excess of 200mm in some parts of the north west, northern interior and northern tropical coast of Queensland.

The impact of the northern rain has seen Queensland cattle yarding levels ease 41% over the last fortnight toward levels much more consistent with the longer term average pattern for this time in the year – Figure 2. The drop in Queensland cattle throughput has been mirrored in the broader East coast figures, with a 28% decline noted over the last two weeks to see it sit 6% above the five-year average at just over 56,000 head.

State sale yard cattle indicators, as reported by NLRS during the week, show that gains in Queensland cattle categories ranged between 5% to 20%. Queensland Vealer Steers were the standout performer, with a 60¢ rally early in the week to reach 357¢/kg lwt. NSW and Victorian cattle prices were a little more muted, with most categories flat to 5% higher.

In the West young cattle eased 3.8% on the week to return to levels more consistent with their East coast counterparts, the WYCI closing at a mere 3.25¢ above the EYCI to reach 568.75¢ yesterday. In offshore markets, the 90CL Frozen cow continued to trek sideways, closing slightly softer on the week, 1.7¢ lower to 599.9¢/kg CIF.

What does it mean/next week?:

There is another huge tropical low sitting to the north of Queensland, but much of the significant rain from this is forecast to fall into the Gulf of Carpentaria, with only 10-25mm making its way onto land in the far North.

Given the volume of rain into Queensland over the last fortnight, it’s unlikely that cattle prices will ease much there in the week ahead. The 90CL is likely to find some continued support into the coming month as a firm domestic price outlook will keep buyers keen for imported grinding beef.

“Market can only go up …..”, or can it?

After a week of new record levels last week, the wool market this week delivered a timely warning; despite all the optimism and a good dose of hype, markets have their own set of drivers and will at times surprise.

It is probably unfair to say that the results this week were a surprise, with the market at record levels customers (buyers) are within their rights to test the resilience of current prices.

The Au$ didn’t do the market any favours; improving over the week by almost US0.01. This contributed to the Eastern Market Indicator (EMI) to falling by $0.52 to close at 1778¢, while in US$ terms it eased 22 cents. As well, the Western Market Indicator (WMI) also lost ground, giving up 46 cents to finish at 1859 cents. For the week, the EMI in US$ terms fell 5 cents.

After last week posting new records, the EMI this week reflected a weaker market from the outset. Falls were across the board for Merino types, again AWEX reported that the lesser types were most effected.

Falls of 40 to 80 cents was the general rule, however those lots with poor mid break, strength or VM figures at times lost 100 cents.

Skirtings weren’t spared either, with the falls in this category generally in line the fleece.

X Bred types bucked the trend of the week, with the 25 to 28 MPG showing solid results to finish 10 cents dearer. There was a note from the market that poorly prepared lots at times found it difficult to attract interest. Cardings continued to lose ground, across the three selling centres the decline was 34 cents.

An area of interest was that despite the significant pull-back this week, growers only passed-in 4.2% of the offering, perhaps a good indication that they are hesitant that further upside is assured in the market.

A slightly increased offering of 45,500 bales was offered, with 40,600 sold with growers passing-in almost 5,000 bales.

The week ahead

Sales are scheduled for all three centres next week conducting a 2 day sale with Melbourne conducting a 3-day sale on Tuesday, Wednesday & Thursday. Fremantle & Sydney have a 2-day roster.

A total of 43,894 bales are rostered for next week, with almost 2,000 less rostered than this week’s offering; the roster continues to hover at these levels over the following 2 weeks with an average of 43,000 anticipated.

Plenty of lambs and sheep to the slaughter.

It seems there was plenty of slaughter capacity which wasn’t being used last year. Despite the Thomas Foods fire taking out 55,000 head of capacity per week, sheep and lamb slaughter runs well above last year’s levels. Prices are responding accordingly.

What you normally see is if lamb slaughter is higher, sheep slaughter is lower, and vice versa. However, what we are seeing at the moment is that despite plenty of capacity being taken out, both sheep and lamb slaughter is stronger than last year.

At the end of last week east coast lamb slaughter was 7% higher than last year. Sheep slaughter was 43% higher than last year. In total there were 64,000 head more sheep and lambs slaughtered last week than the same week last year (figure 1). This was a 14.6% increase, and it seems to be driven by a dry summer in Victoria, South Australia and Western NSW. As outlined last week, the extra stock are being slaughtered in NSW and Victoria.

Yardings were steady this week, but don’t be surprised to see slaughter at least as strong as recent times.  It’s hard to see supply being tighter when the Eastern States Trade Lamb Indicator (ESTLI) has fallen below 600¢ for the first time since October.

Mutton prices didn’t suffer as much this week, easing 5¢ on the east coast to 405¢/kg cwt, and gaining ground to 416¢ in the west.

While on the west, they had the most expensive lambs in the country this week. The WA Trade Lamb Indicator was at 625¢/kg cwt this week.

The week ahead

There is no rain on the way, but we are in for a series of short weeks. What this does to the market is debateable, but in general you’d expect lower kills to see prices weaken further, or at least struggle to rise.  The good news is the heavy kills we are seeing now means that there will be fewer lambs later, and this means higher prices. We might have to wait for some rain before any serious rally eventuates however.

First shot fired in securing autumn and winter lamb supply

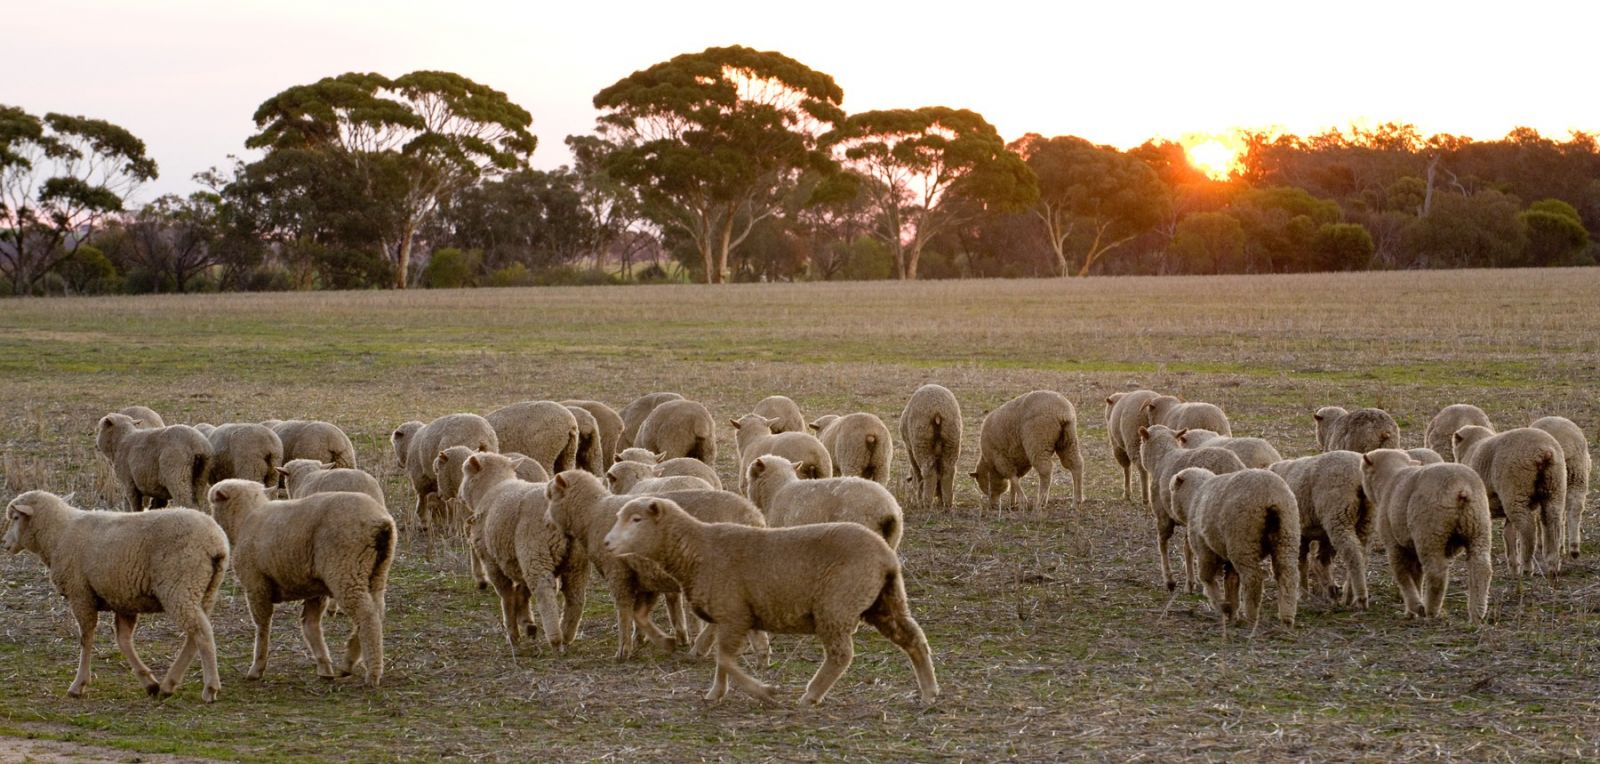
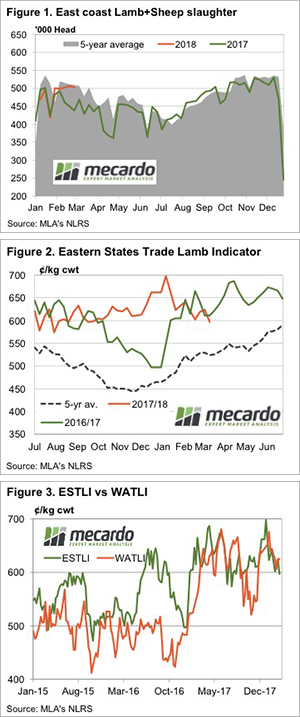
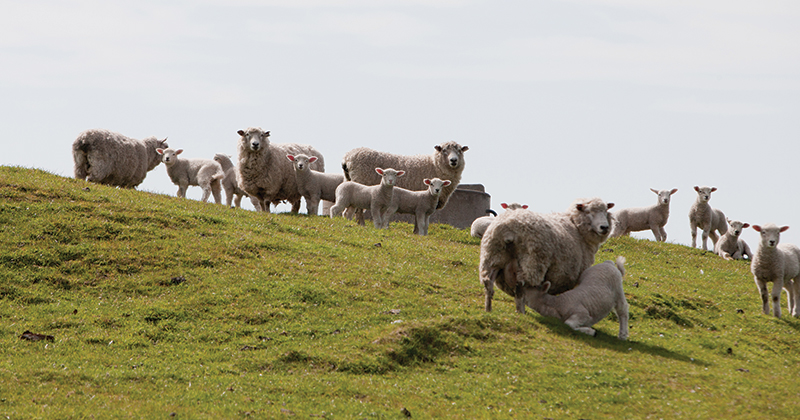
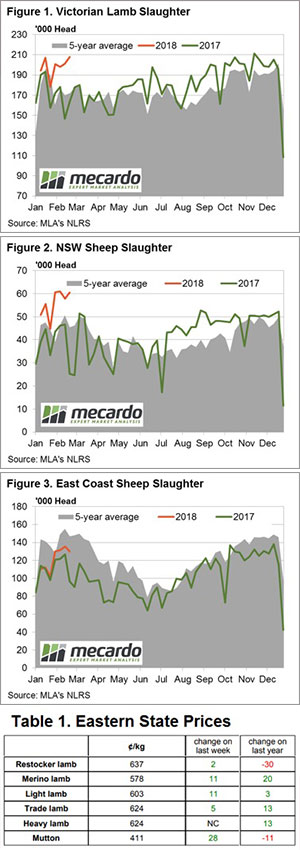
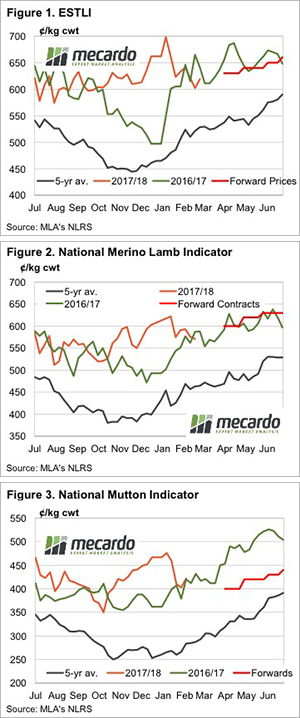
Earlier this week the first forward contract prices for lambs and mutton for the April to July period were released.  While there were few surprises on the pricing front, it’s worth taking a look at the values, and how they compare to historical price movements, and where prices were last year.

Thomas Foods International has plants in South Australia and Tamworth, and this week put out extensive forwarding pricing grids in an effort to secure supply for autumn and winter for both locations.

The forward contracts are available from April to the end of July, with prices for cross bred and merino lambs, and mutton.  The contract values are 10¢ higher for delivery to Tamworth for lambs, but are the same for mutton.

Figure 1 shows the Eastern States Trade Lamb Indicator (ESTLI), along with the forward contract prices for Tamworth.  Remember, Lobethal is 10¢ lower.  Forward prices for cross bred lambs have been pitched at the lower end of the range of 2017 saleyard prices.

There is some incentive for growers, with price starting in April at a small premium to current values, and increasing by 10¢ per month thereafter.  Figure 1 shows that the average price rise from March is stronger than that predicted by the forward prices.

For Merino lambs the contracts are largely priced at stronger levels than 2017 saleyard prices at Tamworth (figure 2). However, they are 20¢ lower at Lobethal from May, which puts them at similar pricing to last year.  In terms of trends, the merino lamb contracts are priced at a better premium to current levels, but don’t match the average rise we normally see into June.

While the lamb contracts look ok relative to last year, the mutton contracts look decidedly cheap.  Figure 3 shows forward contracts tracking 60-100¢ lower than the same time in 2017.  It should be noted that the price shown on figure 3 are for Merino Ewes.  Merino wethers are 20¢ stronger, and crossbred ewes 20¢ lower.  Still, the forward contracts only really offer current values, plus a bit more in the winter.

What does it mean/next week?

If feed is cheap, ie grass, the forward lamb contracts offer good value for those looking to buy, or hold store lambs for sale later in the autumn or in winter.  If feeding a full ration, some careful calculations need to be done to assess whether it might be better to sell now.

For sheep the forward contracts look a little cheap given usual seasonal trends of tightening supply, and improving prices thought the autumn.  There is a risk of a failed autumn break in southern NSW, Victoria and South Australia, which would make current prices look attractive, so a bit depends on your views on the weather.

Key Points

  • Forward contracts for lamb and sheep have been released this week with prices at a premium to current levels.
  • For cross bred lambs forward contracts offer reasonable value, and good value for merinos.
  • Forward sheep contract look a bit cheap given usual seasonal trends, and last years prices.

A bit of a delay but here comes the rain rally.

It rained last week, and it’s going to rain in the dry areas. By the end of next week the whole of Queensland will be wet. Parts which haven’t been wet for five years will be wet. It’s been long awaited, but finally we have seen enough rain to give the market a bit of upward momentum.

In the young cattle space the market finally turned. It’s been eight weeks of gradual easing, but this week demand picked up and the Eastern Young Cattle Indicator gained 17.75¢ to 539¢/kg cwt (figure 1). Interestingly, EYCI yardings were actually higher, which is a tell-tale sign of stronger demand.

Despite the rally, figure 1 shows us that young cattle are still pretty cheap relative to the last two years at this time.

Most cattle categories gained ground this week as overall cattle yardings dropped back towards more normal levels. Cow and Heavy Steer prices picked up slightly, but remain stuck in the narrow range they’ve been trading at so far in 2018 (figure 2).

There was one indicator which caught our eye. Restocker steers in Victoria were priced at just 232¢/kg cwt.  A whopping 143¢ lower than this time last year, and 100¢ below the national average restocker steer. It was probably on very small numbers, but someone got a bargain.

Things were fairly steady in the west, the WYCI at 579¢/kg cwt maintaining its premium to the east coast market. Recent rain in the west might see further upside, but the 90CL price at 600¢ suggests upside is limited.

The week ahead

Over the last 12 months Western Queensland’s rainfall has been in the ‘very much below average’ decile.  In figures its rainfall has been 100-400mm below average. Figure 3 shows that in some parts at least, the rainfall deficit will be rectified over the coming week. We know grass doesn’t appear instantly, and neither does demand, but there aren’t going to be many cattle coming out of Western Queensland for a while.

The panic has set in….. for now

The panic has set in. US wheat markets are caught in a classic weather scare, with the dry conditions outlined in our analysis this week set to continue for another couple of weeks. This has seen ever increasing moves higher in the last three sessions.

Yesterday I was asked, ‘how long have I got to get a hedge on?’ The answer is you’ve got until some rainfall comes on the 7 day forecast for the US. It really is that simple at the moment. Dryness has spurred the market. The start of the month saw funds jump on board. With very little change in fundamentals, in three days CBOT wheat has gained 39¢/bu, or 9.5% with the May contract at 515¢/bu.

In our terms the May CBOT contract is $243/t (figure 1), December 18 at $264/t and March 19 is at $270/t.  The pricing for our new crop, with around average basis, will give a price close to $300/t.  In fact, ASX East Coast Wheat futures are offered at $303/t this morning, but this would be a good jump higher (figure 1).

As expected, local prices haven’t risen as quickly as CBOT. There will be further upside today, but in the Geelong Port Zone the $15 rise in CBOT to yesterday had translated into just a $6 rise in APW. Figure 2 shows the decline in basis.

Canola has also found support this week, with ICE futures up again last night to almost meet its early December high in our terms (figure 3). Again, local prices have found some strength from the international market, but basis has weakened to the negative $20-25/t level.  This is extremely low.

The week ahead

Should we be selling into this rally? Good question. We don’t like selling at weak basis, but absolute prices are easily at 2018 highs for wheat, barley and canola. One strategy would be to sell futures or swaps for the new crop, and wait for basis for old crop to improve. This will either come from higher physical prices, or lower international values. Most likely lower international values, especially for wheat.

Au$ assists wool market.

A solid market given a slightly increased offering was the tone for this week, although the Au$ falling against the Greenback (US$) was the principle reason for a generally stronger market.

This resulted in a number of key indices setting new record levels again. Prominent was the 21 & 22 MPG indicators in the south, lifting 30 & 50 cents respectively.

For consecutive weeks the most significant factor was the Au$; by the end of the week it was quoted down a further US$0.007, sitting comfortably below US$0.78. This assisted the Eastern Market Indicator (EMI) to rally by $0.10 for the week to close at 1830¢. As well, the Western Market Indicator (WMI) also improved 10 cents to finish at 1895 cents. For the week, the EMI in US$ terms fell 5 cents.

The market opened strongly on Wednesday where the EMI reached a new record level of 1834 cents, hurdling the previous high of 1822 cents with ease. On Thursday it gave back a little ground, however overall a strong week for the wool market.

Skirtings had a mixed week in line with fleece types; better measured types attracted at times strong competition while high VM pieces had irregular demand.

X Bred types also had a varied week, 30 & 32 MPG was cheaper, while 25 to 28 MPG generally dearer, although not by a lot. Cardings again lost ground, although in Melbourne AWEX quoted slightly firmer.

As previously reported, it is usual at this time of year for the supply of wool with high mid breaks to grow. This is resulting in an increase in the discount for these types, at times 80 to 100 cent deductions compared to the corresponding low mid break types.

Of the 44,150 bales originally offered, 41,227 sold with a Pass-in rate of 6.6% or almost 3,000 bales.

To date this season, the average bales sold to the trade per week has been 42,000, compared to 38,200 for last season. There is concern about supply going forward, with a question mark over the capacity for this season to remain above 2016-17. The next few weeks will confirm this one way or another.

The week ahead

Sales are scheduled for all three centres next week with Melbourne conducting a 3-day sale on Tuesday, Wednesday & Thursday. Fremantle & Sydney have a 2-day roster.

A total of 46,490 bales are rostered for next week, almost 2,000 more than this week’s offering; the roster drops away over the following 2 weeks with an average of 41,500 anticipated.

A muted start, but don’t write it off – Tet!

  • The live cattle trade flow to Indonesia remains under pressure due to high local prices and stiff Indian competition.
  • Chinese live cattle volumes are showing signs of a resurgence, particularly in the last quarter of 2017.
  • Vietnamese demand for Australian live cattle continues to remain robust.

A comparison of historic seasonal monthly live cattle trade flows shows that it isnot uncommon to see January post the lowest cattle movements for the year. This is because the monsoon weather patterns generally make it more difficult to get cattle out of the northern ports. This January, total live cattle consignments have started the season in a similar fashion to 2017 – below the five-year January average by about 15%, but still within the normal range.

Figure 1 highlights the historic seasonal trend which shows that we are pretty much on par with last year with 64,400 head reportedly making their way offshore. Meat and Livestock Australia (MLA) report that a total of nearly 880,000 head of cattle left the country during 2017, some 20% below the average annual volume for the last five years.

The impact of tighter local supply and subsequent high prices having an effect on offshore demand, particularly in Indonesia – where competition from Indian buffalo meat continues to pressure the flow from Australia. Indeed, nine months of the 2017 season saw live cattle flows to Indonesia fall short of the comparable monthly seasonal average, based off the five-year historic data (Figure 2). The last quarter of 2017 was particularly soft with trade flows averaging 27% below the five-year trend and 34% under the comparable period during 2016.

Chinese flows appear to be becoming more frequent, after a somewhat sporadic season in 2017 with successive live trade reported for the last four months – figure 3. Indeed, 2017 was a bit patchy with no trade reported during May, August and September. However, Chinese demand finished 2017 strongly with average monthly flows of the last quarter of the season sitting 27% above the five-year final quarter average. January 2018 has started the season a little muted, sitting 10% below the five-year January average with nearly 3,700 head reported.

In contrast, live cattle flows to Vietnam have performed strong and steady, with nine months in the 2017 season posting volumes above the respective monthly long-term average pattern – figure 4. The second half of 2017 was particularly solid with average monthly flows over the period coming in 80% higher than the seasonal average trend. January 2018 consignments have shown a similarly robust start to the year with more than 17,000 head reported, a 70% gain on the five-year January average.

What does it mean?:

It’s not uncommon to see a strong start to the live slaughter cattle trade to Vietnam at the beginning of the year as the country gets prepared for the annual Tet New Year celebrations, usually held late January/early February.

However, the strong performance of Vietnamese demand for Australian live cattle throughout much of 2017 is a promising sign given that these flows account for around 15% of the total live cattle trade out of Australia, based off the five-year average market share.

The high local cattle prices appear to have had limited impact on Vietnamese flows over the 2016 and 2017 seasons. As local production increases and prices ease toward the end of the decade with the herd rebuild gaining momentum there is a good chance this will translate to greater Vietnamese demand in the coming years – particularly as their population grows in size and in average wealth.

Getting by with a little help from… the rain.

The trend in lamb and sheep slaughter figures this season show pretty clearly that the neighbouring states are picking up the added workload stemming from the Murray Bridge fire out of South Australia. Victorian and NSW lamb and sheep slaughter is trekking well above seasonal average levels and those recorded last season for the week ending 23rd February, while the opposite is true for South Australia.

Despite Victorian lamb slaughter sitting 21% above the five-year seasonal average, as shown in Figure 1, the total east coast slaughter is only 3% higher for the season with nearly 376,000 head processed in the previous week. In contrast, current SA lamb slaughter is trekking 29% under the seasonal average level for this time of the year.

A similar story for mutton, with NSW slaughter volumes 33% above the seasonal average – Figure 2, while SA mutton slaughter is currently 44% below the average seasonal pattern. The broader East coast mutton slaughter somewhat reflective of the flock rebuild phase with levels trending 11% under the longer-term average but 35% higher than this time last year – Figure 3. East coast slaughter moved slightly higher over February compared to the 2016 pattern as the forecast wetter February period failed to fully materialise.

There was some relief for the last week of February with some reasonable falls across much of the eastern side of NSW and in WA. This provided a bit of a lift to East coast mutton prices, up 7% on the week to close back above 410¢/kg cwt. East coast lamb categories ended the week with flat to small gains (see Table 1.), the benchmark Eastern States Trade Lamb Indicator (ESTLI) up a fraction to close at 624¢/kg cwt.

What does it mean/next week?:

Some very solid rainfall is forecast for Queensland in the coming seven days, but not a lot will make its way further south. Indeed, much of the nation’s prime sheep rearing country will miss out. As Table 1. highlights, most categories of lamb and sheep prices are not too far away from levels seen this time last year. With prices this robust from a historical perspective and nothing much in the way of rain on the horizon as we head into Autumn prices are likely to ease slightly into the coming week.