Month: April 2019

ESTLI back through 700¢ but only catching OTH

Lamb prices have had another positive week, with the Eastern States Trade Lamb Indicator (ESTLI) heading towards Easter above 700¢. As outlined earlier in the week, this could just be the start of bigger things to come.

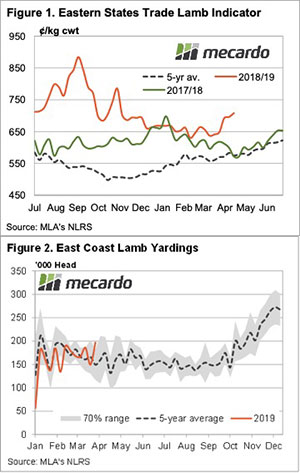
It’s hard to get too excited by the ESTLI breaking through 700¢ since November. Over the hooks (OTH) prices have been above 700¢ for much of the first three months of the year and the saleyards have taken plenty of time to catch up. The unexpected strong supplies have kept a lid on saleyard prices as processors generally have gotten their fill direct.

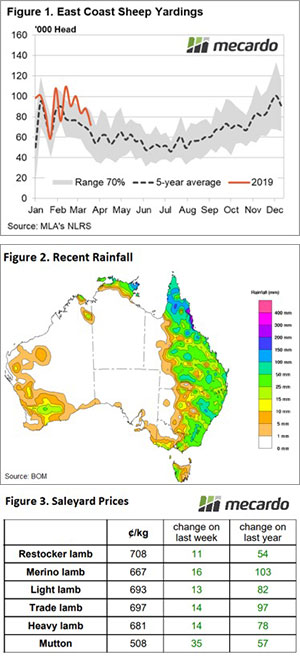
With the release of yardings data for the week of the fourth, we can see why prices steadied last week. Figure 2 shows East Coast Lamb yardings hitting their highest level for the year, just shy of 200,000 head. The rapid price rise of the previous week no doubt drew out remaining good lambs, but things might have tightened a bit this week.

Lamb prices rallied in the west too. The WA Trade Lamb Indicator gained 20¢ this week to hit 674¢/kg cwt, the highest price since the first week of the year. WA mutton is lagging the east coast, sitting at 438¢, while the east coast is on 509¢/kg cwt.

Sheep yardings were also higher on the east coast last week and this might have continued this week.  No doubt those still waiting for rain are finding 500¢ mutton very attractive.

What does it mean/next week?:

There is little rain on the forecast on the east coast but it looks like autumn might kick off for parts of WA this week. We are also in for a couple of short weeks which can work for or against the market depending on how supplies are tracking. There are reportedly still plenty of lambs booked up, so don’t expect strong rallies for lambs this week, but after Easter things will be interesting.

Crossbred fibres on trend

The wool market has progressed through another week sitting firm. The Merino market saw slight declines in the east and west but it’s the Crossbred market that’s attracting all the attention. 

For the fourth consecutive week, crossbred prices have risen which is a direct contrast to the seven consecutive weeks of declines in the Eastern Market Indicator.

The increasing selection of low yielding wool was still a prominent feature of this week’s market. Despite the offering in Sydney being the smallest since AWEX records began (1995), the limited supply wasn’t enough to counteract the discounts on poor quality wool.

The Eastern Market Indicator (EMI) eased by 7 cents to settle at 1,936 cents. The Au$ was slightly stronger at US $0.716. This was enough to put the EMI in US$ terms up 4 cents finish the week at 1,387 US cents (Table 1).

In Fremantle, the Western Market Indicator (WMI) declined by 31 cents to finish at 2,064 cents. AWEX made note that the Western Indicator does not include crossbred types which explains why the losses in the West have been more substantial than in the East, they aren’t being supported by strong crossbred values.

37,527 bales were offered for sale this week. 10% of the offering was passed in which meant 33,793 bales were cleared to the trade. In the auction weeks since the winter recess, 1,158,527 bales have been cleared to the trade, 222,475 fewer than the same period last year. The average shortfall cleared to the trade compared to the same time last year now sits at 6,741 bales per week fewer.

The dollar value for the week was $69.54 million for a combined value of $2.690 billion so far this season. A simple calculation of $ value divided by bales sold gives us $2,058 per bale across all types for the week.

Crossbreds gained another 20 to 30 cents this week, and the 28 micron even hit a new record in the South, closing at 1,263 cents clean on Thursday. This weeks analysis article looked into the strength in crossbred prices compared to the broader Merino market so for a more detailed analysis read the article Here. The cardings indicator declined by 5 to 15 cents on the east coast, and gained 5 cents in the west.

The week ahead

Week 42 of the season is the last week before the Easter recess. 42,487 bales are rostered across the three centres, with sales just on Tuesday and Wednesday.

Should we be selling new crop wheat?

It’s too early to call the season, with the majority yet to sow their first seeds for the year. In this update I examine pricing for the new season. Should producers be selling wheat at these levels?

This season has been astronomical in terms of price with the market reaching historic highs across most zones in October. Although most of the benefit has been felt by producers in Western Australia who have had a very strong year in terms of production.

The spot market has fallen from these peaks since the start of the year (figure 1). At present pricing has found its floor, as consumers purchase hand to mouth. The only supply available will be from Western Australia until the new crop. This is likely to keep prices around this level until the new crop arrives.

The question now really remains – when we get to new crop, the price will be dependent upon the rainfall from here on in.

At present however, prices are still reasonably strong for new crop (figure 2). This is due to the great uncertainty when it comes to the crop. Currently subsoil moisture is low, and the pantry will likely be empty by harvest. As time counts down to harvest the new crop and old crop will converge, if conditions don’t improve then the price will converge upwards to meet old crop pricing. Conversely the opposite will happen if the conditions improve.

The price premium for spot over new crop currently sits at the following:

  • Adelaide 11%
  • Geelong 17%
  • Kwinana 14%
  • Port Kembla 17%
  • Port Lincoln 15%

This shows up in the basis levels versus the CBOT Dec’19 contract. At present the Dec’19 contract is at A$253/mt. This results in attractive basis levels on the east coast ports (figure 3), especially if recent drought premiums are excluded.

What does it mean/next week?:
I have always tended to advocate a conservative ‘small bite’ selling strategy for producers. Locking small proportions over time dependent upon price, with a view to aiming for an average to above average price.

At present prices on offer for the 2019/20 harvest are historically attractive, and they do offer some value in selling

If the season becomes bleak that price might not be attractive, whilst conversely it could become your best. It’s all about minimizing exposure at this point of the year.

This also applies in the same way to consumers of grain, purchasing at these levels removes exposure to >$400/mt values if a second year of drought eventuates.

Key Points

  • Old crop trades at a substantial premium to new crop.
  • Basis levels are quite strong for new crop vs Dec’19 Chicago wheat futures.

Weekly Wool Forwards for week ending 12th April 2019

Last week, only two wool trades were agreed, and the relative quiet continued this week.  Only four trades were dealt, with two of these being for crossbred fibres. Interest in crossbreds is higher than average, and that’s likely to be because of the good historic prices they are experiencing.

In the medium wool category, two trades were agreed for 21 Micron wool, both for June at 2250¢.

In the coarse wool category, two trades were dealt for 28 Micron, both for September at 1100¢.

It does feel that the forwards market has been quiet. The Australian dollar was slightly stronger this week compared to last week and has been trending slightly higher over the last month, which might give us some clues.

The forward curve can indicate future behaviour. Because we’ve seen prices on the auction market falling, the forwards market curve has gone relatively flat, which leads us to believe we might be seeing a base and it indicates that buyers are fairly comfortable at these levels. It’s hard to know for how long, with many factors influencing auction prices, but the wool market has been historically stable and it’s hard to see that it’ll change overnight.

Wool market ticks along OK

The wool market seems to be sitting in a comfortable space right now, and despite the drought influence on quality there are minimal price movements week on week.

There is a negative impact on the market from the continued supply of low yielding wool coming to the market continues, however the current value of the offering is no doubt being well received by wool producers.

Again, AWEX report that the there is insufficient supply of better style high yielding wool to satisfy buyer demand, these types are keenly sought by exporters trying to satisfy demand. They also note that while the market has had a 6-week negative run, it has only retraced 4.5%.

The Eastern Market Indicator (EMI) eased slightly giving up 4 cents for the week to settle at 1,943 cents. The Au$ was slightly stronger at US $0.71, with the EMI in US$ terms gaining 1 cent to end the week at 1,383 US cents (Table 1).

In Fremantle, the Western Market Indicator (WMI) declined by 4 cents to finish at 2,095 cents.

37,454 bales were offered for sale this week, almost identical to last week with the trade clearing 32,669. This is just 310 fewer bales than last week, however the pass-in rate was again significant at 12.8%.

In the auction weeks since the winter recess, 1,124,734 bales have been cleared to the trade, 217,993 fewer than the same period last year. The average shortfall cleared to the trade compared to the same time last year now sits at 6,812 bales per week fewer.

For comparison, in the first selling week of April 2018, 51,066 bales were sold.

The dollar value for the week was $66.18 million for a combined value of $2.621 billion so far this season. A simple calculation of $ value divided by bales sold gives us $2,025 per bale across all types for the week.

Crossbreds continued to defy the easier trend with an increase of 10 to 30 cents across the board. This is the third week in a row of price improvement, however the Cardings sector was mixed declining by 41 cents in Sydney but posting modest gains in Melbourne & Fremantle.

The week ahead

The roster for next week has the offering again at 38,712 bales followed by 42,465 before the Easter recess.

Tightening trend is the producer’s friend

There has been a softer trend present in lamb and sheep yardings in recent weeks. It is not uncommon to see a reduced sale yard offering as we head toward the Easter lull and with recent rainfall to much of the Eastern third of the country it seems to have encouraged firmer prices.

Throughput figures for this week are yet to be released. However, the trend in sheep yarding along the East coast is most definitely softer with the most up to date numbers showing the lowest weekly levels since the start of February – Figure 1.

Despite the softening pattern, sheep throughput remains above average, and this may persist when the figures are released next week as individual reports from many NLRS reported sale yards indicate that numbers were up, possibly encouraged forward on the back of last weeks’ strong prices.

It is likely that rainfall had a bigger influence on prices than sale yard throughput levels this week with decent falls across much of the Eastern states encouraging restocker buyers back into the market, particularly at NSW yards – Figure 2.

Across the East coast NLRS reported categories of lamb and sheep all managed a lift in price. Mutton was the standout performer among the pack with a near 7% gain on the week to close above 500¢. Lamb categories posting a more subdued performance, with gains of 1.5%-2.5% noted. Restocker lambs managed to climb back above 700¢, while the benchmark Eastern States Trade Lamb Indicator settled just below to close the week at 697¢/kg cwt (Figure 3).

Lighter rainfall in the West wasn’t enough to inspire a price gain with the mid-week update from MLA showing a 5¢ slip on the West Australian Trade Lamb Indicator for the week to settle at 654¢.

What does it mean/next week?:

The Bureau of Meteorology rainfall outlook for the coming week shows only light coverage of 1-5mm around nearly all the coastal fringe, with only the far northern tropics getting a heavier dusting.

Virtually no rain is likely for most of the sheep rearing country, so price movements are likely to be influenced more by supply. Heading toward the Easter break there’s a good chance this will continue to tighten so the price bias remains to the topside.

Crop update around the world

The 2nd quarter of the year is the most important part of the year for world grain production. During this period of time, the major growth phase of the northern hemisphere crop will develop. This can lead to volatility in pricing as the Northern Hemisphere will largely determine pricing for the remainder of the year. In this weeks’ comment we will take a look at some of the forecasts for the major production areas.

Australia
The Australian crop is forecast by ABARES at 23.9mmt, however at this point of the year it is a meaningless figure. The variables required to accurately predict the crop with any degree of accuracy are inherently volatile until the post-seeding period.

Russia
In the late 80’s/ early 90’s Russia was an Insignificant participant in the grain export trade. In the early post-Soviet period, Russia would import up to 15mmt. The introduction of foreign investment and techniques has led to Russia becoming the number one exporter at >40mmt (figure 1).

Therefore, the influence of Russia on global supply cannot be underestimated. This seasons’ estimates for the crop are very positive, with the Russian agricultural ministry forecasting 75-78mmt of wheat. This would be the 2nd highest wheat crops the nation has produced. If this is realized, it will likely help maintain a ceiling on global pricing.

Europe
The European trading bloc has produced on average 138mmt of wheat since the start of the century. There have been large tracts of the European growing area which have been unseasonably dry during March. However favorable moisture profiles in the main production areas in France and Germany are likely to lead to production of 149-154mmt.

United States
The United states have experienced their worst flooding in history during March. This has resulted in the loss of a substantial quantities of stored corn and soybeans. The majority of states are showing considerably improved conditions from this time last year.

Although conditions are still close to optimal the excess moisture has the capacity to reduce the potential of the winter crop, conversely it provides great starting moisture for the spring crop.

What does it mean.

We’re heading into the seeding period within Australia and all eyes will remain on weather, and more particularly the timing of the Autumn break. As outlined above, at this time in the season all predictions of crop size must be taken with a grain of salt until the situation post seeding becomes clearer. The best you can do at the moment is keep your eyes on the skies.

Cattle rally slows with nothing on the forecast

The cattle price rally continued this week but slowed. The Eastern Young Cattle Indicator (EYCI) did break through 500¢ for the first time since very early January and it looks likely to break through last year’s levels.

With little rain about this week and none on the forecast, cattle buyers took a breath and held prices relatively steady. Figure 1 shows the EYCI was due to slow a little. The rally hit 105¢ this week and it has done it in a month. The EYCI was at 505¢/kg cwt on Thursday and right on the five year average.

This time last year, young cattle prices were heading in the other direction. This suggests that this year’s values will surpass year-earlier levels for the first time since July 2017.

Young cattle supply has remained relatively low. It’s unusual for EYCI yardings to remain below 15,000 head for more than a week at this time of year. No doubt producers are holding what cattle they have left to take advantage of some autumn grass growth.

Paddock feeder prices have rallied, but only marginally. Lot feeders never really paid much less for export feeders, so the smaller increase was to be expected. Export feeders are still commanding a 30¢ premium over the EYCI, which is within the historical range, but at the stronger end.

In the West, cattle prices are less exciting. The WYCI was steady this week at 533¢/kg cwt, still stronger than its eastern counterpart, but 45¢ below this time last year.

Next week:

Another 8 days of no rain might start to give the market the jitters. We will move into mid-April with no autumn break and if it’s still like this at the end of the month we might see young cattle values start to head lower again.

It’s difficult to see where slaughter cattle are going to come from through late autumn and winter, so those prices will at least hold their strength.

Heavy weaners in demand across the Strait

We are a month into the annual weaner sales in Tasmania and while weaner prices are on par with last season there are some interesting developments when comparing price spreads to the mainland – particularly for the heavier weaners.

Tasmanian weaner prices have eased slightly, down 4% compared to last season, with the average price of 295¢/kg lwt achieved during March for heifers and steers at the Powranna sales. Weaner steers have averaged 330¢, while weaner heifers have earned 260¢.

Figure 1 demonstrates the price trend for Tasmanian weaners, according to weight classifications, with the heavier stock holding their value the best. Prices for weaners weighing above 330kg liveweight are 3.7% below levels achieved in 2018 and weaners in the weight range between 280-330 kg are off 3.6%, not too bad considering the southern restocker Eastern Young Cattle Indicator (EYCI) is 13.4% lower than in 2018.

Analysis of the spread pattern for different weaner weight classification to the southern restocker EYCI highlights that the spread for heavier weaners has been steadily improving since 2015 – Figure 2. This is particularly true for weaner steers weighing above 280 kg liveweight with premium spreads being earned during 2019 that are three to five times greater than the average spread earned over the last ten years.

Indeed, weaners weighing more than 330kg lwt have achieved an average spread premium of 67¢ above the southern restocker EYCI during the March sales, compared to an average of 13¢ premium over the last ten years.

For a full copy of the Tasmanian Weaner Sales Report for March 2019 contact Roberts Livestock

What does it mean?

The surge in the heavy weaner spread premiums can be demonstrated by the percentage spread pattern to the southern restocker EYCI for the last fifteen years – Figure 3. For much of the period the percentage spread premium was confined to a 0-10% range. However, in 2018 the spread lifted to a 17% premium and during March of 2019 has jumped to 30%.

Anecdotal reports from the Powranna sales suggest that the robust demand for heavier weaners was fueled by competition amongst feedlot backgrounder and finisher buyers. Given the expectation of tight supplies of quality finished cattle as we head toward winter the solid demand for heavier weaners now isn’t surprising.

Key points:

  • Tasmanian weaners sales are averaging 295¢ kg lwt during March, down 4% from the 2018 average price
  • Weaner steers have achieved an average price of 330¢, while weaner heifers are earning an average of 260¢
  • Weaners above 280kg liveweight have been achieving premium price spreads to mainland EYCI type cattle that are three to five times higher than the ten-year average spread

Trepidation as we head into seeding.

After such a terrible year there is a sense of trepidation as we move into the Australian seeding period. In this week’s grain comment we take a look into ASX pricing and the ramping up of volatility in pricing.

The Chicago futures market has traded in quite a narrow range over the past fortnight, between a high of A$258 and 251. The floods throughout the USA have seemingly been the worst on record, however, there hasn’t been much of a reaction in the markets. The market could see surprises over the next couple of weeks as damage is assessed.

There was substantial rainfall across much of Queensland, however it wasn’t quite as beneficial for NSW as expected. The local futures market (ASX) fell late last week, and into the start of this week. The lower than expected rainfall has resulted in the market rallying A$8 (figure 1). There has also been some decent volume on 2021. At present producers on the east coast can use ASX futures to lock in prices above $300 for the next two years.


In January I discussed volatility in the wheat market. At that point in time volatility well below the bottom of the expected range for the time of year. This lack of volatility continued through February, however March has seen this spike (figure 2).

As we get close to the northern hemisphere harvest we will likely see volatility increase. Typically, July is the most volatile time for the wheat market.

If you think Australian politics is a mess, look at the UK. Today was expected to be the day that the UK left the European Union. However there has been a kerfuffle over the process. This has caused a huge amount of uncertainty with no-one knowing when or if the UK will leave and how it will be done. The Prime Minister has even announced that she will quit, provided that the parliament votes for her deal with the EU.

What does it mean/next week?:

As we get close to the new marketing season, the market will be examining planting and export figures.

Russia has been the most important global exporter in recent years, and the ag ministry is calling for another large crop. However the IGC see global stocks declining at the end of this season as consumption rises.