On the trail of the US cattle cycle
Key points:
- The US cattle cycle has another 2-3 years to run in the herd rebuild phase with annual growth in the herd anticipated to diminish as we head toward the end of the decade.
- The likelihood of further large US cattle price falls in the coming few years is decreased with flat to mild price declines most likely.
- A recovery in US cattle prices is anticipated from 2020 onwards as the cycle moves into the herd decline phase.
 Frequent readers of Mecardo will not find it surprising that long-term annual average local cattle prices have a strong correlation to annual average US prices. This analysis takes a look at the US cattle cycle patterns since 1920 to get a perspective of what the normal cycle looks like, where we are currently in the cycle and the usual price activity during herd growth and herd decline.
To read more about the US-local cattle price correlations see these previously published articles – “Undervalued to overvalued in two seasons” and “Weak US cattle futures a concern for local heavy steer prices.”
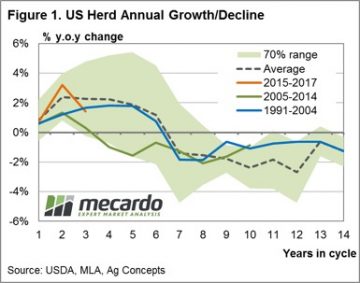
Since 1920 there have been nine cycles in the US consisting of a period of herd rebuild followed by herd decline with the average cycle lasting ten years, the shortest cycle lasting eight years and the longest cycle lasting fourteen years. Figure 1 outlines the annual change to the herd size each year during the cycle showing the current tenth cycle is in its third year (orange line).
Overlaid on figure 1 is the previous two cycles, the average cycle pattern and the normal variation in the cycle pattern that can be expected over the period (as identified by the green 70% band, showing where the cycles have fluctuated for 70% of the time since 1920). Analysis of the cycle patterns shows that the duration of the herd rebuild to herd decline phase is nearly a 50/50 split, with the rebuild phase usually lasting a fraction longer.
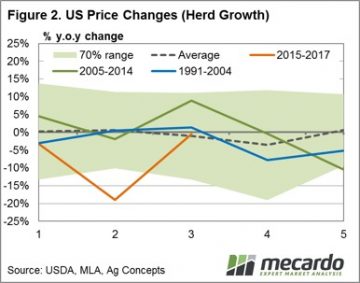
 Given the average cycle lasts ten years and the near 50/50 split between herd rebuild to herd decline during the cycle we took a look at annual price percentage changes during the first five years of each cycle (the herd rebuild) and the final five years of each cycle (the herd decline). Figure 2 shows the annual price change pattern for the first five years of the cycle. Interestingly, the data since 1920 demonstrates that the average price gain pattern for the first five years is reasonably smooth and tends toward 0% price movement, yet can fluctuate plus or minus 15% throughout the period. It suggests that there is a reasonably even chance of price gains or falls of a 15% magnitude during the herd rebuild phase of the US cycle – almost like a toss of a coin.
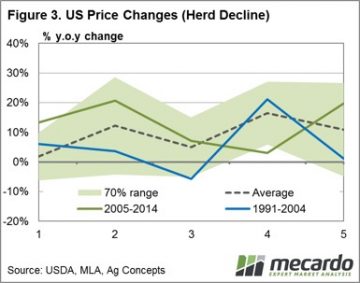
In contrast, the price action for the final five years of the cattle cycle (the herd decline phase) shows a fairly clear average trend for increasing prices as the supply of cattle reduces. Although, the green band (70% range) which highlights the measure of standard deviation in this series shows that the annual price change can be expected to fluctuate between a price fall of 5% to a price gain of 30% for 70% of the time.
What does this mean?
 Given where we sit in the current cycle there is the potential for another 2-3 years of further gains to US herd size, albeit at a diminishing rate. Herd decline is expected to start around the end of decade and is likely to see cattle price supported in the US from 2020 onwards.
The 19% decline in cattle prices witnessed last season in the US suggests further big price declines is likely to be limited as we head to the end of the decade, as previous cattle cycles have shown that it is very uncommon to see successive years of significant price declines (over 15% declines) – particularly if the cycle has already had a year where prices declined in excess of 15%. The implication of relatively stable, to only mildly softer, US prices on local cattle prices over the longer term is for a greater chance of a soft landing when the cattle price correction comes – unless a significant drought event is the catalyst for a harder landing.


