What in the hell is the 90CL?
Key points:
- The term 90CL describes how lean, in chemical percentage terms, a pack of meat is. 90CL refers to meat that is 90% lean red meat and 10% fat.
- Monthly fluctuations in the 90CL closely follow the price pattern set by US Live Cattle futures.
- Movements in the A$ can have an impact on how the 90CL fluctuations flow through to added support or pressure on local cattle prices.
 At Mecardo we regularly refer to the 90CL frozen cow indicator as a key beef export price benchmark when undertaking analysis of the domestic market prices in relation to overseas markets. This is because a strong long-term correlation exists between indices like the Eastern Young Cattle Indicator (EYCI) and the 90CL. We often get asked to explain what the 90CL actually is and what influences its movement – this will be addressed in this piece.
The abbreviation CL refers to the term chemical lean which measures the amount of lean red meat compared to the amount of fat in a sample of meat, using an approved method chemical analysis. The CL of meat being analysed includes a ratio of meat to fat as a minimum percentage, for example 90CL, where 90% of the pack will be lean red meat and 10% of the pack will be fat. Much of the frozen 90CL product imported into the USA from Australia finds its way into the meat grinding process where the lean 90CL is combined with the 50CL US fat trimmings to make the iconic 75CL American burger meat patty.
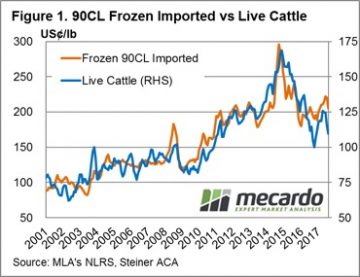
 Therefore, it should come as no surprise that the influence of the broader US cattle market on the price of the 90CL is fairly strong. Indeed, as highlighted in figure 1, the movement of US Live Cattle futures is closely mirrored by the movement in the 90CL. Analysis of the monthly average price of US Live Cattle to the 90CL since 2001 shows a correlation measure of 0.9139 which suggests that nearly all of the movement in the 90CL can be explained by the fluctuations of the US Live Cattle market.
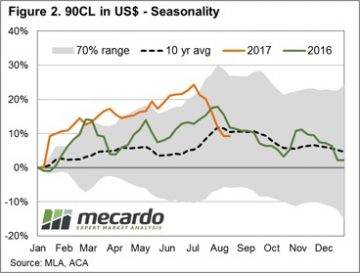
The 25% gain in US Live Cattle futures experienced since October 2016 had been mirrored in the progress of the 90CL in US$ terms this season – figure 2. In recent months drought effected parts of the American mid-west have seen Live Cattle prices ease 13.4% toward 109US¢/lb, subsequently the 90CL in US$ terms has also eased by a similar proportion, dropping 11.9% to 200US¢/lb.
What does this mean?
 Compared to current US Live Cattle levels the 90CL in US terms seems a little overvalued, and the normal annual pattern heading into the remainder of the season shows that the 90CL usually begins to decline beyond the US grilling season peak around July/August.
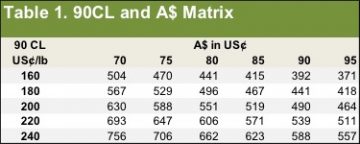
However, the local price impact of any price decline in the 90CL in US terms will depend upon what is in stall for the A$ for the remainder of the year. As outlined in Table 1, which shows the relevant 90CL in A$ terms for a selection of pricing scenarios, any softening of the A$ will act to support local prices while further appreciation will act as a headwind.
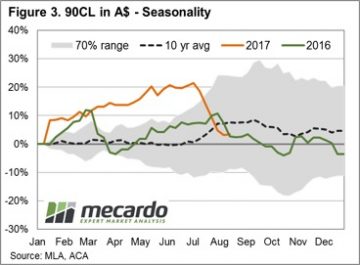
In addition, the relative movement of the A$ can act to offset or exacerbate 90CL fluctuations. For example, the recent decline in the 90CL was exacerbated by an appreciating A$ over the same time frame such that the 90CL in A$ terms declined by a greater magnitude, shedding 14.7% to 559¢/kg – figure 3.