A very flat micron price curve
- The micron price curve from 15 through to 23 micron is extraordinarily flat at present.
- Change in supply has been the key driver of this move to a flat price curve.
- Fibre diameter is constantly changing in response to change in seasonal conditions.
- As fibre diameter changes, so too does the supply of different micron categories and consequently the micron price curve.
Last week the 19 MPG finished 5 cents above the 21 MPG, which is a very small premium. In the bullish fine wool market of 1999-2001 many in the industry were carried away by the fine wool premiums, confusing a mix of cyclical factors as a permanent change in the prices structure of the greasy wool market. Given the poor performance of fine wool premiums since 2012 (with the exception of 2017) the risk is that the reverse of 1999-2001 could happen. This article takes a look at a key driver of micron premiums and discounts.
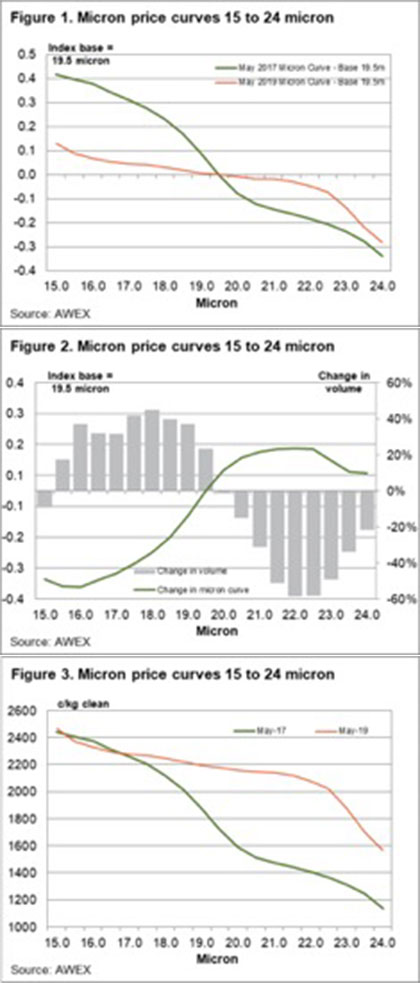
In Figure 1 the micron price curve for May 2017 and May 2019 is shown. The price curve is generated by setting the average 19.5 micron price to zero and comparing the other micron prices levels to it. In May 2017, fine merino premiums were high by historical standards, the opposite position to the current greasy wool market. Compared to 2017, the current market premiums for sub-19.5 micron have shrunk to negligible levels while the discounts for 20 to 22.5 micron have also shrunk to minimal levels. This has flattened the micron price curve.
In 1999-2001 a combination of favourable supply (less fine wool), a depressed apparel fibre market (man-made fibre and cotton prices were low for an extended period which dragged medium and broad merino wool to low price levels), a favourable fashion cycle which allowed fine merino wool to avoid low prices and finally a low exchange rate which helped boost the local price resulted in huge micron premiums for fine merino wool.
In the current market the reason for the flat micron price curve looks to be mainly a supply issue. Figure 2 compares the change in the two micron price curves shown in Figure 1 with the change in supply, by micron category, between May 2017 and May 2019. The graph tells the story. Where supply has risen, the micron curve has fallen and where the supply has fallen, the micron curve has risen. When looking into the future, keep in mind the fibre diameter of the merino clip is always moving in response to changing seasonal conditions so the pattern of volume change shown in Figure 2 will change and reverse at some stage. When the supply does change, expect price to react with the micron price curve changing accordingly.
Finally, in Figure 3 the actual micron price curves in cents per kg terms for May 2017 and May 2019 (from 15 to 24 micron) are shown. The price level for 15 to 17 micron has barely changed. It is the broad merinos (20 to 23 micron) which have changed price levels dramatically, assisted by chronic under-supply since early 2018.
What does this mean?
Merino micron premiums and discounts are probably at their perigee. The fall in the average merino fibre diameter is shrinking, with a reasonable prospect of the fibre diameter starting to increase in the new season which would start to reverse the trends in supply seen during the past 18 months. From this the micron price curve will change once more, with micron premiums and discounts beginning to widen.

