Goldilocks zone for the EYCI

In the Friday cattle market comment from last week we mentioned that the Eastern Young Cattle Indicator (EYCI) was likely to find some support in the coming weeks from a firmer 90CL price. In this analysis we take a deeper look at the historic relationship between the EYCI and the imported 90CL into the USA, and what this may mean for the EYCI in the short term.
A quick recap on exactly what the 90CL is can be found here.
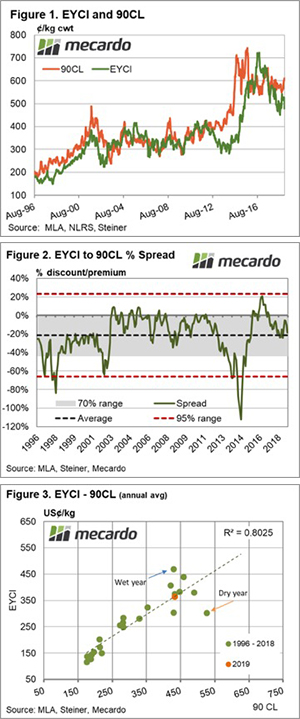
Historic price fluctuations of the EYCI and 90CL are outlined in Figure 1 and demonstrate that, for the most part, both price series follow a similar trend with the EYCI spending much of the time at a slight discount to the 90CL. As of last week, the 90CL imported frozen cow indicator closed at 602.8¢/kg CIF, compared to an EYCI close of 477.8¢/kg – representing nearly a 21% discount of the EYCI to the 90CL.
Analysis of the long-term percentage spread pattern between the EYCI and the 90CL shows that the average spread since 1996 has been a discount of 22% (black dotted line on Figure 2). Furthermore, the spread has spent 70% of the time fluctuating between a 1% premium to a 44% discount as identified by the grey shaded zone. Movement in the spread beyond a discount of 66% or a premium of 22% would be considered extreme, as shown by the 95% range boundaries (red dotted lines).
Comparison of annual average EYCI and 90CL prices (expressed in US$ terms to reflect a global beef price) demonstrates that there is a strong correlation between the price series with an R2 correlation score of 0.8025 – Figure 3. The correlation measure can only range between 0 to 1 and the strong correlation score suggests that over the long term the EYCI value is heavily influenced by offshore beef market movements.
Dry seasons can see the EYCI more discounted to the 90CL than normal, as was the case in 2014/2015. While more favourable years with adequate rainfall can see the EYCI sometimes move to a premium to the 90CL, like in 2016.
What does it mean?
Opening EYCI levels for 2019 compared to the 90CL show that young cattle prices are sitting right on the line of best fit (green dotted line on figure 3) neither too high nor too low, which quite remarkable given how dry the second half of 2018 has been. This suggests offshore markets like the 90CL are unlikely to exert too much pressure on the EYCI to the topside, nor the downside.
The fact that the current EYCI to 90CL spread is quite close to the long-term average level also reinforces this view, so perhaps we were a little hasty on Friday suggesting that the EYCI would find immediate support from the rising 90CL price. Indeed, from a historic perspective the EYCI is just about right (compared to the 90CL), sitting comfortably in the Goldilocks zone – so perhaps consolidation at current levels is more likely for the moment.
Key points:
- The EYCI to 90CL spread is sitting just below a 21% discount, based off last week’s closing prices.
- The long-term average spread from 1996 to 2018 has been a discount of 22%.
- Based off the long-term price relationship between the EYCI and 90CL, the EYCI is sitting right where you would expect compared to the 90CL level.


