Is it the return of the Wagyu or did the EYCI strike back?
 On international Star Wars day last year (May the 4th be with you) the Mecardo team took a look at Wagyu spreads to the Eastern Young Cattle Indicator (EYCI) and a recent subscriber request for a follow up article prompted us to have another look at how the 2017 season played out… and besides we couldn’t resist the chance for another pun in the heading!
Recap on the original “May the force be Wagyu” analysis here.
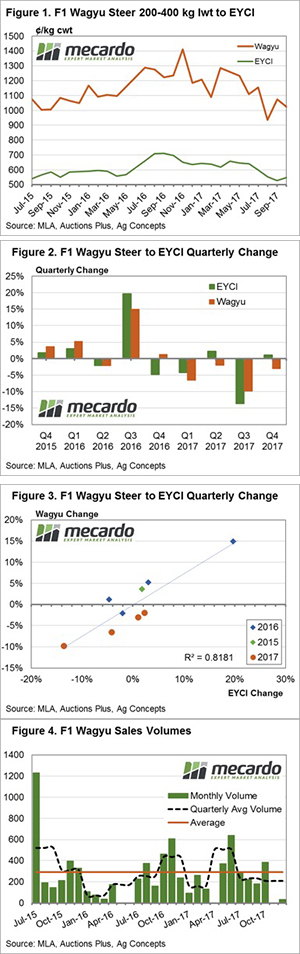
Figure 1 shows the monthly average price series for F1 Wagyu Steers, along with the monthly average EYCI since mid-2015. A cursory glance at the chart demonstrates that Wagyu prices have declined in line with the general correction in young cattle prices over the 2017 season.
However, a breakdown of the quarterly average price changes for the two series highlights that the main price gains occurred during the third quarter of 2016, with the EYCI up 19.7% and the F1 Wagyu Steer up 14.9% – figure 2. Similarly, the majority of the price correction occurred during the third quarter of 2017 with the EYCI down 13.6%, while Wagyu Steers came off 9.8%. Although, measuring from their respective peaks to troughs on a quarterly basis over the 2016/17 season shows that the EYCI has dropped 18.4% compared to the Wagyu Steer’s decline of 19.9%.
Correlation analysis of Wagyu Steer to EYCI quarterly price changes indicates a fairly strong relationship between the two price series with an R2 observed of 0.8181** – figure 3. Interestingly, as identified by the colour coded markers for each season, much of the 2016 Wagyu quarterly returns performed above the line of best fit, suggesting a relatively good season for Wagyu prices compared to the respective EYCI movements.
In contrast, the 2017 season has seen Wagyu quarterly returns gathering below the line of best fit, indicative of a somewhat poorer season compared to the EYCI quarterly returns. Perhaps the anecdotal reports of growing interest in Wagyu has led to an increase in supply, causing a narrowing of the Wagyu premium during the 2017 season.
What does it mean?:
Analysis of monthly sales volumes for Wagyu doesn’t demonstrate any particular pattern of expansion – figure 4. Although, there appears to have been a slight increase in the quarterly average volumes (black dotted line) during the middle of 2017 it isn’t significant enough to have caused a poorer season for Wagyu over the year. Indeed, for all of the second half of 2017 the quarterly average volumes remained below the long-term average (orange line).
A look at the percentage spread premium of Wagyu Steers to the EYCI over the last few years shows that while the 2017 season was characterised by narrower premiums than in 2016, with the annual average premium coming in at 78% for 2017 compared to 85% for 2016, much of the monthly movement in the premium spread for 2017 was spent within the normal historic range between 75-100%. So, the EYCI strikes back – but only marginally.

