Livestock commodity prices on top of the heap
Commodity prices halve and double as the old saying goes, working their way through price cycles usually driven by internal factors and occasionally by an external factor such as the international financial crisis in 2008-2009. This article takes a look at the current price ranks for broad acre commodity prices in Australia.
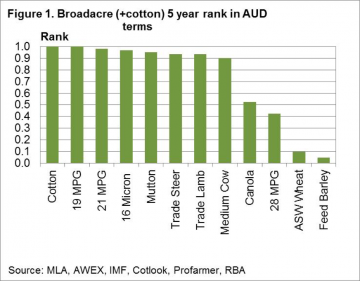 Figure 1 shows the January 2017 five year price rank for a range of broad acre (plus cotton) commodities grown in Australia. The price rank is looked at in Australian dollar terms, as farmers here in Australia see the prices.Basically the news is all good for livestock products (wool and meat) with the exception of crossbred wool (represented here by the 28 MPG). Five year price ranks are all in the top decile, meaning they have traded at lower levels for 90% of more of the past five years. Cotton also is trading in the top decile. At the other end of the scale lie canola, wheat and barley, with canola performing reasonably well by trading at median levels. Wheat and barley are in the bottom decile for the past five years.
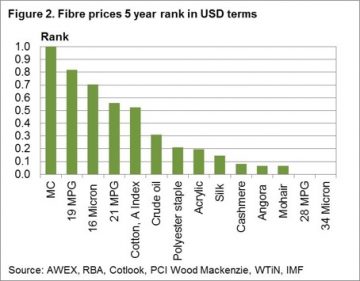 The next step is to look at these commodity prices from outside of Australia. In this case we use US dollar five year percentiles and break the commodities into groups. Figure 2 looks at fibres, including wool from Australia and a range of other apparel fibres. The price ranks range from a high top decile performance by the Merino Cardings indicator through to bottom decile performances by cashmere, angora, mohair and crossbred wool. The merino combing indicators perform well (ranging from the sixth to the ninth decile) well above oil and the synthetic fibres. Cotton comes in close to the 21 MPG in the sixth decile. The longer the disparity continues between the high merino rankings and lower rankings for the major fibres, the more likely some demand will shift out of merino (especially the broader side of 19 micron) to alternative fibres.
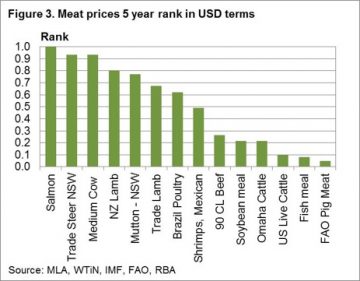 Figure 3 looks at meat and protein prices from around the world. Salmon is the best performer followed by Australian beef and Australasian sheep meat prices. At the other end of the rankings are range of US beef quotes, along with fishmeal and the FAO pig meat index. The big discrepancy between Australian and US beef price ranks indicates some risk to Australian prices if US prices do not lift.
Key points:
- Meat and wool prices in Australian dollar terms are trading in their respective top decile for the past five years, with the exception of crossbred wool.
- Grain prices are at the other end of the spectrum with wheat and barley prices in the bottom decile.
- In US dollar terms merino wool prices are performing the best amongst apparel fibres.
- Australian beef prices are in the upper deciles in US dollar terms while US beef prices in the lowest deciles.
What does this mean?
Commodity prices rise and fall. Currently merino wool prices are outperforming other apparel fibres, but this outperformance will be gradually eroded by the supply chain adjusting it mix of fibres to contain cost blow outs form the recent strength in the wool market. High prices sow the seeds for lower demand later. For beef the risk looks to be the marked difference in US dollar price rankings between Australian and US prices. Australian prices can outperform by so much only for so long.

