The market skew

In this analysis we look at the overall Chicago wheat each year since 1973 to examine the skewness of the market. This provides an indication of how far the market trades from the normal distribution and provide some insight into where prices have historically been.
In this article, we are going to look at the ‘skewness’ of the wheat market over an extended period of time. To start with, it is important to define what we mean by skewness. Many of you will be aware of the normal distribution or bell curve (Figure 1). The bell curve describes a symmetrical data distribution where the results will be 50% below or above the peak, with most (or 68%) being close to the mean.
The skewness of a distribution curve represents the degree of distortion (or lean) from the normal distribution. The bell curve example (Figure 1) represents a dataset with no skew. The lean can be either positive or negative, depending upon whether the tail of the data is to the left or right.
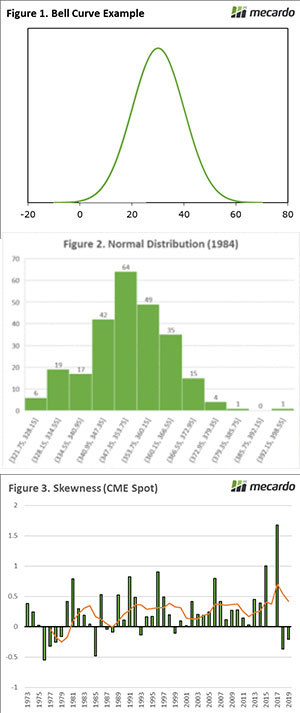
There are some examples of skewness based on individual years in Figure 2 (animated). In 1984, the pricing of wheat followed very closely to a normal distribution, with most daily prices within 1 standard deviation of the mean. In 1976, there was a strong negative distribution with prices heavily skewed above the mean and in 2017 the lean was positive with prices skewed lower.
In Figure 3, I have calculated the annual skewness on the daily spot price for Chicago wheat futures from 1973 to present. Prices have overwhelmingly been skewed towards the positive. There have only been eleven years when the skew has been negative and seven of those years have been prior to 1990. This means that in most years since 1973, the daily price has been skewed lower.
What does it mean/next week?:
On an annual basis, the Chicago wheat contract has spent most years with a positive skew. This means that prices have trended lower than the mean.
This could point towards the importance of growers hedging when prices are strong. As the market tends to trade with positive skewness, we would expect prices to trend lower than the mean.
Key Points
- Skewness represents the ‘lean’ from the normal distribution.
- Positive skewness in wheat pricing shows that the distribution leans to the lower side of the normal distribution, and vice versa for negative skewness.
- There have only been eleven negative price skews since 1973 (including the current year).

