Top twenty Merino price falls since 1947
The August drop in greasy wool prices was substantial, with drought conditions increasing the sensitivity of farmers to lower wool prices at a time of high feed costs and high sheepmeat prices. This article takes a look at the average Merino micron price during the past seven decades and ranks the August price drop.
Greasy wool, like other commodities, is subject to big cyclical upturns in price and big cyclical downturns. The late rising cycle, which peaked in 2018, was boosted by falling supply. That factor remains, and looks likely to intensify, but seems to have been overridden by a combination of weaker retail demand and a supply chain upset by a tariff war between the USA and China.
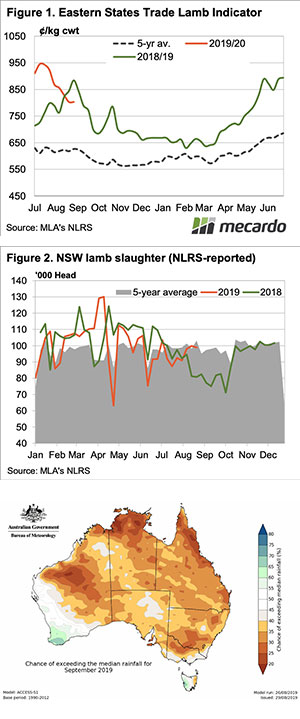
Figure 1 shows a composite indicator which represents the average Merino micron price, from 1947 to last month in Australian cents per clean kg. The average Merino micron (as opposed to the average flock micron which is currently 1.1 microns broader) is also shown in Figure 1. The price is shown in nominal terms but even so the peaks of 1951, 1973 and 1988 stand out along with the 2018 peak.
Using this price series, the top 20 monthly price falls since 1947 have been calculated. These are shown in Table 1. The winner in terms of largest monthly price fall is February 1991 when the auctions recommenced after the failure of the Reserve Price Scheme (a salient reminder to anyone suggesting we should attempt to manipulate supply in order to manipulate price – if it was that easy). The collapse of the RPS and its immediate aftermath, have another three places of the top twenty monthly price falls.
The next major set of price falls come in a year best remembered for its peak – 1951. Five of the top twenty monthly price falls come from 1951 alone, after the market peaked in March 1951. That is a big effort.
The 1973 peak takes out four spots with two in 1973 and two more in 1974.
Following the 2002 price cycle, which was a classic post stockpile liquidation cycle, prices fell by 17% in May 2003. This ranks as tenth on the ladder.
Amongst these price falls August 2019 ranks ninth in proportional terms. In nominal terms, it is the largest fall but for a valid comparison to the earlier periods prices need to be adjusted for inflation.
The history of price falls after major cyclical price peaks suggests we could experience some more months (not necessarily staring away) of significant price falls. It is possible that the low and falling supply will help mitigate further big monthly falls. In 1988, supply was at peak levels while in 1951 supply was rising. In 1973, the greasy wool supply had fallen from recent levels but was still relatively high. The 2002 cycle was different as supply had fallen significantly in the previous decade.
Key points:
- The August fall in Merino price ranks ninth in proportional monthly price falls during the past 70 years.
- Following previous major price peaks, where supply was rising or was already high, there were a number of large month falls in the subsequent 1-2 years.
- Supply is different in this cycle as it is low and falling, which may help reduce the number of big monthly price falls.
What does this mean?
The August price fall in the greasy wool market was not unusual when previous down cycles from major peaks are considered. Low supply remains an issue in the Australian greasy wool market, and it may show up by limiting the number of big monthly drops in price we experience.

