Departure in behaviour for clearance of AWTA volumes

After three months of relatively robust numbers, the latest AWTA volume data reverted to its expected trend, with farm bales tested in February down 11%. This article takes a look at annual AWTA and auction sales data.
While AWTA core test volumes are the best measure of greasy wool production in Australia, they are only part of the supply story as farmers can choose to hold stocks of wool back from sale.

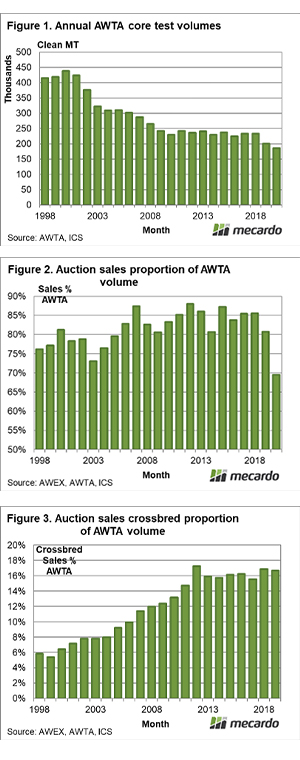
Figure 1 shows the annual volumes of AWTA core test data (in thousands of metric tonnes clean) from the late 1990s to the current season to February, The current season is projected using the current drop in clean volumes of 7.4% which is probably too conservative. There is another 30% of the clip to be tested in the final four months of the season and it is likely these volumes will be lower compared to year-earlier levels, dragging the full season fall in volume below 7.4%.
Note in Figure 1 how the clip volume steadied around 2010 and held through to 2017-18 before drought dragged it lower again. At this stage, an Australian clip stabilising somewhere between this and last seasons volume (186,000 to 200,000 clean metric tonnes – 1.6 to 1.75 million farm bales) would be a good outcome. The supply chain would like an increase in supply but that will take some time with good relative prices and seasonal conditions to achieve.
Figure 2 compares auction sales volumes to AWTA volumes. The two are not strictly directly comparable as there are time lags between wool being tested and sold. Anyone who has spent time trying to finely correlate these two series will have come to realise there are differences between them that cannot be “polished away”. Note in Figure 2 that the proportion of wool sold at auction has ranged between 80% and 88% since 2005. The gap is accounted for by farmer stocks and out of auction sales.
The current season presents a big departure in behaviour, with auction clearances dropping to 70% of AWTA volumes. This implies some 10% of the season to date production is being held as stocks by farmers. Price fell heavily in 2003 and 2011-12 without a big reaction in terms of sale clearances. The concerning thing about this increase in stocks is that farmers have a record of holding the stock as prices fall but later offloading when prices are low. Holding stocks when prices thump down as they did early in the season is reasonable but an exit plan is needed for these stocks.
What about the switch to lamb production? Figure 3 shows the proportion of crossbred sales (a sub-set of the data used in Figure 2) to total AWTA volume, in clean terms from the late 1990s to the current season. Crossbred wool stabilised around 16% of AWTA volumes from 2012 onwards, after climbing steadily from the late 1990s.
What does this mean?
AWTA volumes look set to finish the season between 7% and 10% lower in clean terms, which will mean a total drop of 20% for 2018-19 and 2019-20 combined. Grower stocks have increased this season, with sales clearance down by 10-15% on annual numbers from the past decade. So far COVID-19 has only interfered with supply chains, but it will be having some effect of retails sales starting in China, the consequences of which are yet to be felt in the greasy wool market. This factor suggests an exit plan is needed for the new farmer wool stocks.


