Red Alert for the season?
The Bureau of Meteorology (BOM) has put the country on alert. Last week they updated the El Niño tracker to ‘alert’ status. Their view is that there is a 70% chance of an El Niño forming in Autumn. We thought this was an opportune time to look at both El Niño & La Niña, and what it means for the nation’s wheat production.
According to the BOM, ‘El Niño’s often lead to drier conditions over large parts of Australia, while La Niña’s tend to enhance rainfall over much of the continent’. However, it must be noted that not every drought is associated with El Niño nor every wet year with La Niña.
In this analysis we examine the El Niño and La Niña events which have been considered moderate to strong from 1960 to determine what impact these events have on grain production. The analysis will examine the year on year change in wheat production.
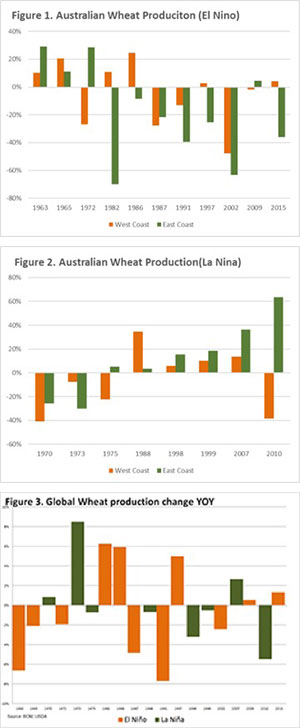
In figure 1, we see the year-on-year impact of El Niño split into east coast and west coast. In the period 1960-2015, 7 of 11 El Niño years have recorded a reduction in wheat production, with 6 of these years recording a > 20% reduction. In Western Australia the impact of El Niño has been less negative, with 6 out 11 event years recording an increase. However, only two of these years record > 20% increase. In addition, during the years of production decline, 3 of these years recorded large production falls of > 20%.
The year-on-year impact of La Niña is displayed on both the east and west coasts as highlighted in figure 2. In the period 1960-2015, there have been 8 La Niña events. The east coast during these La Niña events experienced 6 years where production has been higher, with 4 being >15% and 2 events where production reduced by >20%. The impact of La Niña in WA has caused 4 out of 8 years to have a production contraction, with 3 of those years having a >20% decline. The La Niña years with an increase in production in WA have resulted in smaller increases than the east coast with the exception of 1988.
In both figure 1 & 2, it is evident that since the mid 1980’s in Australia El Niño events have overall been negative for crop production and La Niña events have been positive, with the exception of 2010 in WA.
In figure 3, the year-on-year impact of La Niña & El Niño is detailed at a global level. During an El Niño year we can determine that production was reduced in 6 years out of 11, and increased in 5 years with no changes of more than 10% on a global level. During La Niña years, global production has increased in 3 out of 8 years, whilst production has decreased in 5 years.
Key points:
- El Niño events tend to have a larger negative impact on east coast Australian production, with 6 out of 11 moderate to strong El Niño years recording >20% decrease.
- La Niña events tend to result in increased production on the east coast, especially in events since the mid 1970’s which may be due to more efficient water use.
- La Niña years in Western Australia tend to be more subdued with lower production gains, and a higher chance of reduced production.
What does this mean?
The reality is that El Niño is a factor which can influence Australian weather patterns, however it’s not necessarily an indicator of whether a drought will form.
A good example is the past season which has neither El Niño or La Niña and the country has experienced a horrific drought.
The BOM haven’t yet announced El Niño as being in effect, so it’s all speculation at the moment. There is still a long way to go between now and harvest, and with such a volatile climate anything can and will happen.

