Some futures cheer for our Heavy Steer
Key points:
- Annual average price correlations between US Live Cattle and National Heavy Steers is showing that local prices are less overvalued than during 2016
- The continued rebound in US Live Cattle futures through March/April 2017 has meant that, on a monthly basis, average local Heavy Steer prices are nearing the upper end of the normal range.
- The Heavy Steer spread to US Live Cattle Futures is currently at a 21% discount, the longer-term average discount is nearer to 35%.
As a follow up to the recent analysis released on the rise in beef export prices providing support for the Eastern States Cattle Indicator (EYCI) we have taken a look at how the recovery in the US Live Cattle futures price has taken some of the pressure off domestic heavy steer prices.
Click here to recap on the beef export price/EYCI article.
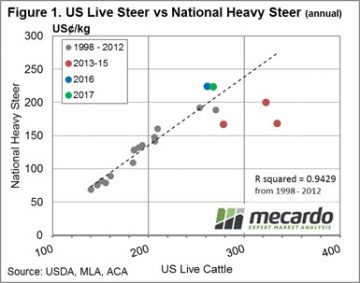 Just as there is a reasonably strong correlation between the annual average EYCI price and the annual average 90CL beef export price, the same holds for annual average prices for US Live Cattle and National Heavy Steer prices. Indeed, as highlighted in figure 1, annual price data for both series converted into US¢/kg from 1998 to 2012 demonstrates a very close relationship. Clearly, the poor seasonal conditions and high turnoff locally for cattle during 2013-15 had an impact on local Heavy Steers prices, remaining in undervalued territory for much of the period (red dots below the line of best fit).
In contrast, the improved season since midway through 2015 saw local prices return to more normal levels and then drift towards overvalued territory as rainfall improved and the focus turned to the herd rebuild. 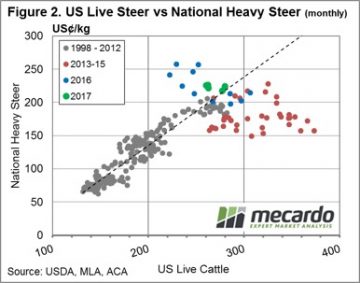 This situation can be seen more clearly by taking a look at the monthly average price comparisons between US Live Cattle and Heavy Steers – figure 2. Interestingly, recent improvements in US Live Cattle prices during March/April 2017 have meant that local Heavy Steer prices are much more in line with what could be considered normal long term levels, as identified by the green dots for the 2017 season moving closer toward the line of best fit.
Looking at it another way, we can track the historic movement of the spread, in percentage terms, between National Heavy Steers to US Live Cattle futures – figure 3. As shown on the chart, the longer-term average spread since 1998 for this series has been around the 35% discount level, spending 70% of the time ranging between a 23-47% discount (green band). Clearly the 2013-15 turnoff saw the spread widen towards the lower end of the 95% range nearer to a 60% discount (red dotted lines) and the improved conditions/tight local supply scenario experienced through 2016 saw the spread spike briefly into premium territory, when US Live Cattle tested under 95US¢/lb during October 2016.
What does this mean?
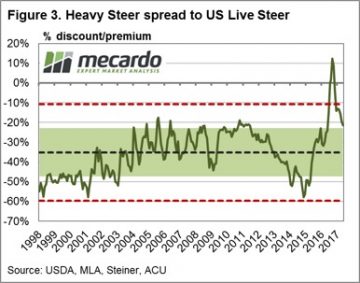 Currently the rebound in US Live Cattle Futures has seen the discount spread return to just above the top of the “normal” range at around 21% discount. While still some way off from the longer-term average spread discount of 35%, it has taken some of the topside pressure off local Heavy Steer prices that would have been evident when the spread was sitting at a premium during late 2016.

