US cattle cycle outlook – revised
 The United States Department of Agriculture (USDA) have released their updated long-term projections for key agricultural markets and they contained some adjustment to forecast herd growth, production and cattle price forecasts. This article takes a look at what these revisions mean for cattle prices and spread relationships between the US and Australia in the coming years.
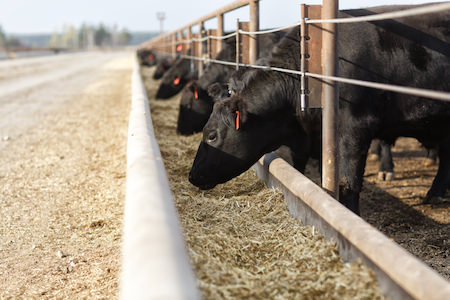
The US are a few years ahead of Australia in their herd rebuild phase and the updated USDA forecasts show that the US herd is anticipated to peak during the 2018/19 season at 94.5 million head. Revisions to the herd size beyond 2020 now show the USDA expecting a gradual liquidation as we head toward the 2025/26 season.
Figure 1 outlines the US cattle cycles back to the 1970s along with the impact changes to the herd size has had on US cattle prices. Often the peak in the herd size during the cycle corresponds with a trough in the price cycle. The chart also highlights the broad similarity in price behaviour over the longer term between the US Live Cattle price and the Queensland Heavy Steer price. Notably in the recent USDA release cattle price forecasts have been revised down by 7.5% over the 2020 to 2026 period.
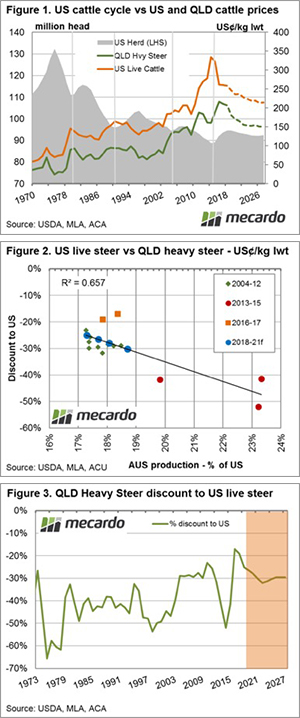
Analysis of the relationship between the Australian to US production ratio and the annual average price spread between US live cattle prices and the Queensland Heavy Steer shows a moderately strong interdependence – figure 2.
During times of drought in Australia, like in the 2013-2015 period, the production ratio increased as our turnoff levels increased and placed pressure on the spread discount between US and local cattle prices to see it widen beyond 50%. Conversely, as our climate turned more favourable into 2016-17, and the herd rebuild began, the production ratio contracted and the discount narrowed to just under 20%.
Figure 3 highlights the historic pattern for the spread discount between US live cattle and the Queensland Heavy Steer. Using the production ratio estimates based off the USDA and MLA production forecasts we can see that the spread is anticipated to widen as the production ratio increases as we head toward the end of the decade.
What does it mean?
The discount annual average spread between US live cattle and the Queensland Heavy Steer is set to move toward 30% by 2020. However, the production ratio estimates assume average seasonal conditions. As highlighted by the dip in the spread during the 2013-15 drought inspired turnoff a return to harsh seasonal conditions will see the spread come under further pressure.
After the Easter break we will run the adjusted USDA numbers through the Mecardo EYCI forecast model to see what the changes to long term forecasts for price and supply mean for local young cattle prices out to 2020 – stay tuned.
Key points:
- The USDA have revised their projections for the US herd size, pointing to a peak in the heard of 94.5 million head during the 2018/19 season.
- US Live cattle price forecasts beyond 2020 have been revised down by 7.5%
- Production ratios between the US and Australia signal a widening of the discount spread between US and local prices toward 30% as we head to the end of the decade.

