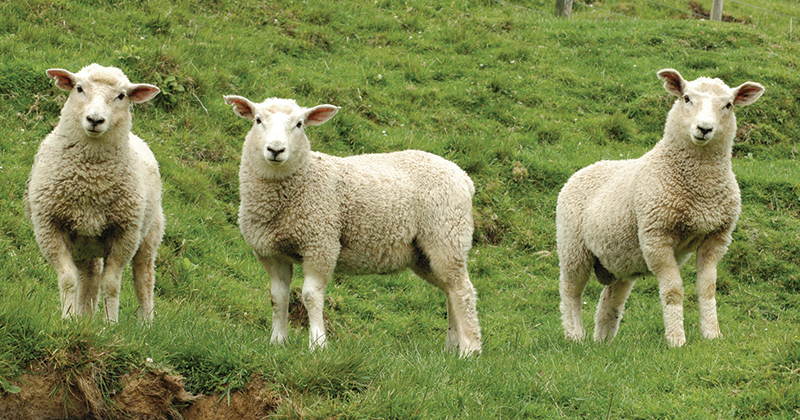
The talk of the town at the Wycheproof store sheep sale last week centred on the line of first cross ewes making $322/head, and merino ewes reaching $260/head. While many sheep producers are enjoying a good season, some might be thinking it’s a good time to cash in a portion of the flock, go on holidays and buy back in the spring. Today we look at how this might play out.
 There is plenty of talk about store sheep being expensive, but are they overpriced? It depends on your definition, but one way to look at it is to look at whether ewes bought now are going to be worth more in six months’ time, or worth less.
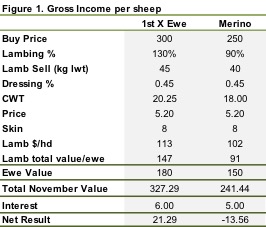
We have to put a few assumptions in place to come up with an answer. We’re assuming ewes will not be shorn between now and November, and the first cross ewes will produce 130% lambs, and Merinos 90%. All lambs will be terminals. Lambs will be sold as trade suckers in November, and ewes will be valued as stores. We use an interest rate of 4%.
Table 1 shows the result of the trade, if lambs and ewes are priced at similar levels to November last year. If buying first cross ewes now for $300/head the grower receive $147 in lamb value, and have a ewe worth $180 in November. This gives a net gain of $21.29/head after interest is taken into account.
For Merinos the net result has the buyer of Merino ewes at $250/head running at a loss, with the net result being negative $13.56. Wool growth is hard to account for, but we have tried to build this into price of the ewe in November. Those buying Merino scanned in lamb ewes are banking on a good wool cheque to bolster profits on the trade.
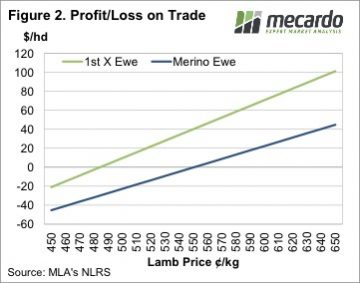
Obviously higher lamb prices will make the result look better for the buyer of ewes, while lower prices will make it look worse. Figure 2 shows a rough estimate of the profit on the trade at different lamb price levels.
Key points:
- Scanned in lamb ewes are making very good money at store sales.
- There appears to be some money in buying first cross ewes, while merinos are marginal.
- It’s hard to see sellers of SIL ewes losing out at current prices, unless the sheep and lamb market maintains very strong values into the spring.
What does this mean?
 For those looking to buy or sell scanned in lamb sheep the question is whether the cost of running the sheep through to November is higher than the net result. For merinos all businesses would incur more than in costs in lambing down and marking lambs. For the first cross ewes cost or running may not outweigh the profit on the trade so they might be a better purchase.
We haven’t accounted for the possible alternative uses of grass in this analysis, with agistment an option, which could pay a similar return to the first cross ewe. However, without owning stock, growers have no access to price upside. Given the current state of the sheep market, we suspect there is more downside than upside, so this might not be a problem. As such those looking for less work this winter can sell some sheep without too much fear of losing out.
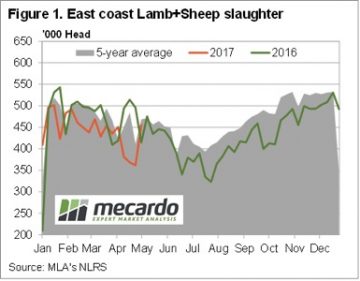
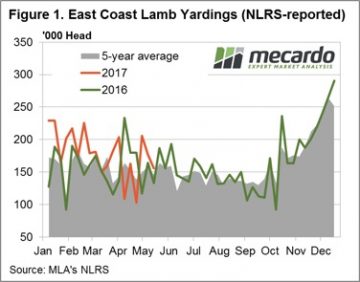 All states, except Tasmania, saw a decline in lamb throughput this week evident in the yarding figures for the East coast (Figure 1) and in Western Australia (Figure 2). East coast lamb yarding down 12% to just under 156,000 head reported through the saleyards, while WA lamb throughput saw a decline of 13.8%.
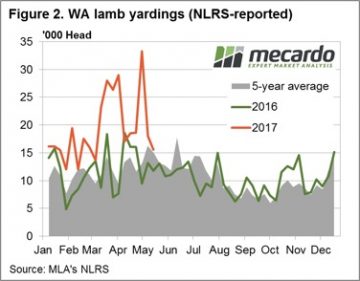 East coast Mutton throughput impacted by soft NSW figures where an 11% fall in NSW flowed through to a price gain of 1.6% for sheep in that state and a broader drop in the East coast throughput for the week – figure 3. Not the case in WA and SA, where increased mutton yardings translated into double digit percentage price falls to see both state mutton prices back below 500¢.
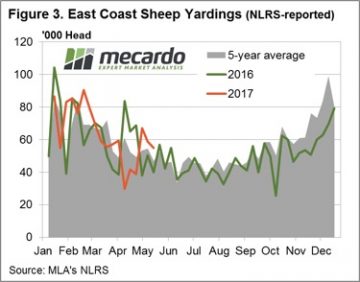 A forecast of steady rain for the weekend and early part of next week to much of the sheep producing regions of the country and the prospect of tightening of supply, as the weather cools further, should continue to provide support to lamb and sheep prices.
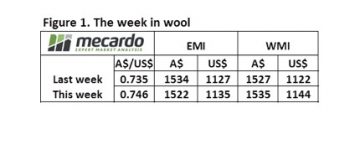 We saw the effect of the Washington/Trump shenanigans which took the confidence out of US markets and resulted in a weaker US$, and by default a stronger A$. The effect on the market was for the EMI to rise in US$ terms (plus 8 cents), but fall in A$ terms (minus 12 cents). The Trump factor causing a 1.5% gain in the A$ over the week to see it finish yesterday at 74.6US¢.
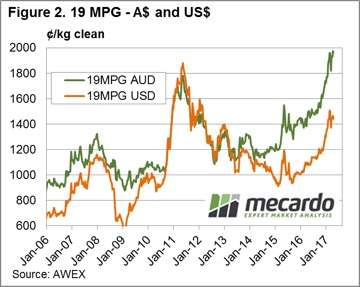 At this time of the year we see increased levels of Vegetable Matter; it impacted most on the skirtings market this week with low V.M. wool tending dearer however high V.M. types were irregular and tending cheaper.
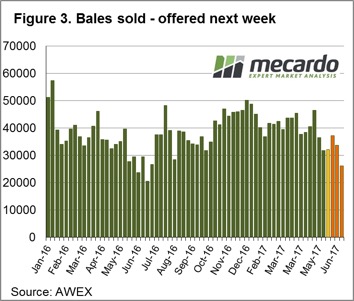 This tight supply should maintain the market levels, although as we have seen this week currency moves can impact.
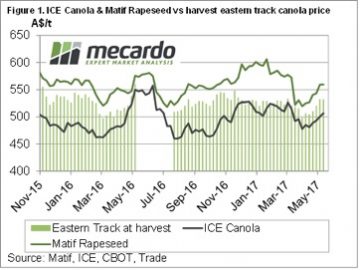 Old crop canola prices have been frustratingly sticky, for those who are still holding onto inventory. The market is stuck around the $520-525 port level, or $540 delivered Melbourne. This is a slight discount on harvest, so not much has been gained or lost through holding Canola.
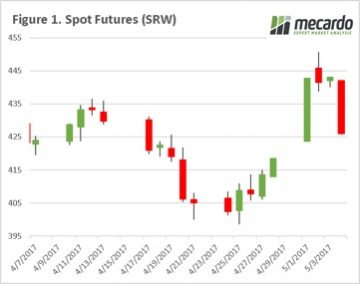
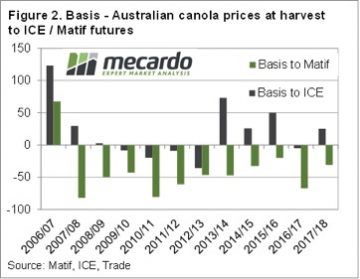 Since Anzac Day delivered wheat and barley prices have gained some ground. With growers busy on seeders, no one is driving the trucks so this market has tightened somewhat. SFW wheat has hit $218/t delivered Melbourne, while F1 Barley is up to $200. These prices are 10-20% better than harvest, and are worth considering.
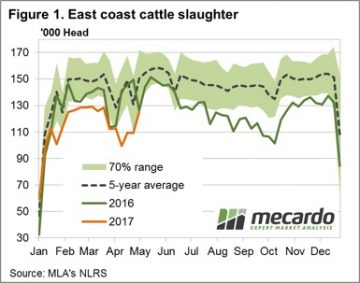 In contrast to the declining throughput and price movements, weekly East coast slaughter for the period ending 5th May still managing an increase from the previous week’s numbers as processors increase activity post the shortened Easter and ANZAC holiday periods – Figure 1. Weekly cattle slaughter rising 14.5% to just over 125,000 head, not far off the peak slaughter levels experienced during March.
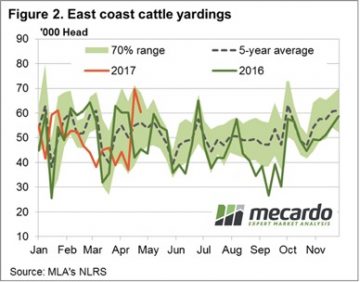 Indeed, the Western cattle markets were broadly stable, while only marginal declines cited in the East for young/store cattle. The EYCI down a mere 1.5% on the week to 634¢/kg cwt – figure 3. In national markets, trade steers less than 1% softer (345¢/kg lwt), feeder steers declined 1.8% (342¢/kg lwt), while medium cow shed a mere 2.1% (216¢/kg lwt). The more moderate falls reserved for the heavier end with medium steers leading the charge recording a 5% fall at 292¢/kg lwt, while heavy steers (not so heavy it seems) posting a 2.6% drop to 293¢/kg lwt.
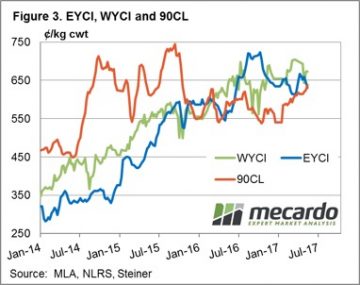

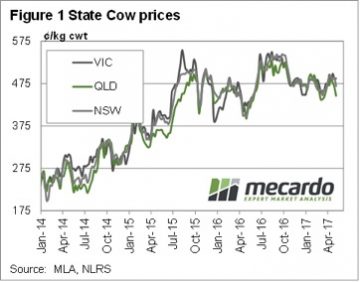 The current margin on cows for processors comes in at negative $34 per head. The margin model is based on a cow weighing 500kgs liveweight, or 260kgs carcase weight. Basically the loss being worn by processors at the moment equates to 13¢/kg cwt.
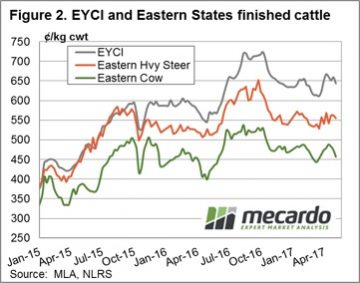 In fact, prices in Queensland are nearly there, sitting at 446¢/kg cwt last week (figure 1). There is still upside potential for cow prices over the coming months, with the prospect of tight supply sending processor margins toward the $150 losses seen last year. To reach these deeply negative margins under current beef prices, cows would have to make 520¢/kg cwt. Last winter and spring cows were making 540¢, so this is not out of the question.
 If you told a sheep grower back in November you’d give them 530¢ for lambs in May, they would have considered it. If you told them you’d give them that for mutton, they’d have laughed at you. But here we are, with the Victorian Mutton Indicator at 530¢/kg cwt.
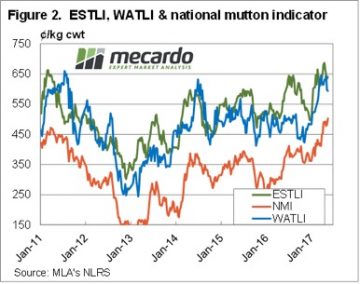 Mutton yardings were also strong relative to last year, but down on last week. The National Mutton Indicator (NMI) reacted by gaining 22¢ to hit a new record of 503¢/kg cwt. This is the first time the NMI has broken 500¢ (figure 2).
 It seems unlikely lamb or sheep supply is going to improve in the short term, with the tap to turn on sometime in August. What happens from there depends on the season, but we can expect to see price decline fairly rapidly once lambs start to hit the market.
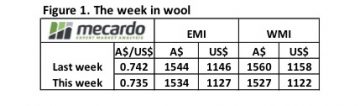 The market opened to solid demand on Wednesday but nervousness crept in on Thursday to see the market in general close below last week’s levels. Eastern prices 5-35¢ softer while the West saw a bit more of a slide, with 15-70¢ falls registered. A reduced offering of bales for sale, just over 38,000 bales came forward this week, however weaker demand saw the pass in rate jump this week to 16.1% with 31,915 bales sold.
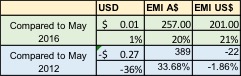 Firstly currency; while it has hardly moved over the past 12 months, it is 27 cents or 36% lower than five years ago. This is reflected in the EMI levels; in A$ terms the market is higher compared to both periods, while in US$ terms it is still yet to reach the 2012 level while sitting 21% above last years US$EMI.
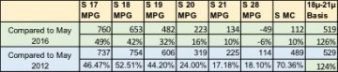 Compared to last year, in US$ terms (Fig 4) all bar crossbred types are stronger, particularly the finer types with 17 MPG up 50% year on year. The story is a little more mixed when we compare against 2012 prices in US$’s, and while 19 MPG & finer as well as Cardings are now above 2012 levels, 20 & 21 MPG were higher back then. The A$ in 2012 was trading US$1.01 cents and clearly impacting on the buyers.
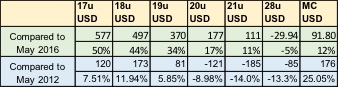 The good news from this is that while wool grower returns are very good, wool to our customers is not expensive compared to recent history; this is a good thing. In fact, the recent high for 19 MPG in US$ terms was June 2011; the Southern 19 MPG was quoted around 1750, but at that time the A$ was strong at US$1.05 resulting in a US$ 19 MPG price of 1820 – compared to the current US$ price of 1460 which converts to A$19.77 in the market when the current A$ level is applied.
 The background to the issues at the early part of this week are explained in Tuesdays analysis piece “
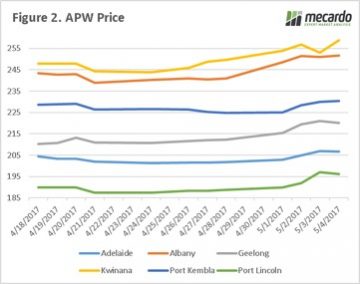 This yield estimate is therefore based on the fields with the smallest impact by recent weather, and yield/hectare losses will most likely be revised in the coming ten days. This may cause another short rally when the snow-covered fields are estimated, but likely the damage will not be as bad as previously expected.
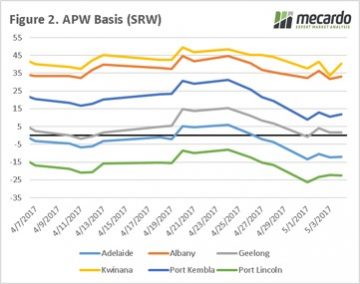 We need to keep a very close eye on the market as it may present selling opportunities over the 1-2 weeks, if (as I expect) the Kansas crop is re-estimated to take into account the snow-covered fields. This may potentially result in speculators with short positions being spooked again. The commitment of trader’s report for this week will be of interest as it will give an indication of whether the funds are still bearish on agricultural commodities or has this week made them reassess.
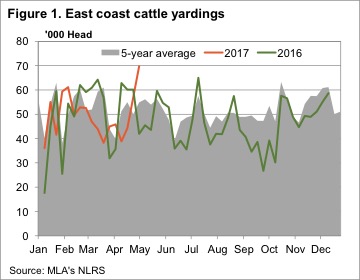 Figure 1 shows east coast cattle yardings rallied an enormous 87% on last week, and 52% on the last full week of sales. With yardings this week hitting 69,737 head, we had to go back to the second week in December 2015 to find larger supply.
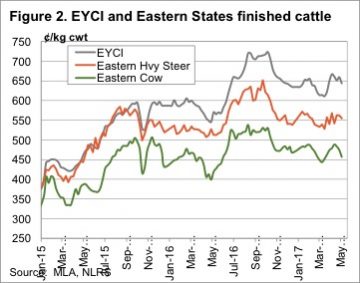 There were no issues with supply hitting prices in WA, where the Western Young Cattle Indicator rallied 30¢ to 673¢/kg cwt. Supply tends to only get tighter in WA at this time of year, which should keep prices at the upper end of the range.