Tag: Cattle

Higher yardings see a slip from record values

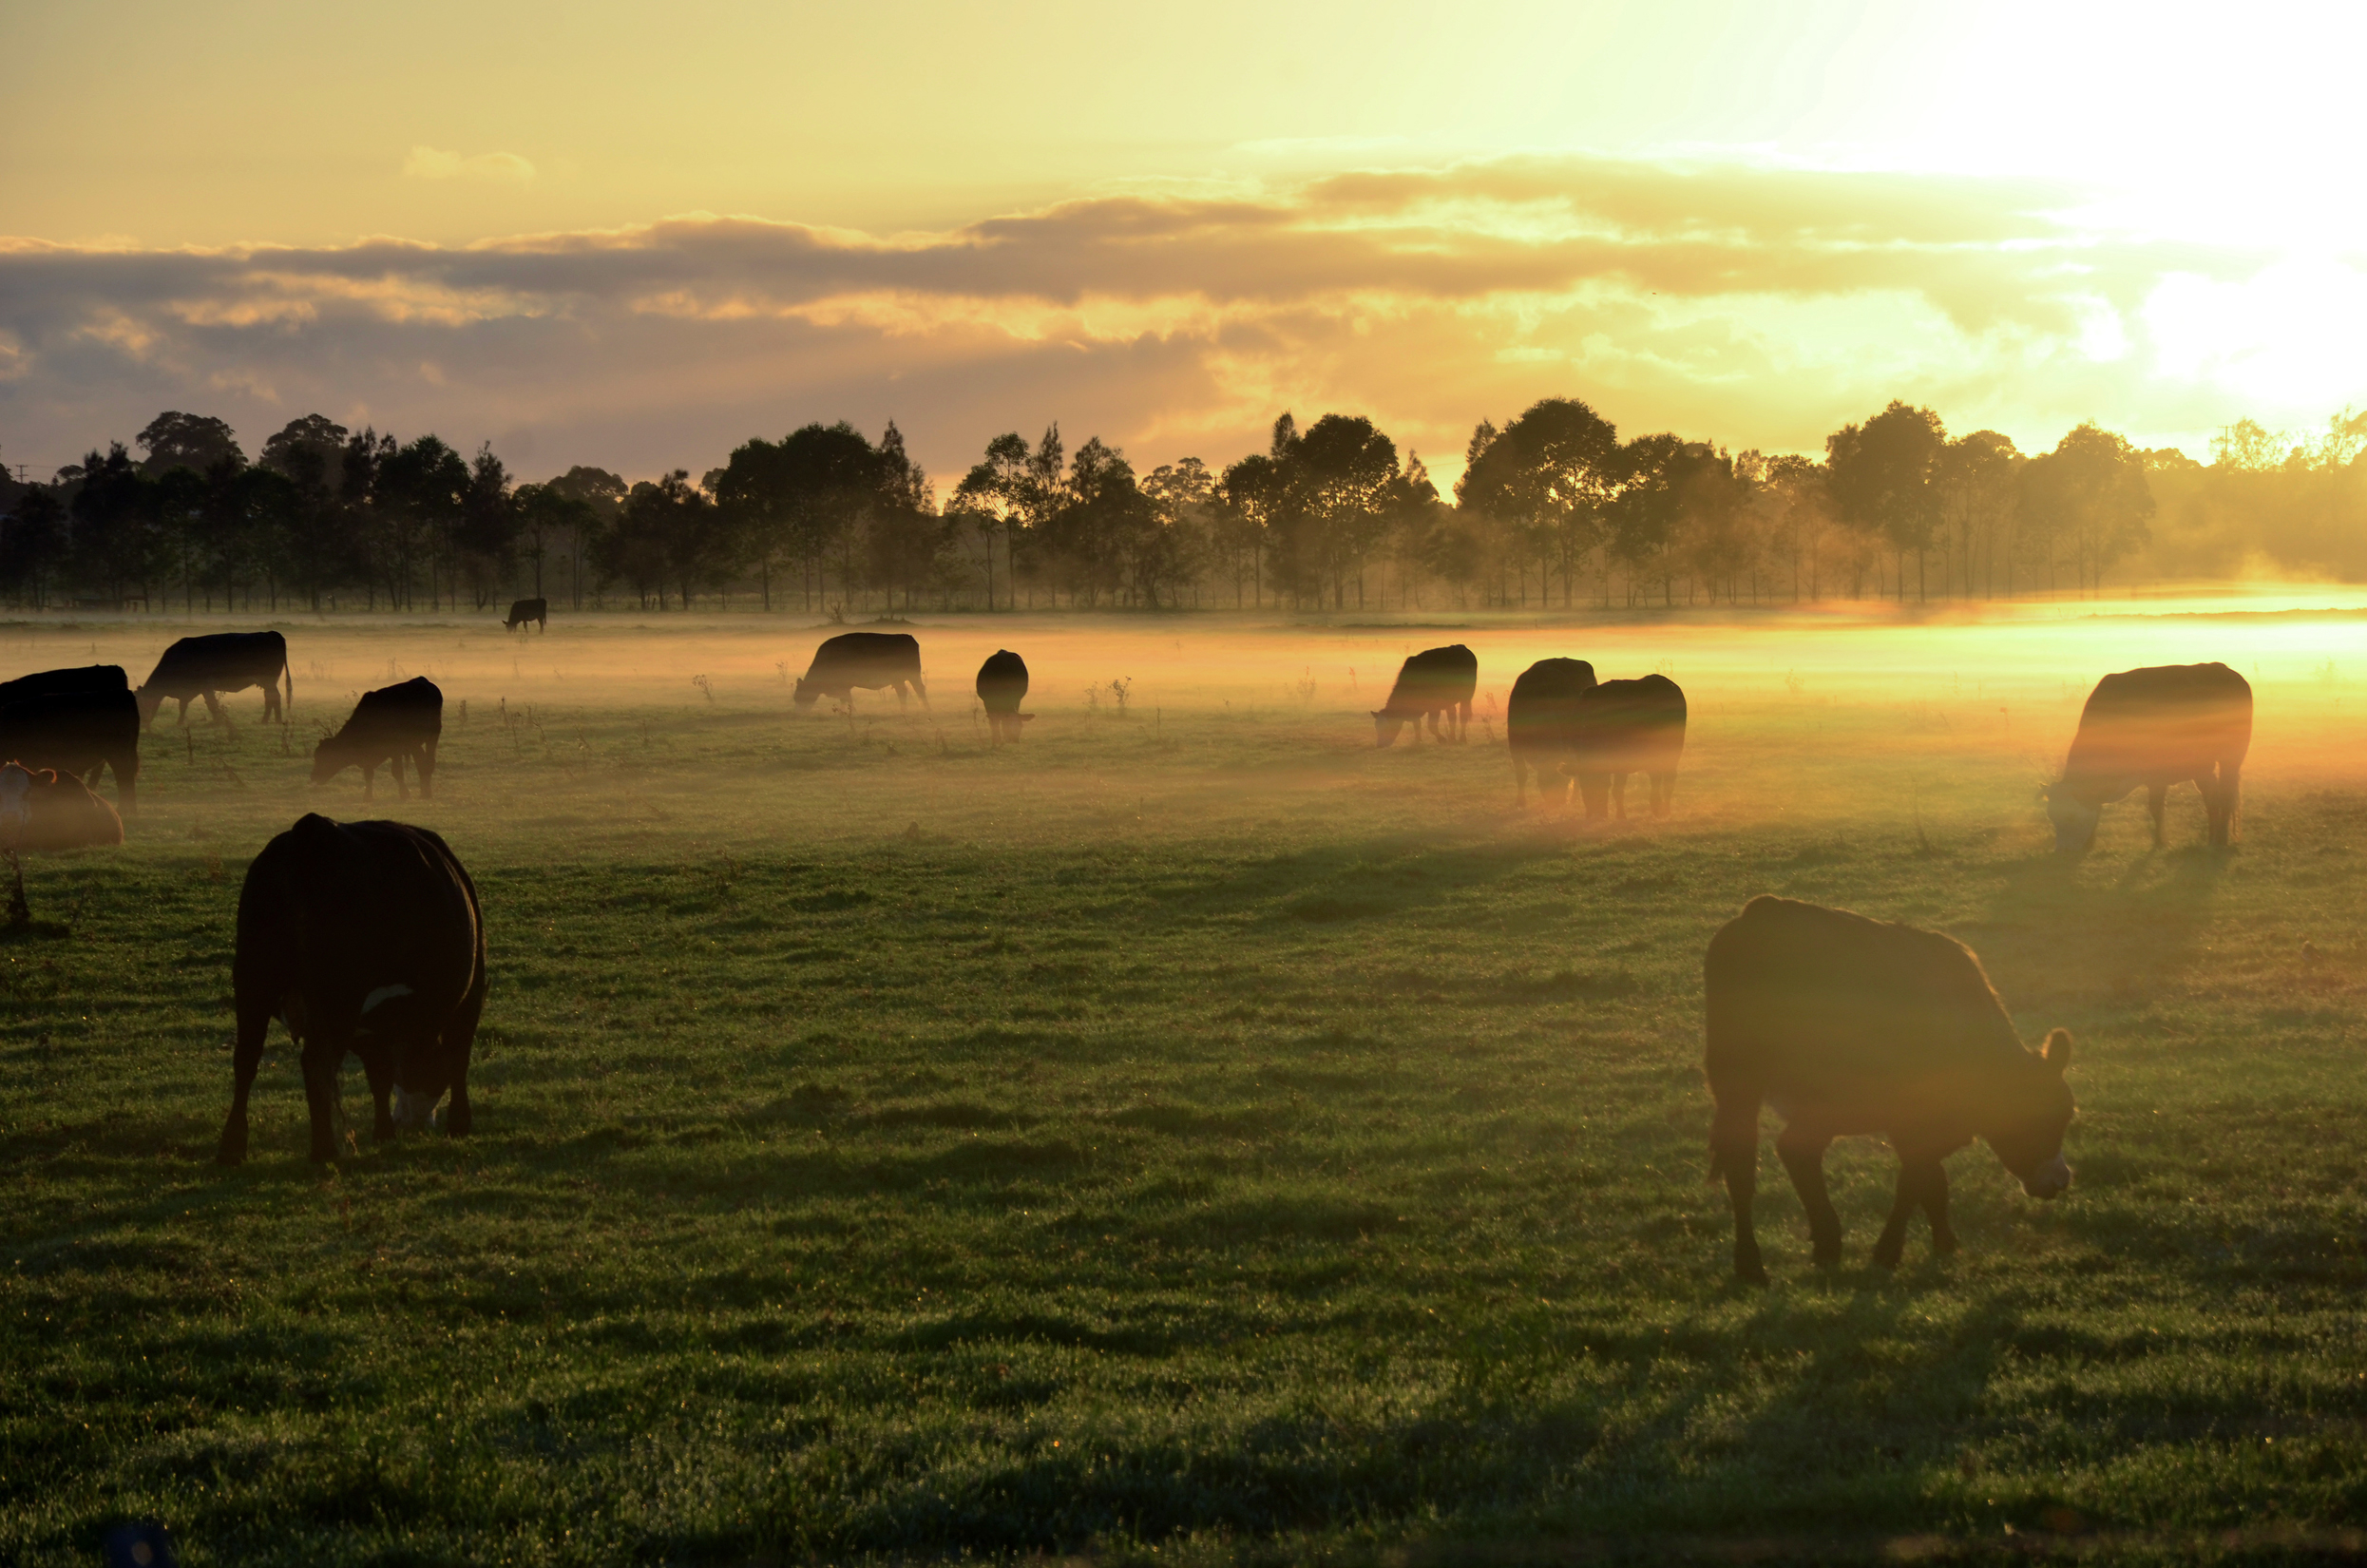
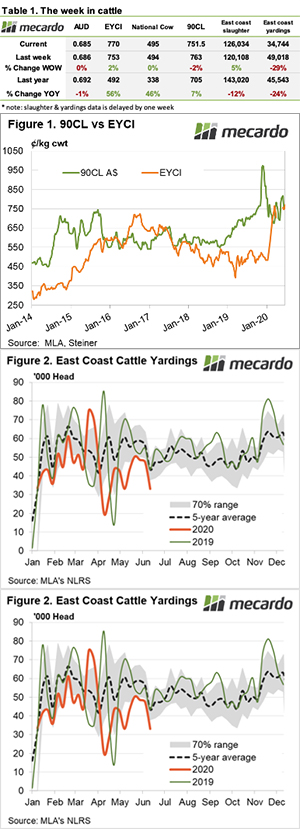
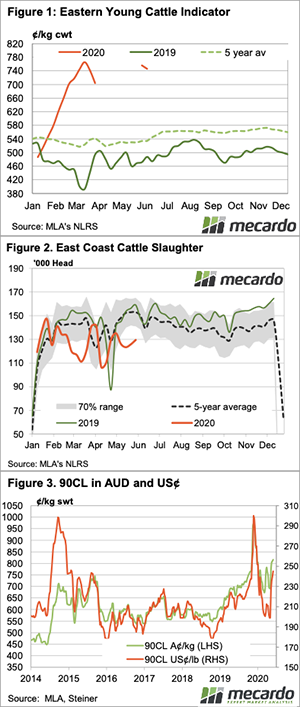
A return to more normal yardings last week had the typical effect on prices. The record young cattle prices from last week didn’t hold, with the correction pulling the Eastern Young Cattle Indicator back to levels of the week earlier.

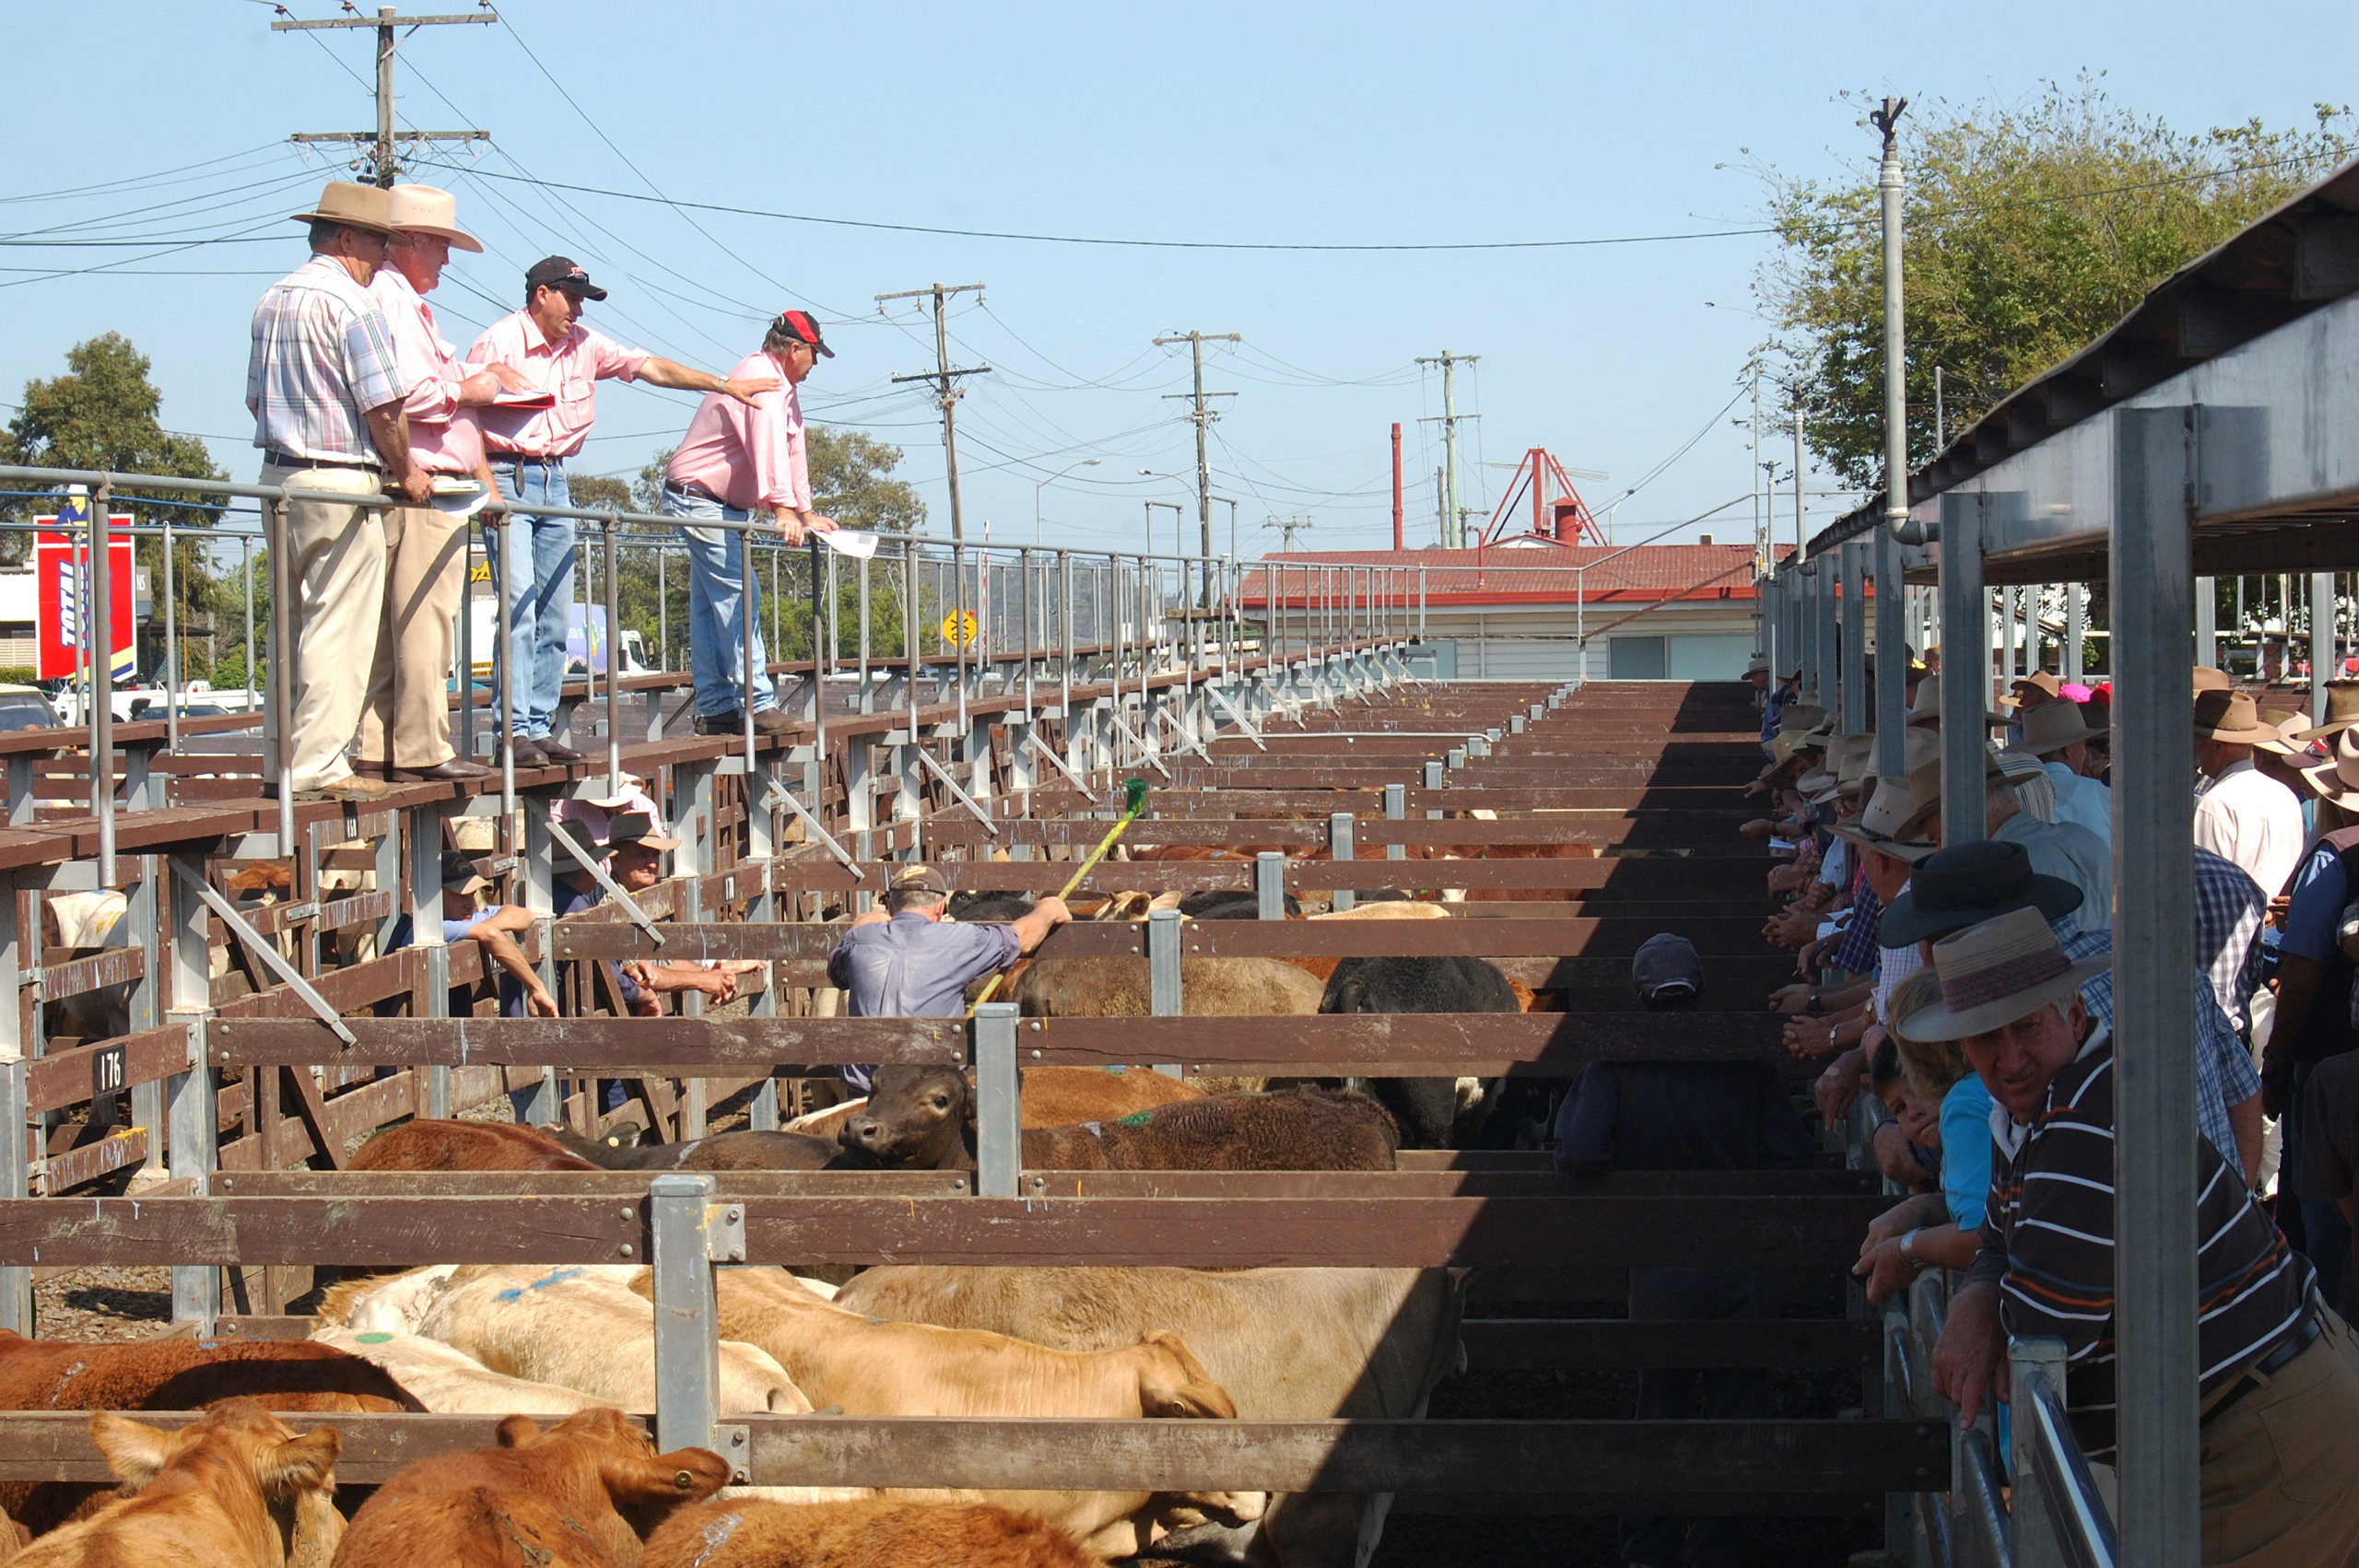
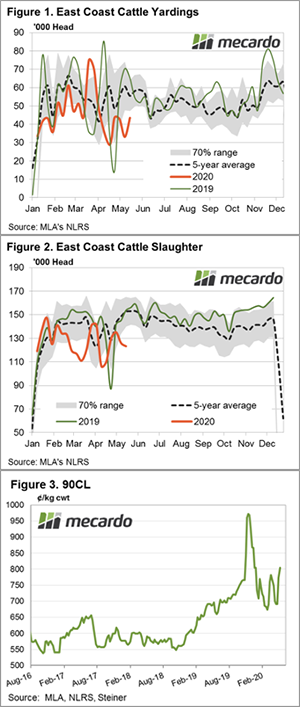
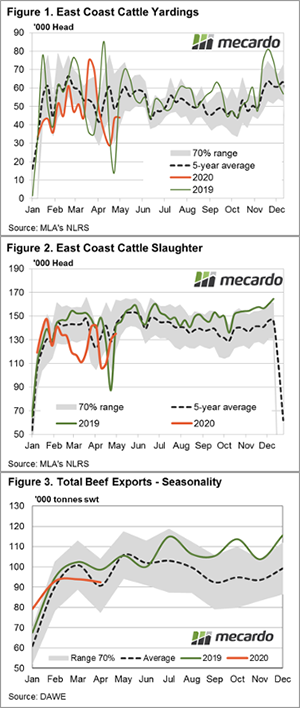
East coast saleyard throughput levels rebounded from the previous weeks low with all states contributing to the lift. A 34% rise saw 46,548 cattle yarded for the week ending the 19th of June.

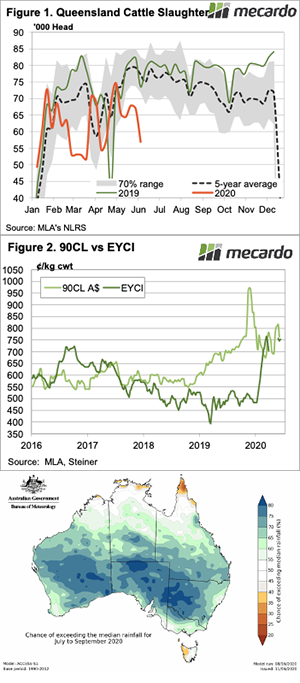
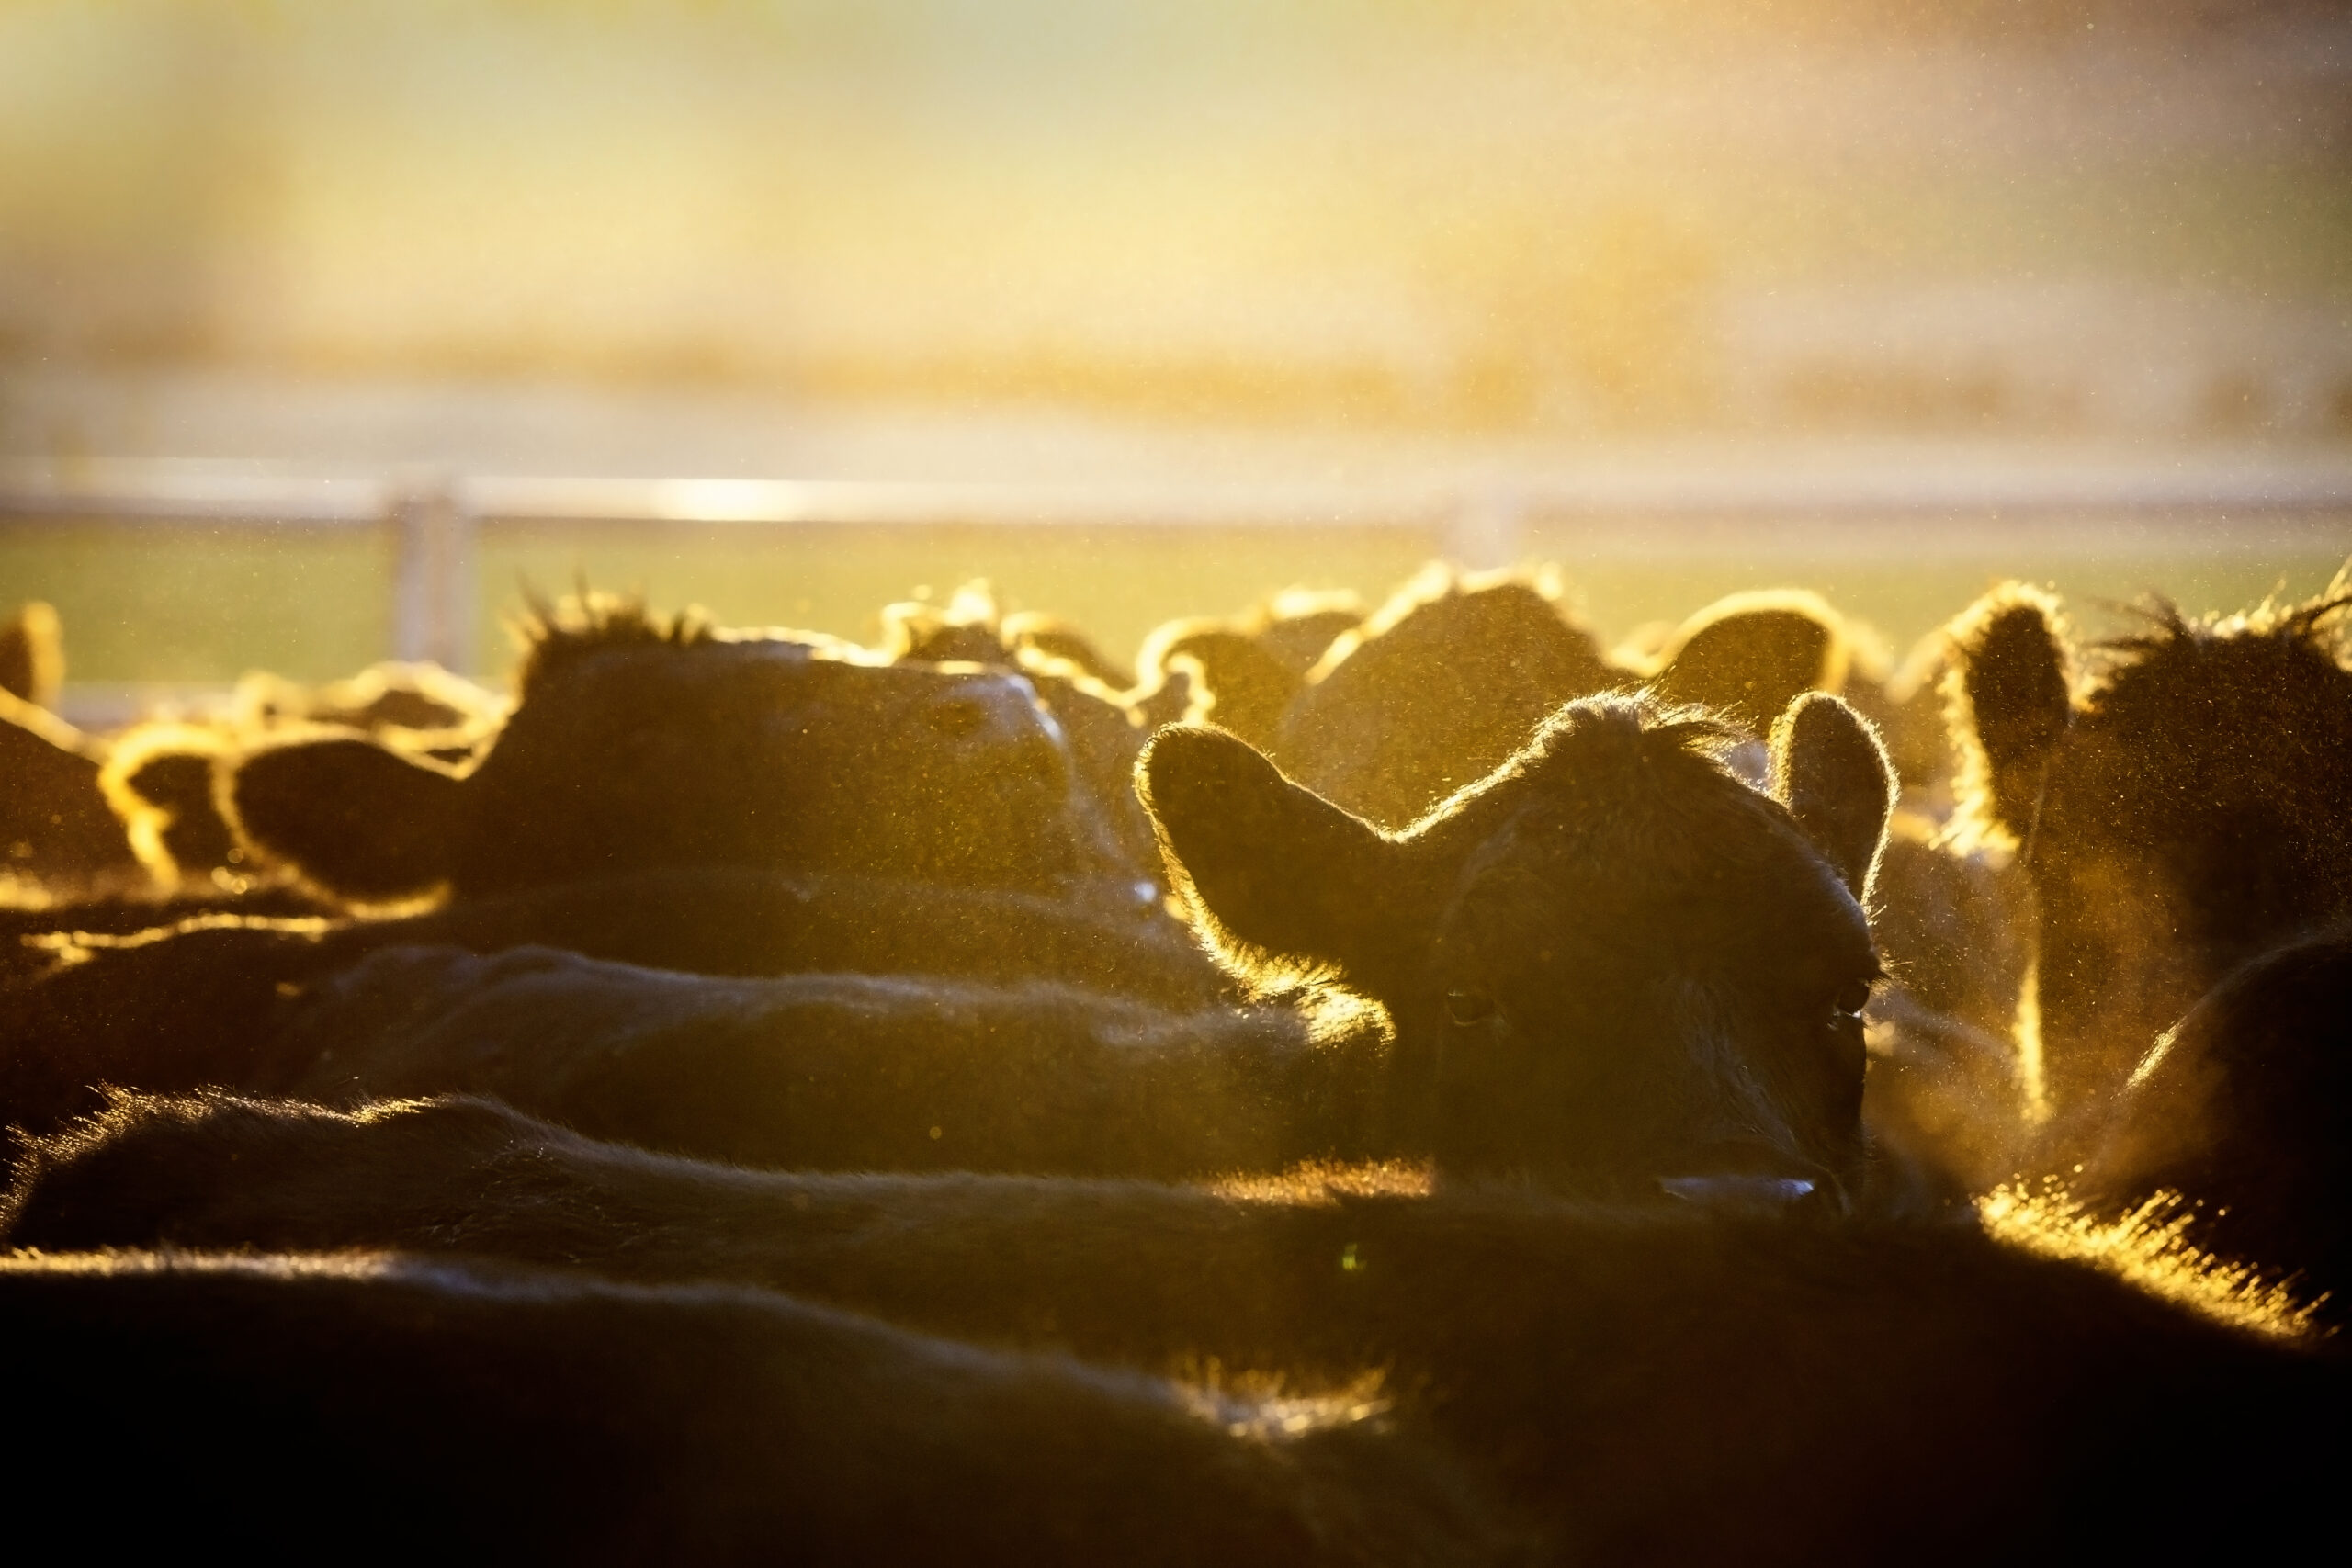
The number of cattle slaughtered in east coast yards last week was marginally (2%) down on the week prior. Queensland was the only state driving down the figures with 6% fewer cattle slaughtered compared to the week prior. A total of 123,125 cattle were processed which was 20% under the same week last year.

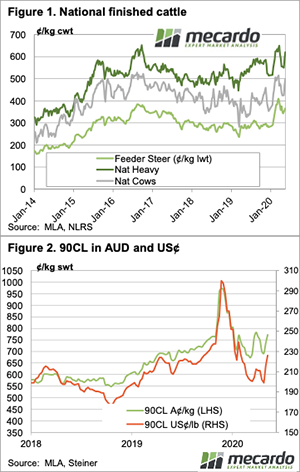
The Eastern Young Cattle Indicator (EYCI) lost 2% on the week, returning back to 754¢/kg. The National Heavy Steer also lost some of last weeks gain, falling 15¢ to 367¢/kg lwt. There was a show of support for cows with the National Medium Cow price receiving a small lift of 5¢ to 279¢/kg lwt. Processor steers ended with week higher again, up 5¢. While Feeder yearling steers lost some ground, moving back under the 400¢ mark to 397¢/kg lwt.

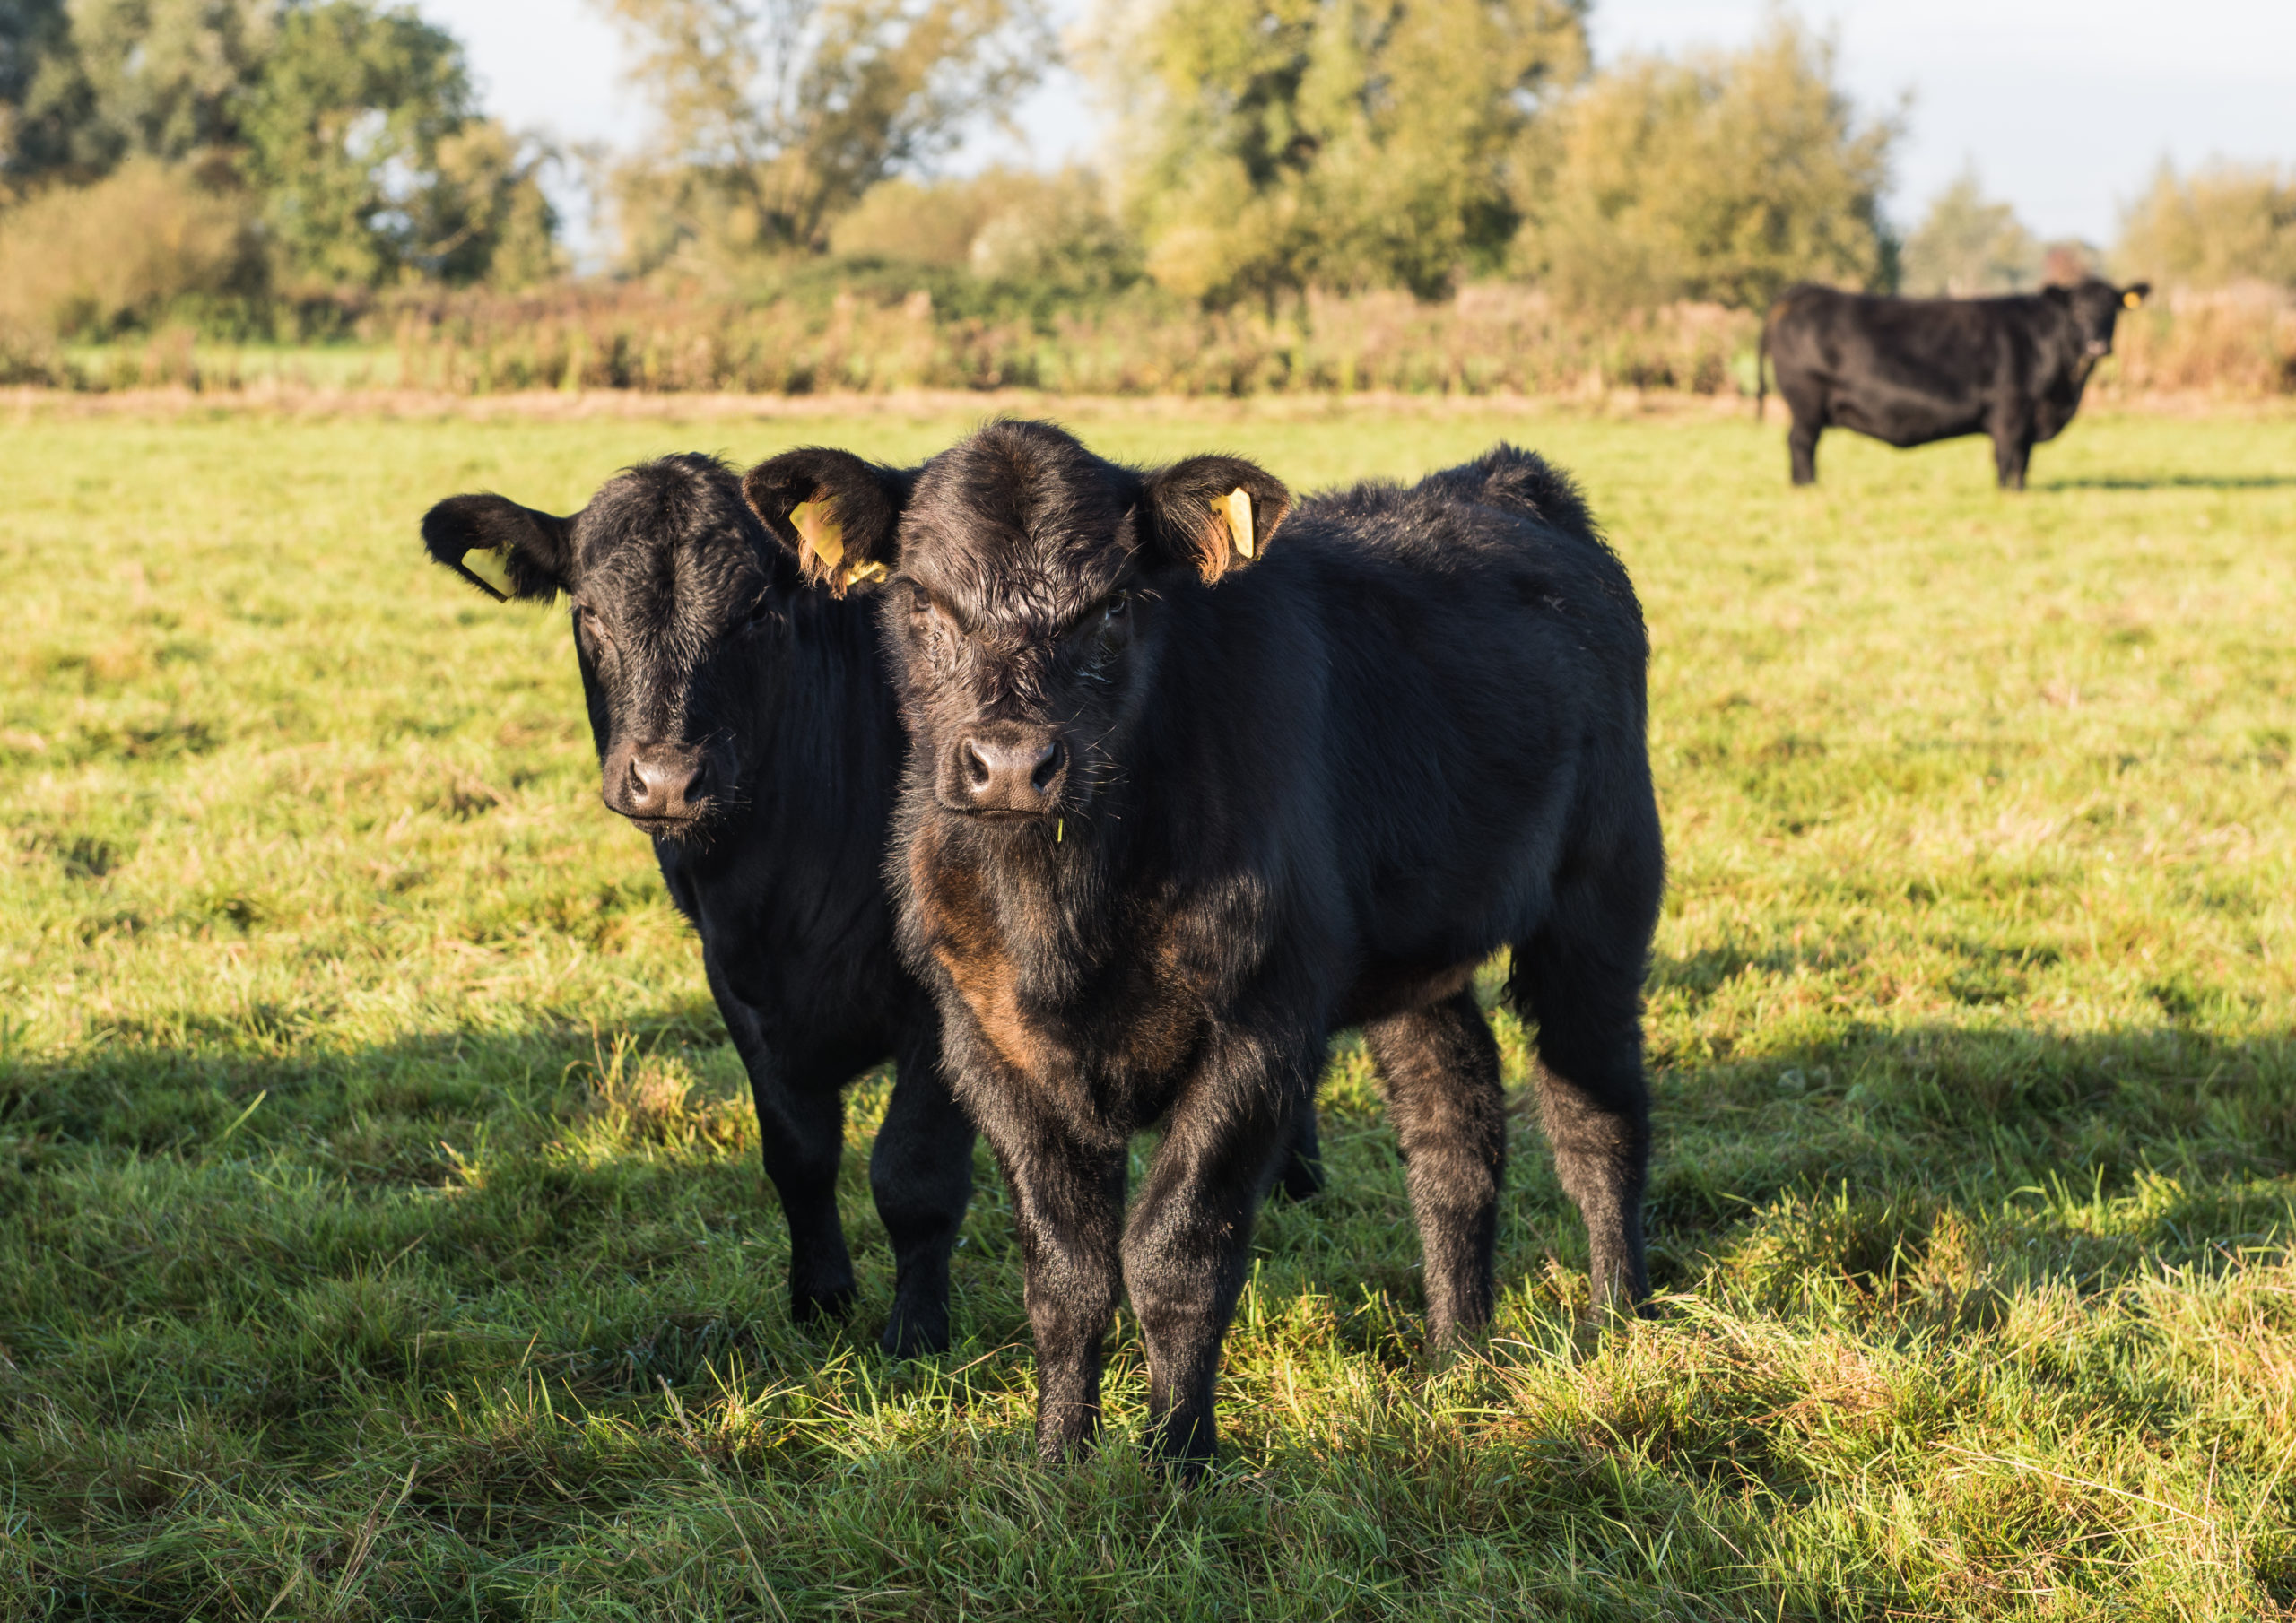
The 90 CL Frozen cow price crept lower last week, falling 1% to 747¢/kg in AUD. The Meat & Livestock Australia Steiner report indicated the “imported beef trade has become especially sluggish”. Slowing beef demand in the US and higher production as processing capacity is back to normal is putting pressure on US cattle values.

Next week:

Recent rain in southern parts of the country will no doubt be reflected in next weeks yarding figure release. Looking at the BOM forecast for the next week, there’s a good chance of another soaking in Tassie and the WA coast, however, the rest of the country is expected to remain fairly dry which won’t do much for demand.

Domestic focus drives an EYCI record

Young cattle prices continued to climb this week to hit a new high, taking no notice of lower export market values. The local supply situation and decent rainfall forecasts has saleyard prices trading back at global market values.

The Eastern Young Cattle Indicator (EYCI) lifted to find it’s new record on Wednesday at 772¢/kg cwt. This solid rise pushed the EYCI just a few cents above the previous high set in March.

Tight supply helped lend support to most categories of cattle. The heavy steer saw the best result with a weekly gain of 9% to close at 382¢/kg. Medium cows rose 3% to 271¢/kg lwt. It was only the Restocker Steer category that softened, albeit only marginally, down just 5 cents to 271¢/kg lwt. Both Processor and Feeder Steers found some support.

East coast cattle yardings saw a significant drop on the week as shown in Figure 2. Just 34,744 cattle were yarded in the week ending the 12th of May, which was a 29% drop on the week prior. Much of the fall was driven by Queensland with nearly 10,000 fewer head presented, but all states contributed to the tighter supply.

Slaughter levels rebounded slightly after last weeks low, rising 5% to see 126,034 head processed on the east coast. This was 12% under the same week in 2019.

Next week:

There isn’t much rain on the short term forecast for anywhere outside of Victoria, Tassie and the coastal fringe of WA, and even that looks set to be light. However, if slaughter and yardings stay this tight we will continue to see support for prices at the saleyard. How long tight supply can prop up saleyard cattle prices despite weaker export markets is the unknown we’re waiting to play out.

Export price correction but restockers don’t care

Cattle supplies have continued to tighten in June, with Queensland slaughter moving sharply lower last week.  While prices are running hot, there were some worrying signs in export markets and with currency movements.

In the week ending the 5th of June, it looks like Queensland cattle slaughter fell off a cliff.  Figure 1 shows that Queensland posted its lowest full week slaughter level since March.  The closure of Dinmore for a couple of weeks was likely responsible. Lower slaughter driven by plant closure, is less likely to impact price on the positive side, it could actually see prices fall.

Prices didn’t fall, which suggests the supply of available slaughter stock eased in line with the demand reduction. In Queensland over the hooks indicators all gained ground, with only Cows (512¢/kg cwt) remaining under 600¢/kg cwt.

The rally in export beef prices, as indicated by the 90CL came to a halt last week. Figure 2 shows the 90CL Frozen Cow in our terms losing 53¢ to head back to 763¢/kg swt (Figure 2).  The fall was partly driven by the Aussie dollar heading back towards 70¢ but was largely due to a 2.6% fall in US prices.

With US cattle slaughter reportedly back at 95% of the levels of this time last year, all beef prices are on the wane at wholesale. Obviously, this means weaker demand for imported beef and lower prices.

Restockers with grass tend to take little notice of export beef prices, and they, along with domestic processors and feeders helped lift the EYCI a few cents above 750¢/kg cwt.

Next week.

There is some rain forecast for South East Queensland next week, which will help support young cattle prices. The question is how far export prices can drift before processors start to hurt and cut slaughter rates and over the hooks quotes.

On the weather front over the medium term, things are looking rosy again.  Figure 3 shows the Bureau of Meteorology (BOM) three month outlook, and after looking decidedly drier last week, has reverted to previous positive projection.

It will be nice to see you EYCI

It has been a week since Meat & Livestock Australia’s (MLA) Officer’s returned to saleyards, and now have and Eastern Young Cattle Indicator (EYCI) for the first time in 9 weeks. It remains volatile, however, opening high and losing 10¢ in a couple of days.

The EYCI opened up at 756¢ earlier in the week, easing a little by yesterday to close its first week back at 746¢/kg cwt.  There should be no complaints from sellers, with the EYCI currently 50% higher than this time last year.

Buyers on the other hand, are paying through the nose. Over the hooks quotes for finished cattle were higher this week, around 600¢/kg cwt. The EYCI/finished spread only gets this wide when restockers are on a rampage.

Strong prices are drawing some more cattle out.  East Coast slaughter has rallied for the second week in a row. Last week cattle slaughter was up 3% (Figure 2), but it is down 18.5% on the same week last year.

On average, cattle slaughter peaks at this time of year, and processors would be concerned if we are in for a gradual decline in slaughter supplies from here.

The rising Australian dollar is not great for cattle prices, but for last week at least, increasing US 90CL export prices outstripped the currency increase. Figure 3 shows the bounce in the 90CL continues, pushing up to 816¢ in our terms.

Next Week

This week’s pause in the price rise might signal a peak for now.  Supply will be tight, but there remains some risk of lower prices for those carrying cattle through the winter. If the rain continues to come, it is hard to see prices falling too far until finished cattle start flowing off grass.

Look at them go

A good winter outlook, moisture in the soil and the lowest yarding levels all season have seen cattle prices hold ground this week for most categories. Although over the longer term it has been a good run for prices all year with average monthly price gains since January between 18%-35% across the CV19 reported categories.

The Bureau of Meteorology released their end of May three-month climate outlook yesterday and it shows a 60-80% chance of a wetter than average winter is expected for much of Australia. Furthermore, the very much above average root zone soil moisture seen during May across large areas of eastern NSW is giving some confidence back to producers impacted by the dry conditions seen in 2019 (Figure 1).

East coast cattle yarding levels have eased to the lowest weekly point this season with only 15,558 head presented for the week ending 22nd May, which represents a 73% reduction from the five-year average trend for this time in the year (Figure 2).

A breakdown of the three key east coast states shows cattle yarding in Queensland is running 63% under the five-year trend, while Victoria is at 73% below average levels. However, the state really dragging down the total east coast yarding numbers is NSW with a mere 3,841 head presented last week, 83% below the seasonal trend for this time in the year.

The combination of a favourable climatic situation and tight supply lent support to some cattle categories this week. The MLA CV19 for National Vealer Steer indicator showing the best result with a weekly gain of 4.4% to close at 420¢/kg lwt. National Medium Steer was up 2.4% and Medium Cow managed a 1.2% lift.

The National Heavy Steer softened 1% on the week to close at 351¢/kg lwt and Yearling Steers were off by 4.5%. However, a look at price gains since the start of the season highlights how 2020 has turned to favour producers with gains from 18%-35% across all reported categories (Figure 3).

What does it mean/next week?’

As outlined in last week’s market comment the improving picture in US Live Cattle Futures markets (up nearly 4% this week and closing at 101.6US¢/lb overnight) along with the combination of tight local supply and a good rainfall forecast all bodes well for cattle producers as we head into winter. Expect domestic cattle prices to continue to be supported over the short term.

Offshore markets and supply provide support

Some good weekly price gains were noted for the MLA CV-19 cattle indicators this week as a continued situation of tight domestic supply and improved offshore markets underpin local sales.

East coast cattle throughput levels have been rising from the seasonal low registered in April. However, compared to the five-year average trend and the 2019 pattern, yarding levels remain well below the normal situation (Figure 1).

During May, weekly east coast cattle yardings averaged 30% below the five-year pattern. Compared to 2019 the picture is even tighter, running 38% under levels seen this time last year.

Similarly, east coast cattle slaughter volumes show a tight result too. Since early May, weekly slaughter figures have continued to ease, drifting outside the lower end of the normal seasonal range. Indeed, the average weekly slaughter volume for May now sits 13% below the five-year average trend (Figure 2).

Across in the USA, the supply picture remains tight as well, albeit for slightly different reasons. Steiner report that the US Fed Cattle slaughter levels remain nearly 30% below this time last season, as processing plants still grapple with the supply chain impacts of the COVID-19 pandemic.

The tight conditions in the US providing some good support for the imported 90CL frozen cow indicator to see a strong increase on the previous week, up 4% to reach 804.2 AU¢/kg CIF – the highest it has been this year (Figure 3).

In further good news for global cattle market sentiment, the US Live Cattle Futures price has rebounded 22% from the seasonal lows seen in late April to trade just a fraction under 100US¢/lb this week. For those subscribers that managed to see the COVID-19 webinar (still available on MLA’s Youtube Channel) I participated in last month, they would recall that getting back above the 100US¢/lb level is crucial for longer term support into the Australian market. So, it is good to see some price improvement returning.

Local CV-19 cattle indicators are all benefiting from the tight supply and improved offshore situation with the National Yearling Steer leading the charge, up 11% on the week to 393¢/kg lwt. Medium Steer, Feeder Steer and Finished Steers are all putting in a good show too, up 7% (331¢/kg), 5% (377¢/kg) and 3.5% (349¢/kg), respectively.

Next week?

Tight supply, improving offshore prices and a good rainfall outlook heading into winter all play into the hands of cattle producers currently. This should continue to provide support to domestic cattle prices into the short term.

Continue to keep an eye on the US Live Cattle Futures price as the ability for it to gain a strong foothold above 100US¢/lb into the medium to longer term is key to keeping local prices underpinned.

Who let the dogs out?

Key Points

  • There are 5.1 million dogs in Australia. One for every 4.9 people.
  • The theoretical dog food demand is 451kmt.
  • This comprises 135kmt meat, 142kmt cereals and 142kmt animal byproducts.

I was pawndering the value our canine friends had on the grain market.  So now is a good oppawtunity to do some ruff calculations on the impact of dogs, and put a new leash of life on supply and demand. Let’s get into the ultimutt review of man’s best friends dinner.

Animal Medicines Australia is the peak body representing the leading animal health companies in Australia. They produced a national survey of pets in Australia (2019) which highlighted that there were a whopping 5,104,700 dogs in the country. That represents 1 hound for every 4.9 humans.

There are many different breeds ranging in size from the diminutive chihuahua to the gargantuan great dane. Therefore, its necessary to work what is the average size of an Australian dog. This is where the Australian National Kennel Council helped. They produce an annual report on the number of animal registrations for their membership on a per breed basis, which represents 67,900 dogs.

The Australian National Kennel Council is the administrative body for pure breed canines in Australia. It would be logical that their registrations would be representative of the overall population.

However, this dataset does not include the weights of each breed. So to provide a robust analysis for our readers I spent my night finding the average weight for each of the  220 breeds of dog listed. I was then able to produce a weighted average of dogs to determine what is the average dog weight. Through an analysis of the 2010-2018 year average, the weight is 22kg per dog.

The feed requirements for dogs are based on a conversion of grams of food per kg of bodyweight. There are numerous levels quoted by different manufacturers, however I have opted to go with 11g per kg of bodyweight.

On our average dog size of 22kg, this amounts to 242g of food per day. Across our average population of dogs this is a whopping 1235mt of food fed to dogs every day or 451,000mt per year (figure 1).

A highly esteemed pet food expert informed me that pet food sold in Australia is roughly on a 70% dry to 30% wet (canned meat) basis. Additionally, the composition of dried products is approx. 45% cereals and 45% animal by products.

We can then refine this further into three main dog food elements:

  • 135,300mt of meat in the form of canned products
  • 142,000mt of meat byproducts
  • 142,000mt of cereals*

It must be noted that this is a theoretical feed demand for dogs in Australia. There are a few caveats to this analysis:

  • Not all dogs eat store bought food. This analysis does not consider the feeding of food scraps etc.
  • Although the local demand is theoretically >450kmt, there are volumes of pet food imported into Australia.

*Cereal incorporates wheat, sorghum, corn, rice, barley and byproducts (soymeal etc).

What does it mean/next week?:

Pet food is an oft-forgotten industry in Australia. However, this analysis shows that they are an important part of a diversified agricultural supply chain.

As we potentially move into a future with more home-based working, we could see an increase in the dog population as workers look for company at home.

If we want to decrease our reliance on agricultural exports, we should consider supporting great dane breeders. As a move to a 100% great dane population would increase demand to approx. 1.5mmt per year.

Some positive signs amid the turmoil

The last week has seen some good news on the export front, with increasing volume to China, and some bad news, with the suspension of some plants. The news from the US was more positive this week, and while it’s not responsible for local price rises, it helps.

Despite the suspension of four beef processors from exporting to China this week, prices managed to gain ground. The Heavy Steer was the star performer, with the CV-19 National Indicator gaining 15¢/kg lwt, to get back to 335¢/kg. This week’s move puts the Heavy Steer back within 10¢ of the all-time record set back in March.

Cows and Feeders also gained ground, although they weren’t quite as strong (Figure 1). Tightening supply is no doubt helping prices higher, both at saleyard and over the hooks level, but improving export prices are playing a part.

Figure 2 shows the 90CL Indicator has lifted in both US and AUD terms (Figure 2).  Steiner report that many US users are short stock, as they took a wait and see approach in April, and now need to stock up.  Additionally, US Cow slaughter has been down, as with all cattle, and lean beef in general is in short supply.

The backlog of overfed cattle in the US might see continued lower Cow slaughter and provide some support for our exports over the medium term.

Despite the cattle backlog, US Live Cattle Futures bounced higher this week, moving back its highest level since mid-March.  More positive signs of some resilience of beef and cattle demand.

Next Week.

It is hard to see cattle supply improving as we move toward winter.  In fact, it should get tighter.  Stronger export prices will be required to see prices keep rising in a similar trend to the last couple of weeks.


A sharper rebuild at cost of supply

Key Points

  • MLA’s Cattle Industry Projections update shows even tighter supply in the coming years.
  • The herd rebuild is expected to be a bit quicker with better seasonal conditions.
  • Tight supply should support prices, but demand is highly uncertain.

Meat & Livestock Australia (MLA) have updated their cattle industry projections for April, with the key factor being going from hoping for a break in the drought, to actually receiving some rain. The updated outlook suggests a faster herd rebuild, but it’s going to cost in terms of cattle supply for the next.

The cattle herd is still expected to set an unwanted record on the 30th of June, but now the forecast is set to be slightly higher than previously thought. The updated Cattle Industry projections peg the herd mid-year at 24.8 million head.

Figure 1 shows the herd projection for this year is 100,000 head higher than the January projections. While this is minuscule in the scheme of things, it is a reflection of tighter slaughter in the first quarter of 2020.

Out to 2023, the improved seasonal conditions have seen herd levels revised from 1.8 to 2.5% higher. Despite the higher herd projections, we are still set for a 27 year low for the herd this year. It is also expected to take until 2022 to get back to herd levels of last year, and even in 2023 it won’t quite be back to 27 million head.

To achieve a faster rebuild of the herd, there have to be fewer cattle going to slaughter.  MLA’s have adjusted cattle slaughter down in all projection years except 2023. The biggest declines are expected this year and next, with projected slaughter down 4.2% (Figure 2).  This year cattle slaughter is expected to be 6.9 million head, a 24 year low. A new low water mark is forecast for 2023, with 6.8 million head the lowest since 1989.

Cattle slaughter is expected to remain relatively tight in 2022, still under 7.5 million head, and only returning to the ‘normal’ levels of most of the 2000-2010 period in 2023. Figure 2 clearly shows the boom and bust cycles for the last 10 years, with droughts and strong slaughter followed by wetter periods and very tight supply.

What does this mean?

It should be relatively comforting for cattle producers that while we are entering a period of uncertainty in regards to demand, tight supply will at least offer some support for cattle prices.  At what level is something we’ll look at next week.

There is even some time for demand to recover, and help values rise before supply will be back near what could be considered ‘average’ levels.


A positive result (and not for Covid19)

Improved finished cattle prices were noted this week as supply metrics begin to normalize, particularly for east coast cattle slaughter. Department of Agriculture, Water and Environment beef trade statistics for April show Chinese demand for Aussie beef recovering strongly too as an added positive sign for producers.

East coast cattle yarding levels have held firm at around 45,000 head for the final week of April and the first week of May, indicating some stability is returning to the market after some wild swings pre-Easter (Figure 1).

Weekly throughput remains 20% below the five-year trend but is within the normal range for this time in the season, as represented by the grey shaded 70% range zone. In an interesting dynamic between state yarding levels, Queensland is running 25% above the five-year trend as of early May. However, NSW cattle yarding is well below normal at 53% under trend. This is contributing to the lower than average total east coast figures and is perhaps a sign of the appetite in NSW from producers to restock.

East coast cattle slaughter numbers have returned closer to the five-year trend, to sit just 5% below with around 135,000 head processed in the first week of May (Figure 2). Since the Easter lull, slaughter volumes have increased 27% and the return to relatively normal operations have seen demand pick up for finished cattle this week. The National Heavy Steer (CV19) indicator has lifted 4.5% since the end of April to close at 320¢/kg lwt (as at 6th May).

In further promising signs for beef producers, beef export flows were above the five year average pattern in April (Figure 3). While US flows remain very subdued, a strong increase in exports to China is a good sign that their economy is getting back on track post their COVID-19 shutdown. There will be more to come on this in the Mecardo analysis piece next week.

Next week?

Tight supply and a favourable rainfall forecast continue to favour cattle producers and provide underlying support to prices. While there are headwinds in the form of a disrupted US/global economy, low global cattle prices, and a strengthening Australian dollar, the sign of a re-emerging China should tip the balance towards a more optimistic outlook for prices, at least for the short term.