
At times, I feel jealous of my counterparts writing about the livestock and wool markets. They always seem to have something positive to comment on with markets driving higher. However, markets are cyclical and things can change quickly.
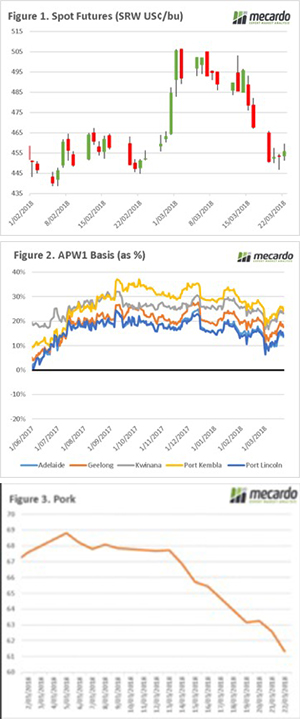
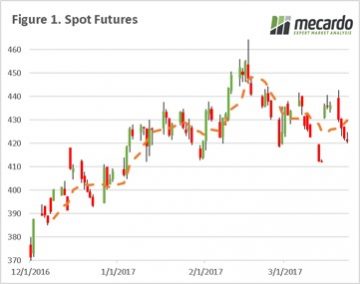 The futures market has subsided (figure 1) in the past week, as areas of dry concern receive forecasts of substantial rain in the US, and minimal bad news coming out of Europe. The reality is that the trade is concerned about USDA stock reports due next week. This asks the question, what if exports have not been high enough to deplete stocks?
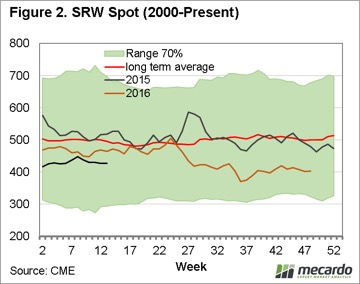
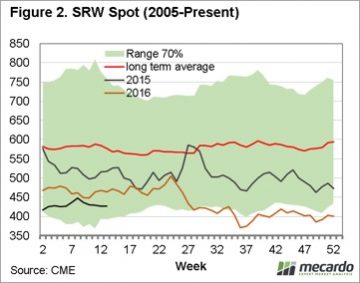
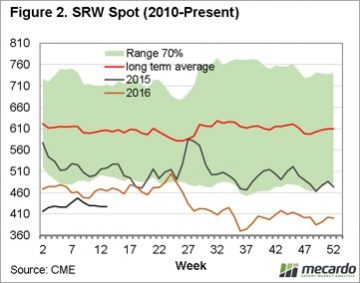
The extent of the global stocks is applying pressure, which since the start of the year has seen the spot futures trade in a band of 20¢/bu from 420¢ to 440¢. When we look at the seasonality of the spot futures contract (figure 2 -animated) we can see that we are well below the average since 2010, yet looking back further to 2000 & 2005, we are closer to the average futures price.
 However at a local level, we have seen basis increase across all port zones (figure 3) at an average increase week on week of $3.50/mt. This is using the public bid, and there are further opportunities out there for non-public sales.
We expect also that in coming weeks, we may see improving feed barley prices as buyers scramble to fill orders for the massive sales into Saudi Arabia. So, it’s not all bad!
Next week
All eyes on the northern hemisphere, every day that goes by without hiccup is a day with less risk. The major risk is huge carryout and an average to above average crop.
 We will get an insight into inventory levels with next week’s USDA quarterly stock report.

 The rainfall was better than expected, but the impact on price was about right. This week east coast rainfall saw lamb prices move back to a one month high, while mutton jumped to what is very nearly a new record. In the west prices corrected, but remain at the stronger end of the scale.
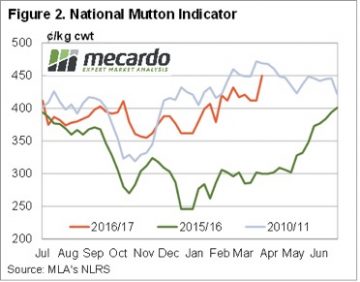 Lamb prices also rallied, but not by the same extent. The Eastern States Trade Lamb Indicator (ESTLI) gained 10¢ to hit 632¢/kg cwt, a four week high. Interestingly, this week was the third most expensive week for lambs this year (figure 3).
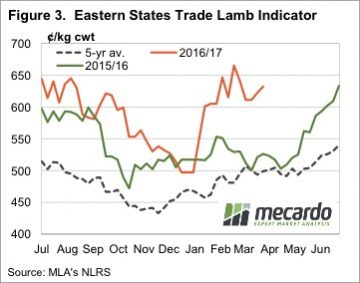 Tight supply continues to support sheep and lamb markets, and with rain this week, there is unlikely to be a lot of pressure to sell, with high prices the only thing that might keep supply flowing.
 If you read agricultural news websites, or even listen to the ABC’s country hour, you will be aware of the beef ‘scandal’, which has hit Brazil this week. The reasons behind the scandal have been well documented, so we won’t repeat them here. What we will do is look at what a suspension of Brazilian imports might mean for Australian beef exports.
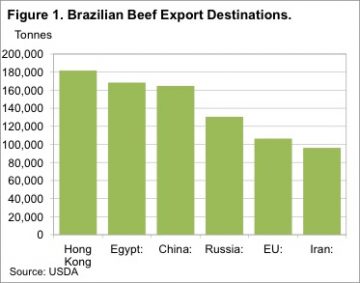
 In reality, Uruguay and New Zealand are not really in a position to increase exports to China. Figure 3 shows the Uruguay and New Zealand have much smaller export programs than Australia and Brazil.
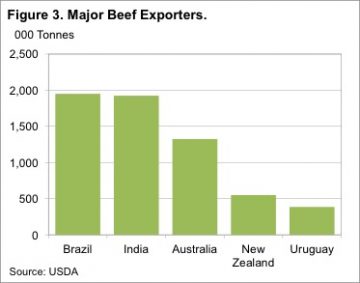 For a country with such a large export program, being suspended from your biggest market is going to be disastrous for beef and cattle prices. In Australia it would be similar to the US or Japan banning our beef, and we then either need to increase domestic consumption or find another market. Prices would fall very, very quickly.
 In reality the widespread east coast rainfall would have been enough to halt the gradual slide in cattle markets. Almost all major cattle areas in Victoria and NSW got between 25 and 50mm, while in Queensland it was the far west, and south east which missed out.
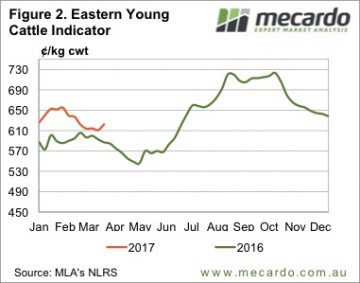 Young cattle prices rallied, but you might expect a bit more. The EYCI gained 11¢ for the week to reach a five week high of 622¢/kg cwt. NSW and Queensland were the main movers, with feeders and trade steers gaining ground, while in Victoria prices were steady.
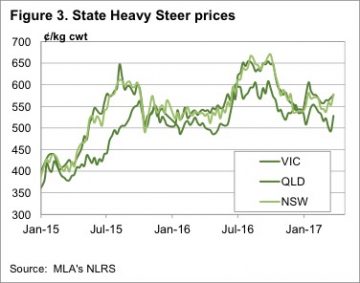 The better conditions are not going to go away soon. The improved demand for slaughter cattle could easily dissipate next week, but it’s very uncertain. What we can expect is tempered downside in young cattle from here, as there will be some pressure over the coming months, but improved restocker demand should soak it up.
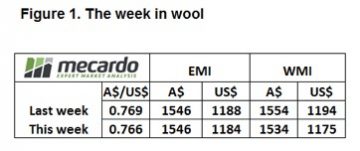 A bit of a mixed market this week with the very fine end still surging forward but some beginning whispers of nervousness among exporters at the auctions this week starting to creep in, although this may begin to be eased by a softening A$.
 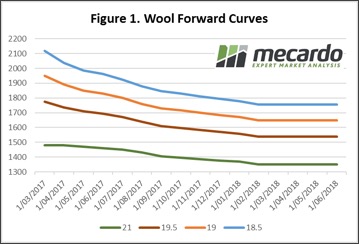 Given the higher volumes on offer, the reaction of the market as a whole not too bad with the 20-22 micron categories taking the most heat. A total of 45,507 bales sold out of 49,214 on offer resulting in a slightly higher pass in rate of 7.5%
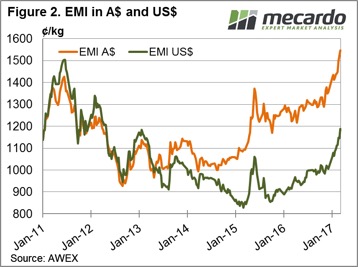 Next week we have just under 47,000 bales listed for sale with trading schedule two days. A drop in volumes on offer for week 40 and 41 toward the lower 40,000 region could see further gains in price in the coming week, particularly if the A$ can slide back towards 75¢US.
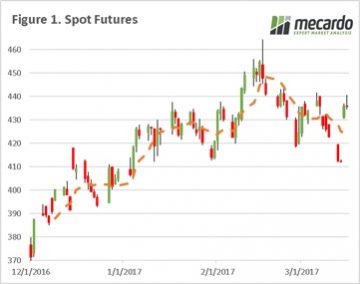 Early this week wheat futures fell on the back of lack of fresh data, and encouraging crop conditions in eastern Europe. The generally benign conditions and the large global surplus is keeping a dampener on large upside potential. The market fell around 15¢/bu ($5.7USD/mt), before regaining strength to hold currently 8¢/bu ($2.3USD/mt) above last Friday (figure 1).
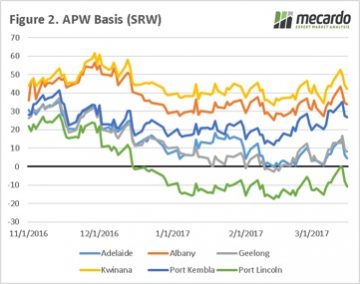 This week the US fed jacked up their interest rates by 25 points, typically this would put pressure on the Australian dollar however this was not the case. The Australian dollar rose to above 77¢ (figure 3), and the AUD trade weighted index rose dramatically.
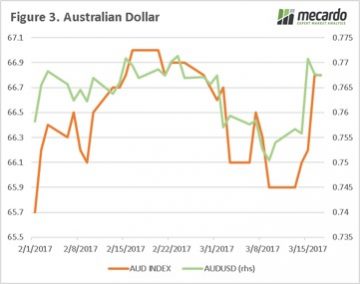 There are some concerns in the US related to dry weather, and eyes will be on weather forecasts pointing toward a deluge in the coming weeks. If this eventuates it will lead to an improvement in US crop potential.
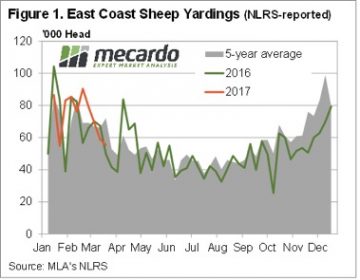
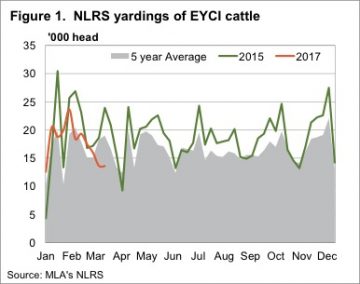
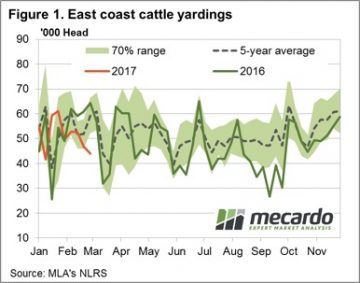 Figure 1 shows the east coast throughput tracking lower again on the week, despite a lift in Queensland yarding numbers, as the southern states start to restrict supply. The 43,900 head reported marginally softer than last week, but quite a bit lower than the same time in 2016 when just over 64,000 head were going through the east coast sale yards.
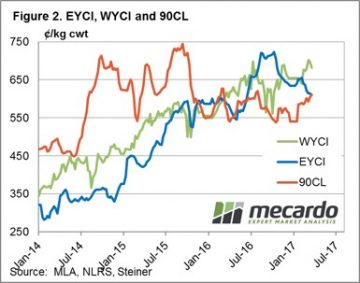 Western prices softer across the board with pastoral cows mirroring the SA medium cow falls, down 25.5% to 168¢/kg, while the Western Young Cattle Indicator (WYCI) only marginally lower to 682¢/kg – a 2.3% drop on the week. The Eastern Young Cattle Indicator (EYCI) reasonably stable, with only a 0.5% decline to close at 611¢, exactly where the 90CL beef export prices managed to finish the week – figure 2.
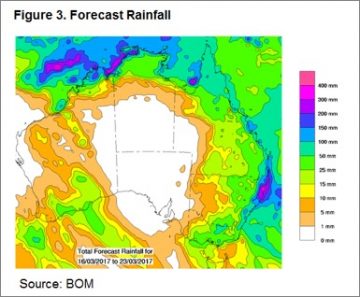
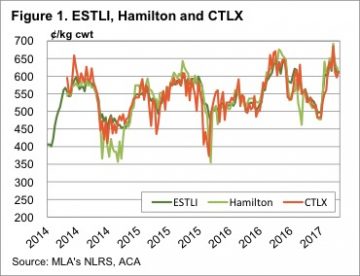 Regular readers will know that when we talk about lamb markets, we use the Eastern States Trade Lamb Indicator (ESTLI) as a base for our analysis. The regular reporting and widespread coverage of the ESTLI make it a reliable gauge for the level and direction of the lamb market. However, with the recent launch of MLA’s new market information website, we can now drill down to saleyard level and get some specific regional spreads to help guide buying or selling decisions.
 To give an example of how helpful this data can be, we have run some comparison of price for 20-22kg lambs, sold to processors, in Hamilton and CTLX. To get a good data, we had to merge the young lamb and old lamb prices series, and this makes it obvious when young lambs arrive in these markets. This analysis will give us an idea of how reliable the ESTLI is as an indicator for these yards at different times of year.
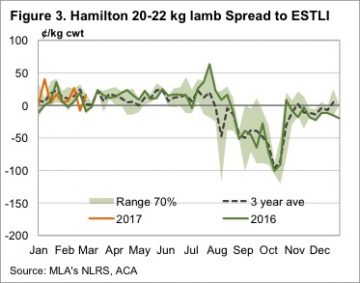 Looking at markets on an annual basis shows a clear strategy for trade lamb producers who use these saleyards. At Hamilton, there is an annual heavy discount for trade lambs to the ESTLI, starting in September and not really correcting until November. This is due to the dearth of lamb numbers, and specifically young lambs, with a critical mass not usually arriving until November, when prices generally run at a small discount to the ESTLI.
 The brief analysis tells us that for most of the year the ESTLI is a good indicator of prices at Hamilton and CTLX. When lamb prices move to heavy discounts to the ESTLI is when there aren’t many lambs being sold. This tells us that if we are going to sell lambs in early spring, these saleyards might not be the best option.
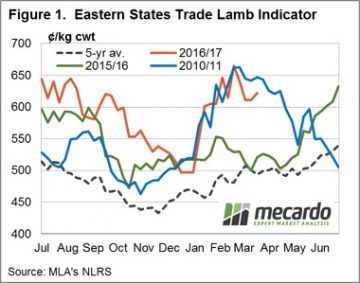 Supply was back this week on the east coast, as the public holiday in Victoria impacted numbers. It was in NSW and SA where prices rallied however, with their respective trade lamb indicators gaining 10 and 17¢ to 622 (NSW) and 576¢/kg cwt (SA).
 Figure 2 shows the stellar rise of lamb prices in WA, as they move to a premium to the ESTLI for the first time in 15 months. Lamb prices in WA have rallied for four and a half months, and added 200¢, or 44%. This weeks 16¢ rise to 645¢/kg cwt was in spite of a 40% increase in yardings. The lift in yardings might be due to over the hooks quotes running almost 100¢ behind the saleyards.
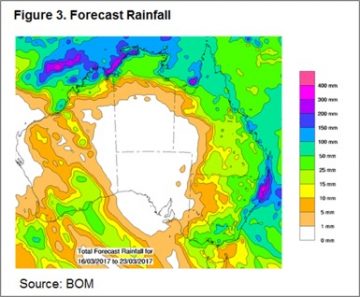 The rain forecast in figure 3 should see solid support for lamb and sheep prices over the coming weeks. It will encourage holding lambs, and sheep as it looks like an autumn break for at least some parts of the country.