 Surging weekly Queensland throughput and above average NSW throughput weighed on cattle prices in these regions dragging down the east coast figures this week with the Eastern Young Cattle Indicator (EYCI) dropping to levels not seen since the start of the season.
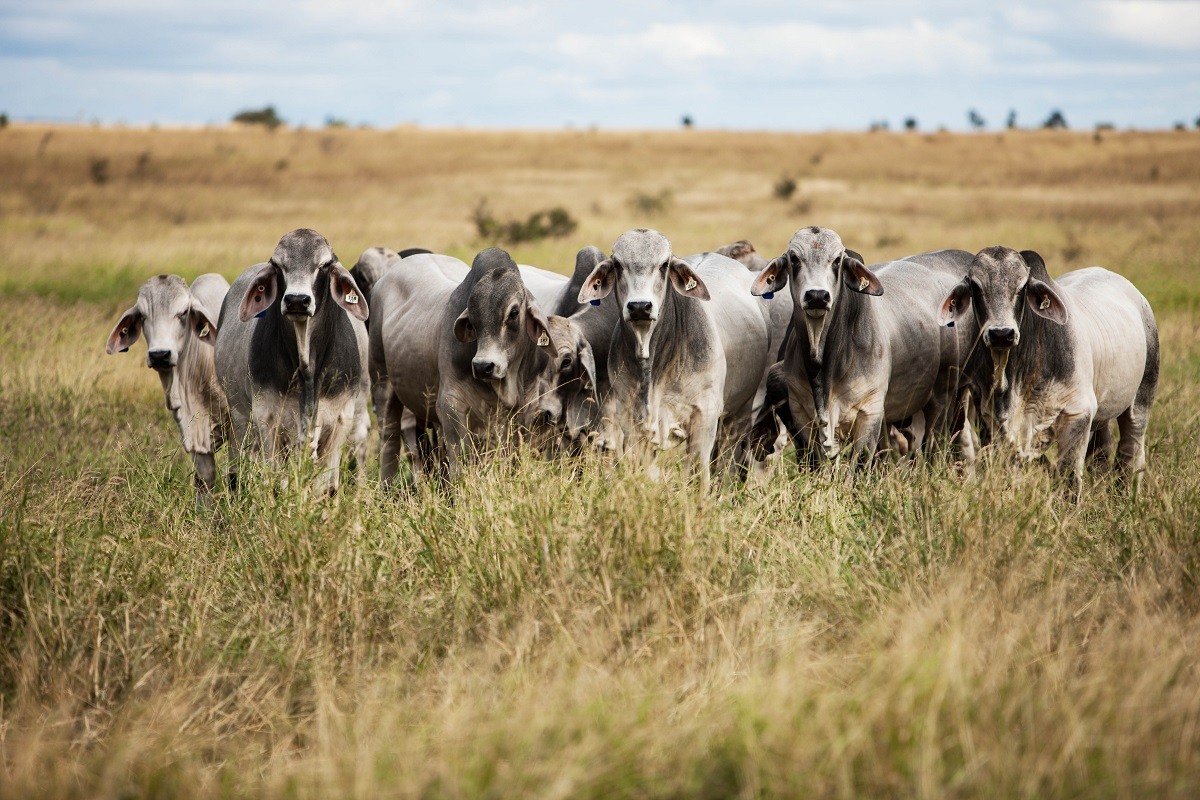
Figure 1 highlights the yarding pattern so far this year in Queensland with the large jump in throughput evident for this week compared to the 2016 trend and the five-year average pattern. The 19,246 head recorded a 57.8% increase on the average for this time of year. Queensland the only state to see price falls in all NLRS reported saleyard categories of cattle with QLD Feeder Steers leading the decline posting a 4% drop to 353¢/kg lwt.
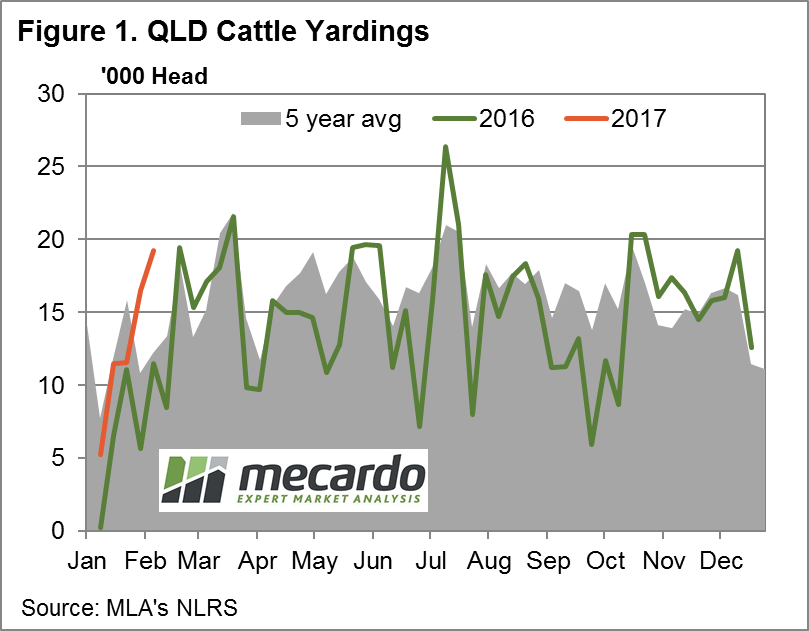
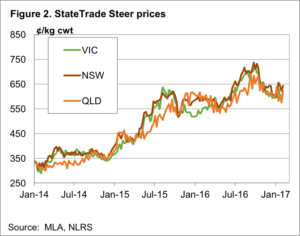
 NSW experiencing price declines in all NLRS saleyard categories, apart from Medium and Heavy Steers, with Trade Steers headlining with the biggest percentage decrease, down 6% to 332¢/kg lwt with elevated NSW throughput appearing to contributing to the price pressure – figure 2.
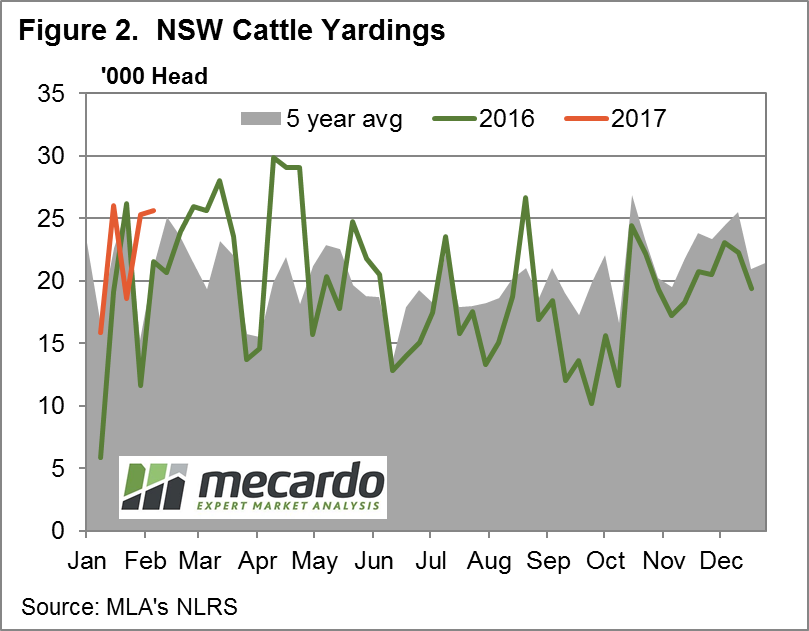
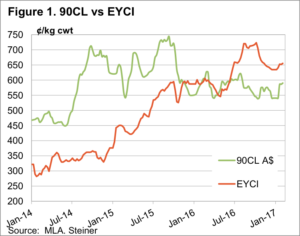
The EYCI dropping 3% on the week to close at 636.5¢/kg cwt despite beef export prices managing to hold onto the recent gains with the 90CL frozen cow tracking sideways to finish the session off at 585.5¢/kg CIF – figure 3. Softening US cattle futures creating some headwinds for the 90CL and providing a barrier to local cattle prices extending their gains achieved since the start of the season.
 Register here for the MLA/Mecardo Cattle Market Webinar scheduled for the 16th February at 1pm AEST. Registered participants will be able to view a copy of the webinar at a time that suits them if unable to view it live.
The week ahead
While it is not uncommon to see weekly throughput in Queensland test toward the low 20,000 head vicinity during March/April the surge reported this week comes a little earlier than anticipated. Perhaps brought forward by the attractive price levels and the prospect of a drier than normal February – April period as forecast by the Bureau.
If you haven’t already done so, please consider signing up for the cattle market webinar we are running in conjunction with MLA on the 16th February – see link above for further details.
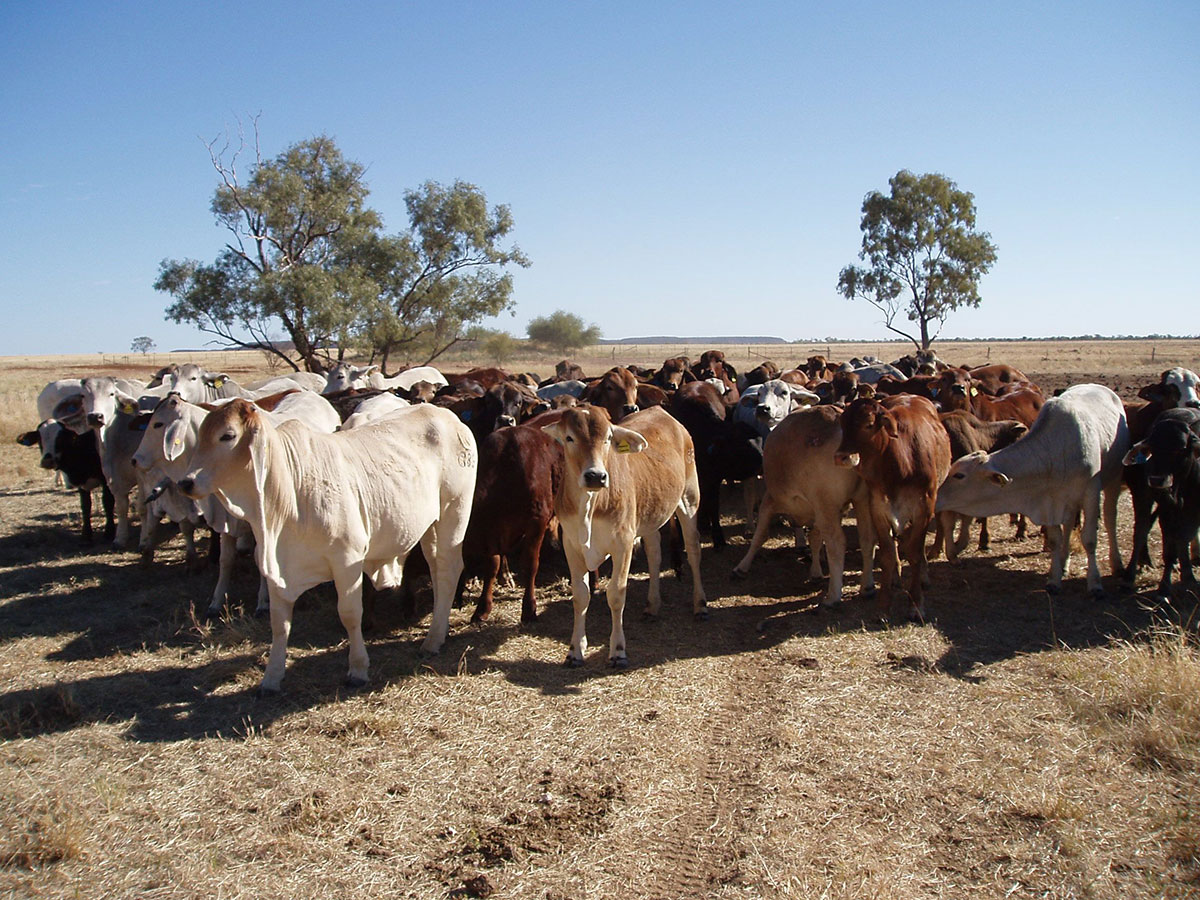
 Often at Mecardo we look at local and global cattle price relationships in US$ terms as the US cattle market is one of the key drivers of Australian cattle prices over the longer term. However, in this analysis we flip the magnifying glass to take a look at global prices in our terms.
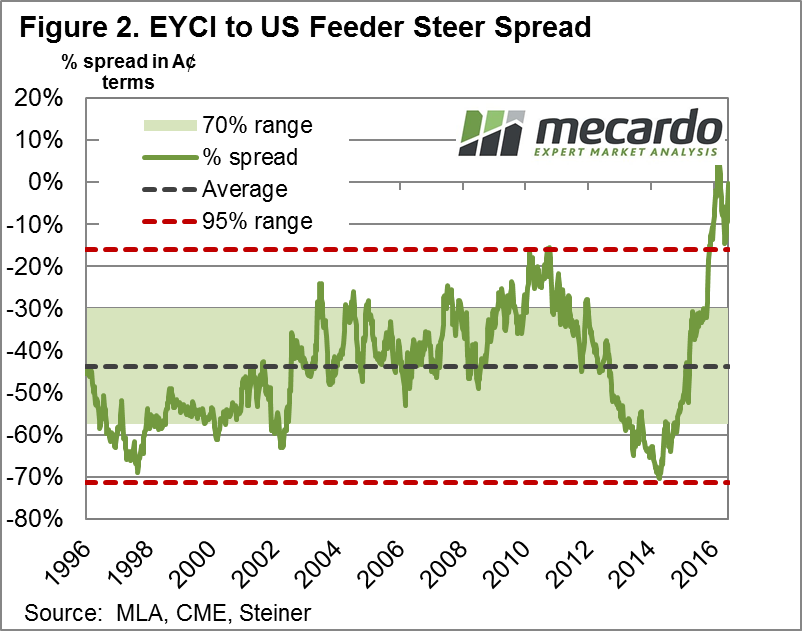 Taking a look at the correlation between US Feeder Steers and the EYCI we can see a moderately strong relationship between the two series when looking at annual average prices expressed in A$ terms – figure 3. Although,
  The lift in US prices since October has taken some of the downward pressure off local prices. Although from a longer term historical perspective local prices remain in overvalued territory and have not been helped by a stronger A$ during January.
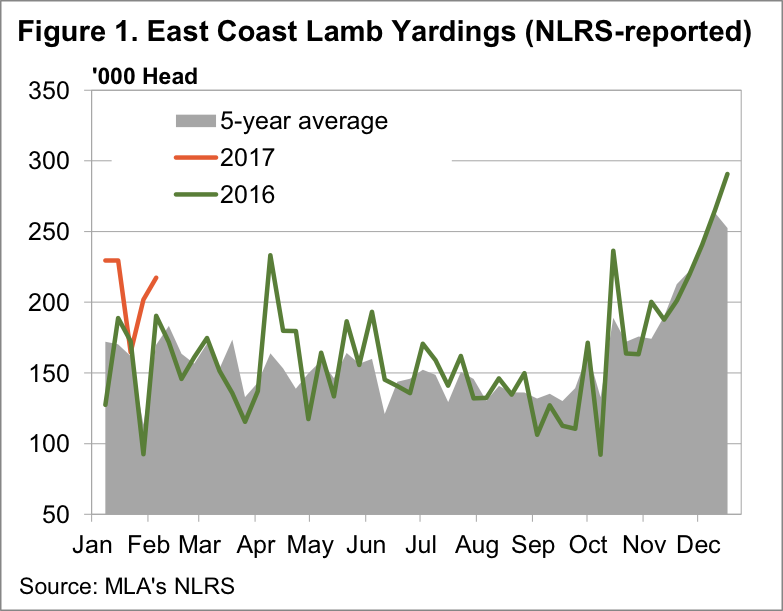 The very high prices seen last week had the desired effect for processors, drawing out very large lamb numbers, and sending prices lower. Sheep are a bit of a different story, especially in Victoria, where yardings waned, and as such prices have largely held their ground.
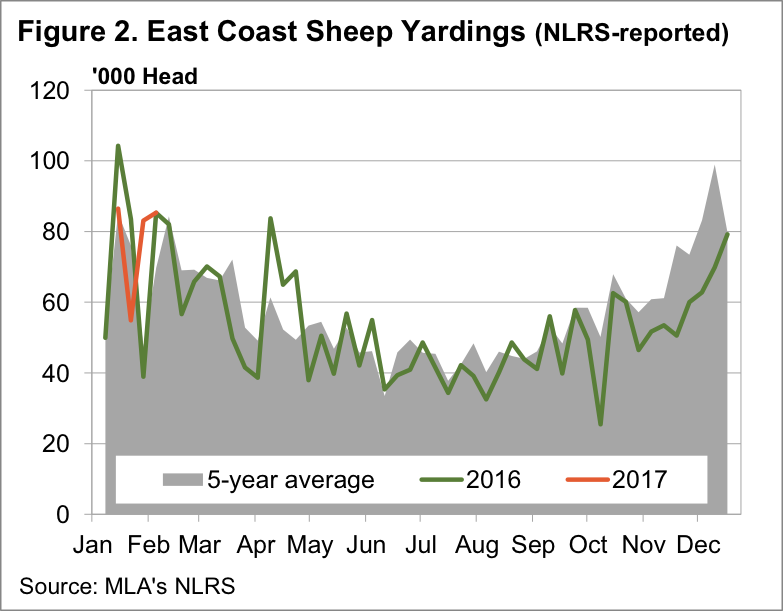 The fall was strongest in Victoria, where trade lambs lost 45¢, or 7%, and moved back into line with NSW and SA.
 In WA lamb prices continued to play catch up to the east coast, with the WA Trade Lamb Indicator (WATLI) hitting a 19 month high of 548¢/kg cwt (figure 3).
 The good news for the wool market continued; again, it was the fine wool that was the stand-out and led the market. Sydney had a designated fine wool sale; this came at the perfect time for NSW fine wool growers resulting in the Merino fleece and skirtings component having an almost total clearance with only 1.6% Passed In, compared to the national PI rate of 6.7%. The EMI was up A$0.15, while in US$ terms it was 9 cents better.
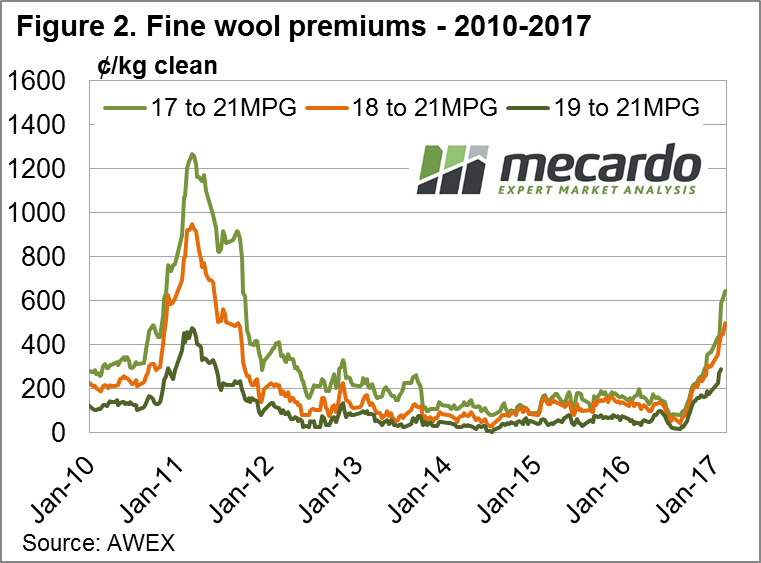 The last time 18MPG basis was at this level was July 2011 (Fig 2). Of further note is that in July 2016 (last year) it was quoted in Melbourne at 52 cents. Is that a 900% increase in less than 12 months?
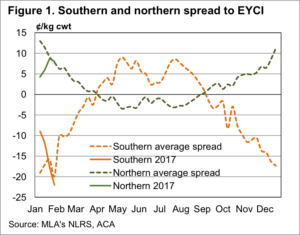 ements suggest this will again be the case, so what does this mean for pricing over the coming months.
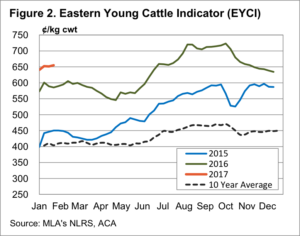 More interesting is what happens from there with the southern spread to the EYCI. Over February, March and April, the southern discount becomes a premium, as the supply of grass finished cattle tightens, as grass supply wanes.
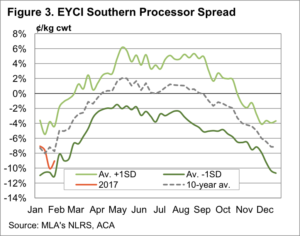 It young cattle destined for slaughter, or trade steers and heifers, which are set to benefit the most over the coming months. Figure 3 shows that young cattle sold to processors improve 8% over the late summer and autumn. From the current level of 595¢/kg cwt, a narrowing of the discount to parity, would see the price reach 630-640¢/kg cwt. Prices haven’t been this good since October.
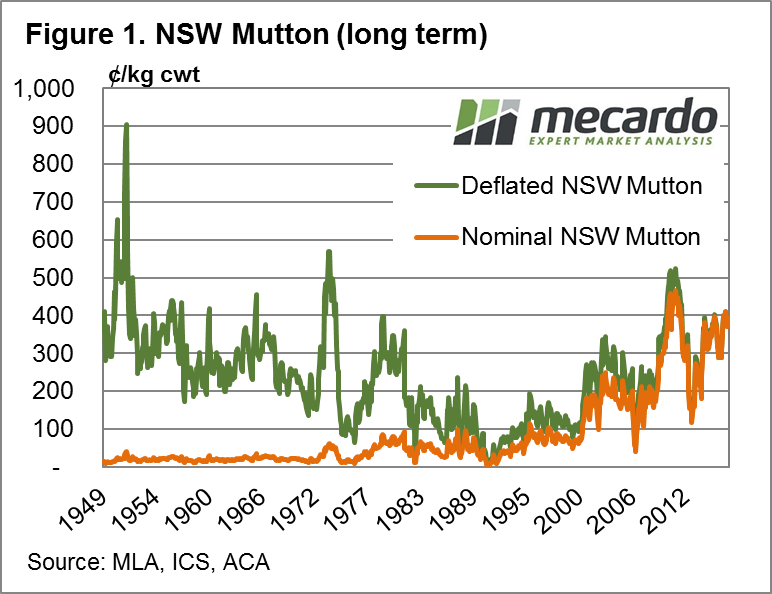 in deflated terms (current day dollars) occurred during April 2011 at 523¢/kg cwt
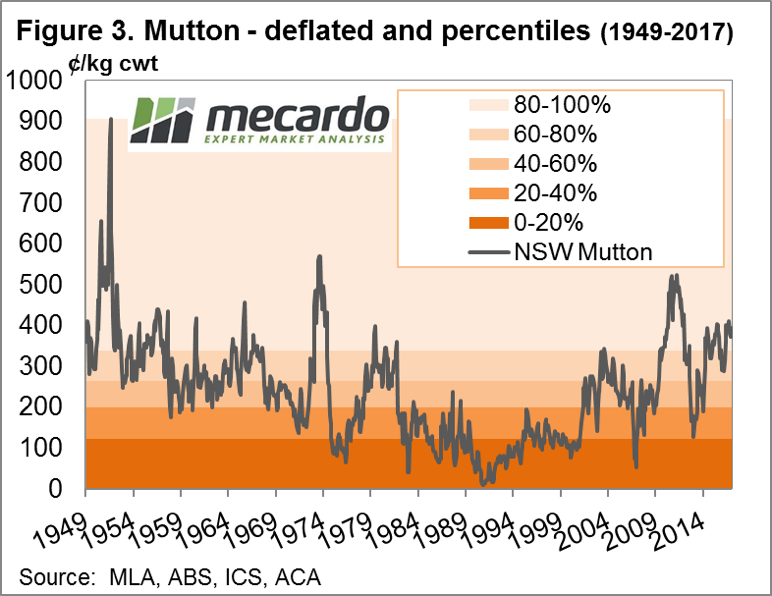 price series overlaid with percentile ranges which shows that the current average monthly NSW mutton price has remained in the 80-100th percentile range since April 2016. Unquestionably, mutton prices are holding firm with the January average of 394¢ sitting at the 90th percentile when compared to the deflated price data series since 1949.
 ood for us if McDonalds sell more burgers in the US.
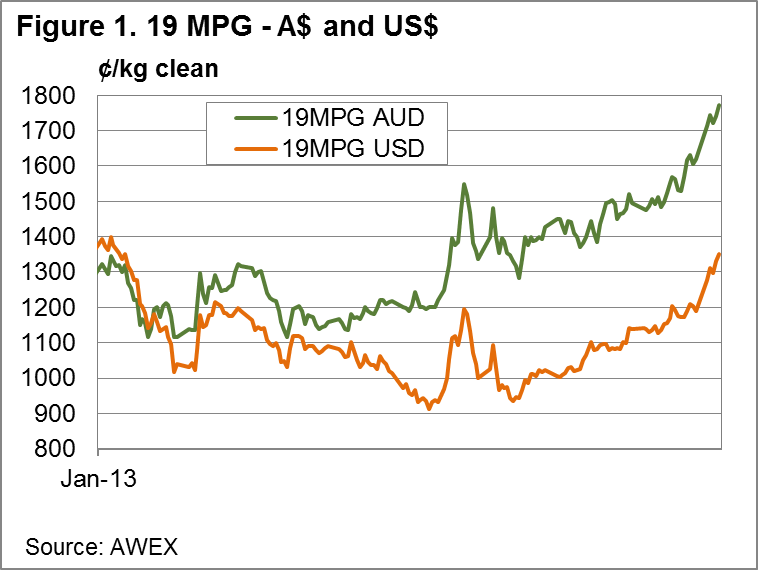
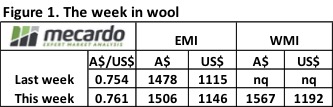 Increased demand this week from exporters noted as Chinese buyers resume their activity, undeterred in the face of a higher A$. The EMI creeping back above 1500¢, up 28¢ to 1506¢ and gaining 31US¢ to 1146US¢. The Western markets resumed auctions this week and activity participated in the rally, making up for lost time with a 63¢ rise to see the WMI at 1567¢, up 58¢ in US terms to 1192US¢.
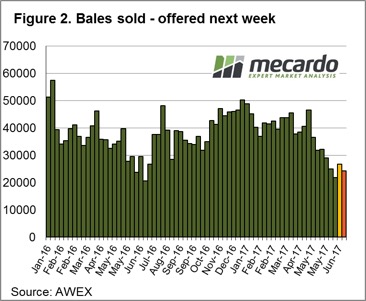 Interestingly, the medium fibres displaying a more robust price movement this time around with the 21 micron reaching levels in AUD terms not seen since the middle 1988. Indeed, in May 2016 when the 21-micron hit 1535¢ in the South the 17 mpg was trading above $23 and the 19 mpg was above $19.5. This week with 21 mpg at 1549¢ the 17-micron unable to climb above $22 and 19-micron can’t crack the $19 level.
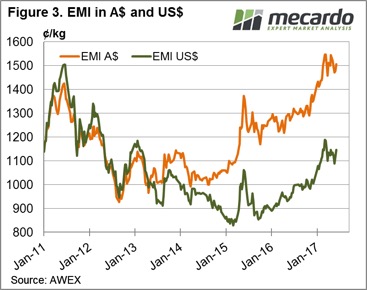

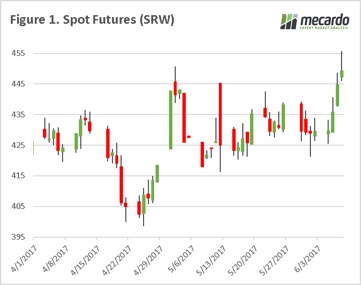 A great week for farmers on the grain markets. The speculators whom many like to chastise for being involved in the grain markets, in combination with worsening weather, have helped put a little fire under the wheat market.
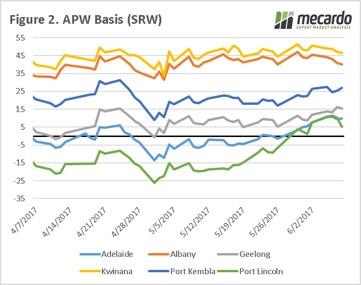 East coast basis levels have conserved their gains from last week, and continue to be in positive territory across all zones which we regularly monitor (figure 2). Although basis and futures have both risen, unfortunately for growers the A$ has also risen to 75.2¢ which has reduced some of the benefits but still overall positive for pricing.
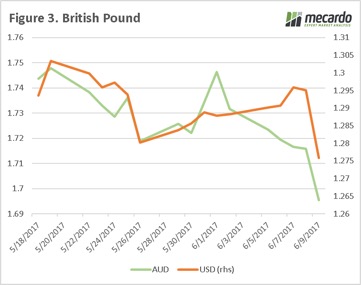 The USDA will release the June WASDE overnight. Will there be any surprises in this month’s report? We have seen issues in Europe, and it wouldn’t be a surprise to see some production downgrades.
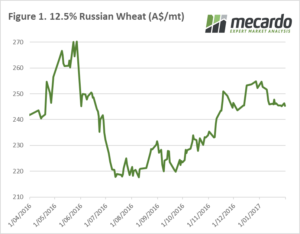
 At a local level, we continue to see basis come under pressure. In figure 2, we can see that Geelong has now joined Port Lincoln in the negative basis club, with likely Adelaide to follow soon. The weight of harvest could likely keep basis levels depressed for sometime.