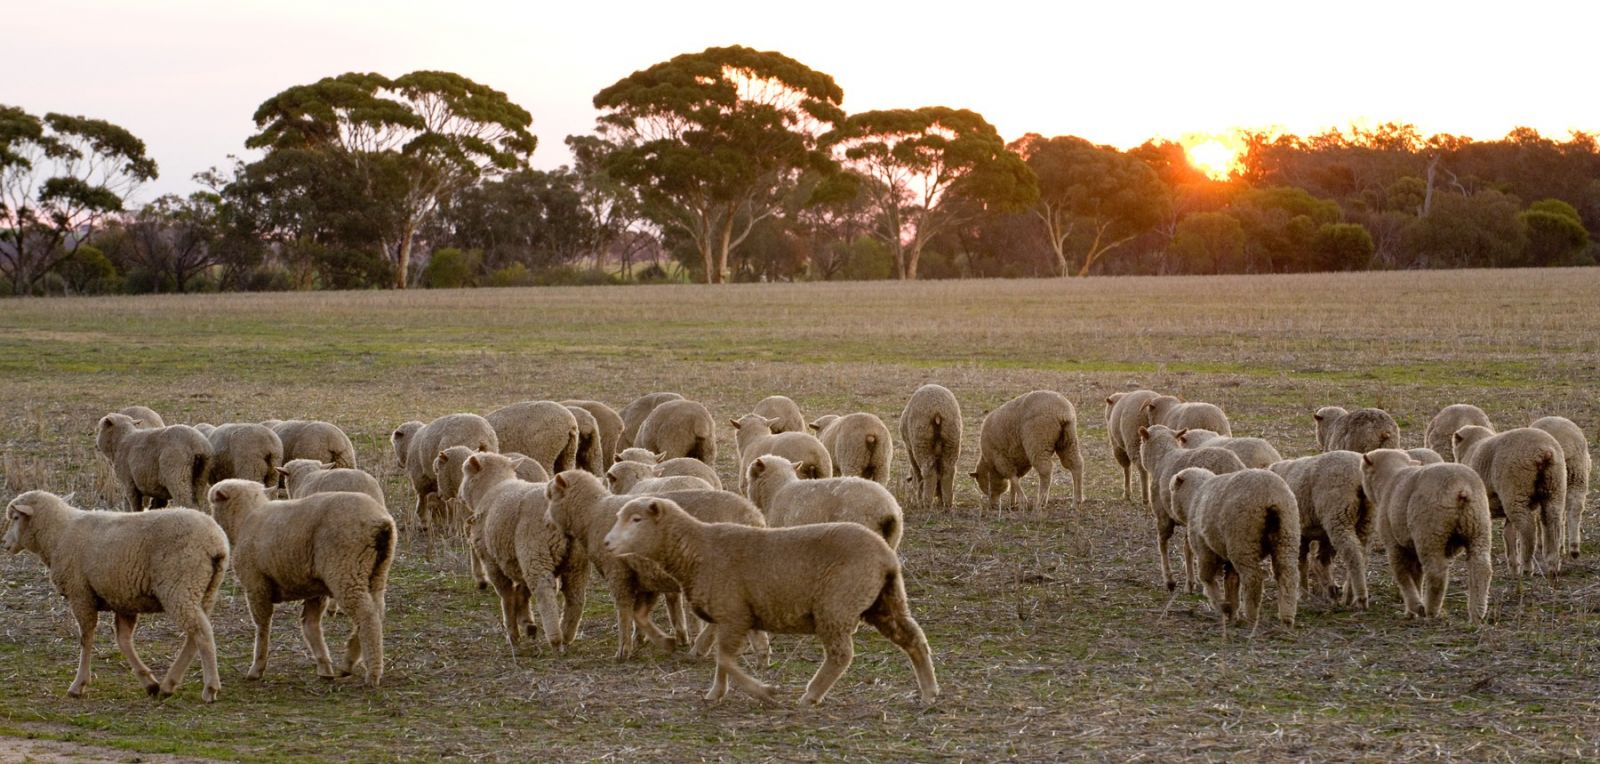
Lamb price goes up, more lambs come to the market, lamb price goes down. It’s a pretty simple equation but the trend remains up. For now. All sheep and lamb indicators felt the impact of stronger supply, except Merino lambs.
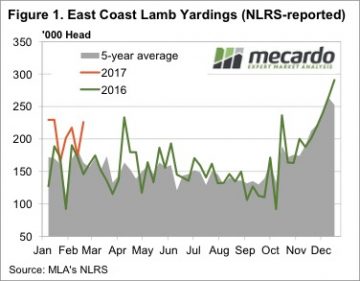 Just when we thought lamb supply was surely starting to wane, this week saw east coast yardings jump to their second highest level for the year. Figure 1 shows east coast lamb yardings, which were 55% stronger than the same time week last year.
Lamb slaughter remains weak, with yardings reportedly getting higher numbers of light and store lambs, which are hitting the market due to record prices.
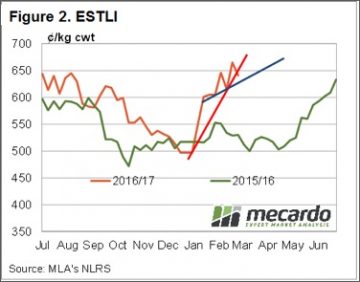
The impact of the 30% weekly jump in yardings was a relatively gentle fall in price. The Eastern States Trade Lamb Indicator (ESTLI) eased 24¢ this week on the back of stronger yardings. Figure 2 shows some basic trendlines for the ESTLI, with the current price sitting right on the very steep upward trend from the end of December, but still above the January upward trend.
Merino lambs avoided the fall this week, as they haven’t quite had the same rally as trade lambs. Interestingly Merino lambs in Victoria and NSW are just above 600¢, while in South Australia, Merino lambs fell 25¢ to 535¢/kg cwt. It was worth making the trip to SA to buy Merino lambs this week.
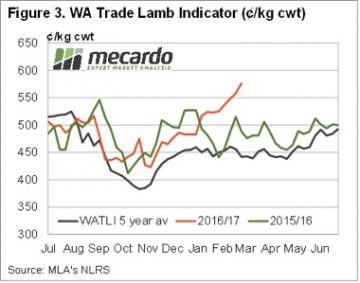
 In WA lamb prices defied the larger yardings, rising 18¢ to 576¢/kg cwt. The WATLI is showing an impressive upward trend, and has hit a 2.5 year high (figure 3).
The week ahead
The good thing about rising prices in WA is that shows that export demand seems to be strong. Supply is tight on the east coast, but not that much tighter than last year that you expect prices to be 100¢ higher. This also suggests that lamb demand is robust. Given the price of the main competing red meat, beef, it’s should come as no surprise that lamb prices have risen relative to last year.
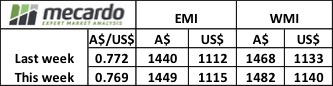 The EMI was up A$0.09, while in US$ terms it improved 3 cents with the Au$ quoted slightly lower for the week. Cardings continue to out-perform, with all 3 selling centres reporting strong increases and the relative Cardings indicators all nudging 1200 cents. (Fig 1.) Note that before 2011 the Cardings indicator rarely bobbed above 600 cents.
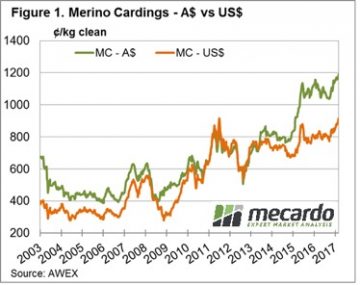 Two points regarding clip preparation are worth noting as the wool market dynamics continue to evolve. These points are at the extreme ends of the micron spectrum with change noted in the fine & superfine market as well as the X Bred market.
 This week Riemann traded solid volumes, with a spread of trades across the 18.5, 19 and 21 MPG types, and for settlements from March 2017 out to July 2018. Price levels were seen as attractive to growers looking to capture some of the market momentum for future clips.
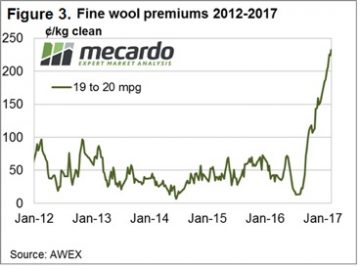

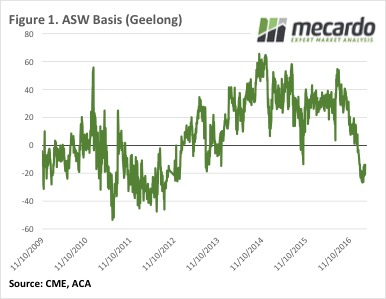 Most of the talk this week has been around ASW, especially in Victoria. With the Shipping Stems showing multiple boats are coming into Melbourne, Geelong and Portland over the coming month, looking for wheat, buyers are having to lift prices to secure supplies.
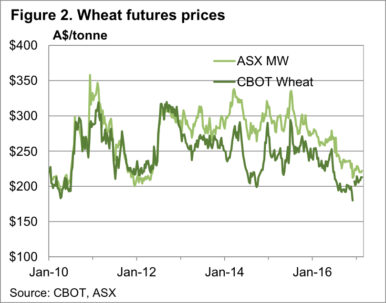 Plenty of ASW has been bought on CLEAR Grain Exchange, and direct through brokers at around $200/t Port in Geelong and Portland. Port Adelaide has seen action on ASW between $190 and $200/t. In the Melbourne Port Zone ASW had been up to $205/t.
 It remains a bit confounding that the supply dearth is concentrated in the southern states, given that the herd liquidation, and subsequent rebuild, should be concentrated in the north.
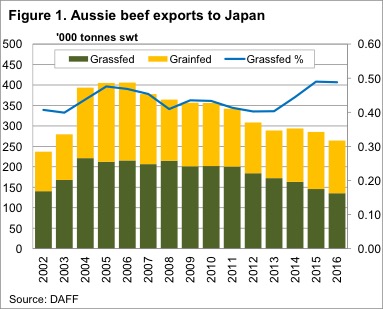 Prices for beef exported to Japan has been easing of late, which is a bit of a concern, given Japan is our major high value export market. With Japanese beef export prices sitting on a key support level, we take a look at what might happen to markets if prices break lower.
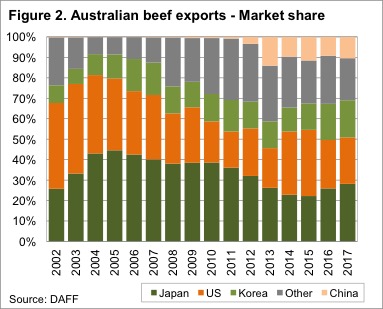 Australian beef has also found markets other than Japan, where the value is similar. The ‘other’ markets, mainly South East Asian Countries, and China, have increased their share of Australian beef exports to 31% in 2016, up from 12% in 2007 (figure 2).
 Figure 3 shows the price of Grassfed Fullsets exported to Japan, along with the 90CL Frozen Cow exported to the US, and the monthly average National Heavy Steer Indicator. Since November the Grassfed Fullset has fallen nearly 9%.
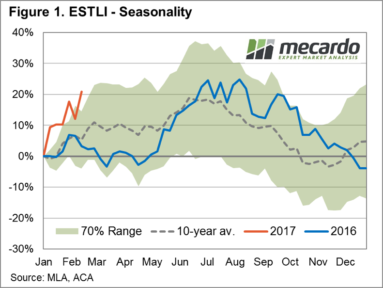 A firm recovery in price across all east coast categories of lamb and mutton reflecting the underlying tight supply anticipated this season to see the Eastern States Trade Lamb Indicator (ESTLI) surge to fresh highs, closing at 664¢/kg cwt yesterday – a gain on the week of 7.4%.
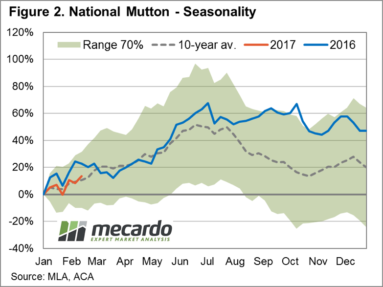 East coast mutton also enjoying some upward momentum on the week, reflective of the trade and heavy lamb gains, to see it rise 7.5% to 441¢/kg cwt. Figure 2 showing the seasonal percentage gains for mutton so far this year respectably tracking along the ten-year average pattern. Although the price pattern for mutton not as robust when compared to the ESTLI performance and the pattern set by mutton during the 2016 season.
 To read more about the expected tight supply during 2017 and our ESTLI forecast released in December 2016 click
 AWEX report a “good solid market over three selling days”; again it was the fine wool leading higher while the rest of the market held firm. Crossbreds also finally found some support and reversed their long downward spiral to see the 28 MPG improve by 19 cents.
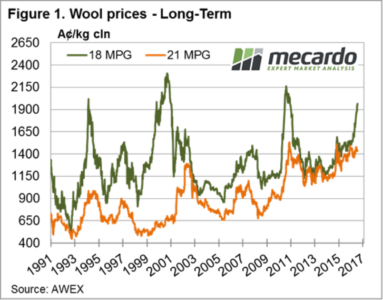 While 47,000 bales were originally listed, only 45,400 bales were eventually offered with 41,500 sold into a market resulting in a 7.6% Passed In rate. The PI rate was skewed somewhat with growers in Fremantle passing 13.5%.
 As
As 
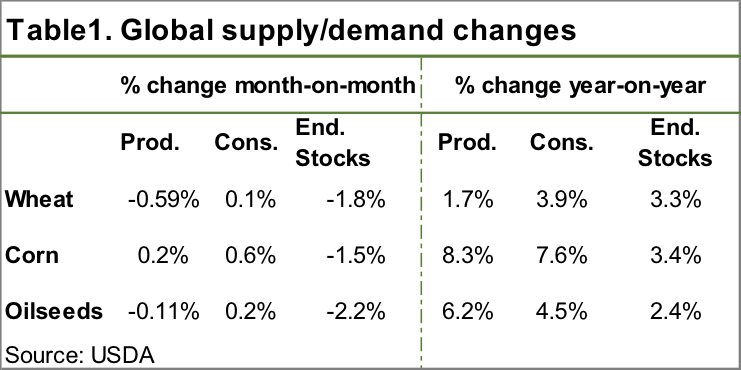 World wheat production was cut by 4.4mmt this month, largely thanks to a downgrade in India. The United States Department of Agriculture (USDA) are still saying 2016-17 will be the biggest crop on record. However, a small increase in consumption (Table 1) and a decrease in ending stocks saw the stocks to use ratio decline from 34.2% to 33.5%. Sounds small, but as shown in figure 2, the stock to use for 16/17 is now smaller than last year.
 In theory, a smaller stocks to use ratio should mean higher prices than last year. This had funds jumping out of wheat last night, pushing the CBOT spot contract to a 7 month high of 442¢/bu (figure 3). Still a long way from the 500¢ of February 2016.
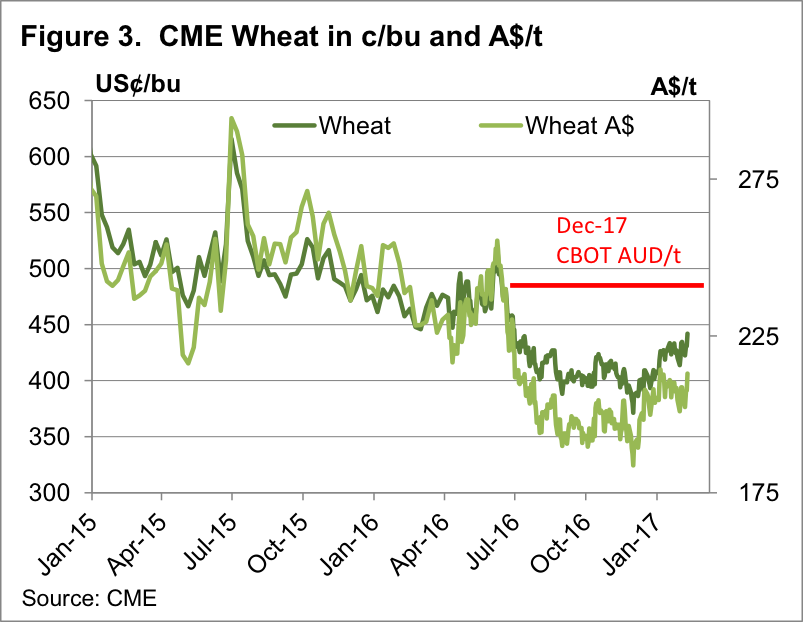 In our terms the stronger AUD sees prices just below the 7 month highs hit in January, with the spot contract at $213/t, up $5 for the week, and Dec-17 at $238/t, shown by the red line on figure 3. There is full carry into Dec-17, and those concerned about prices ticking along at current levels for another year might be tempted to sell a bit at these levels.
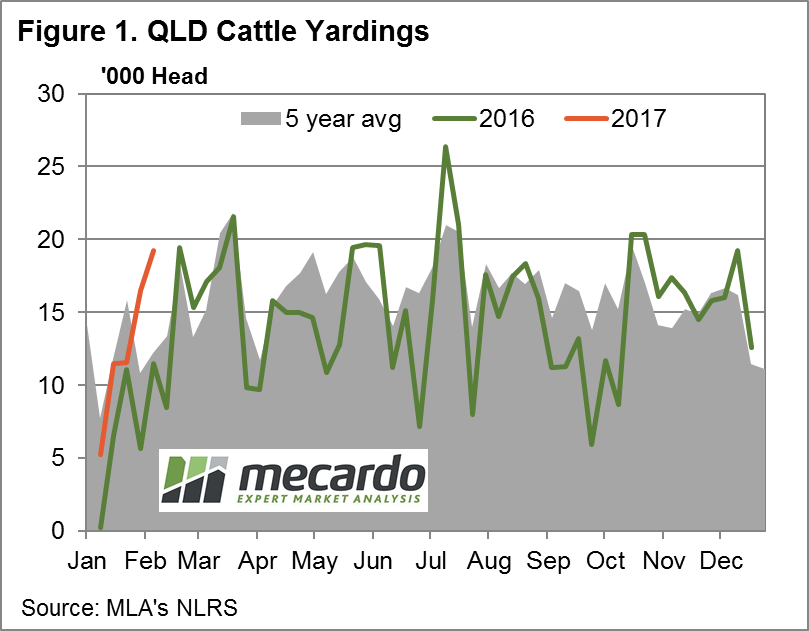 Surging weekly Queensland throughput and above average NSW throughput weighed on cattle prices in these regions dragging down the east coast figures this week with the Eastern Young Cattle Indicator (EYCI) dropping to levels not seen since the start of the season.
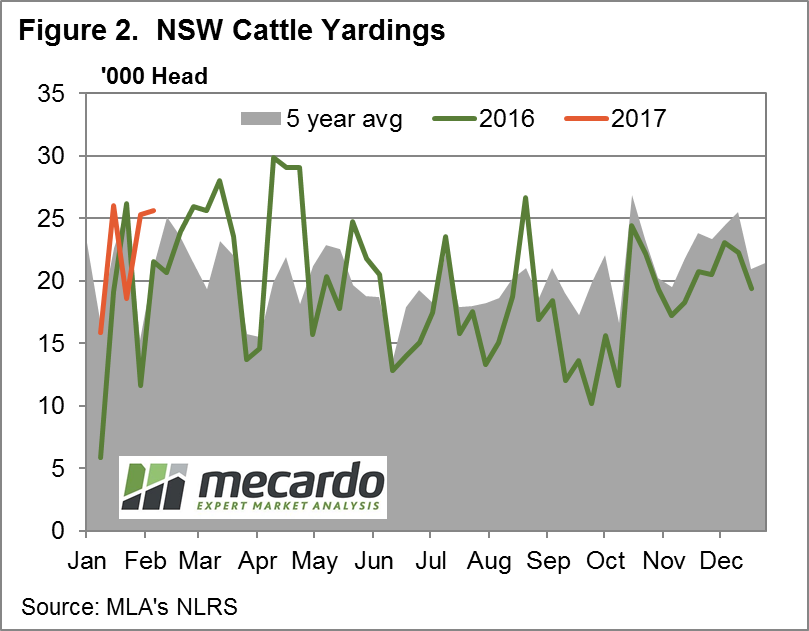 NSW experiencing price declines in all NLRS saleyard categories, apart from Medium and Heavy Steers, with Trade Steers headlining with the biggest percentage decrease, down 6% to 332¢/kg lwt with elevated NSW throughput appearing to contributing to the price pressure – figure 2.
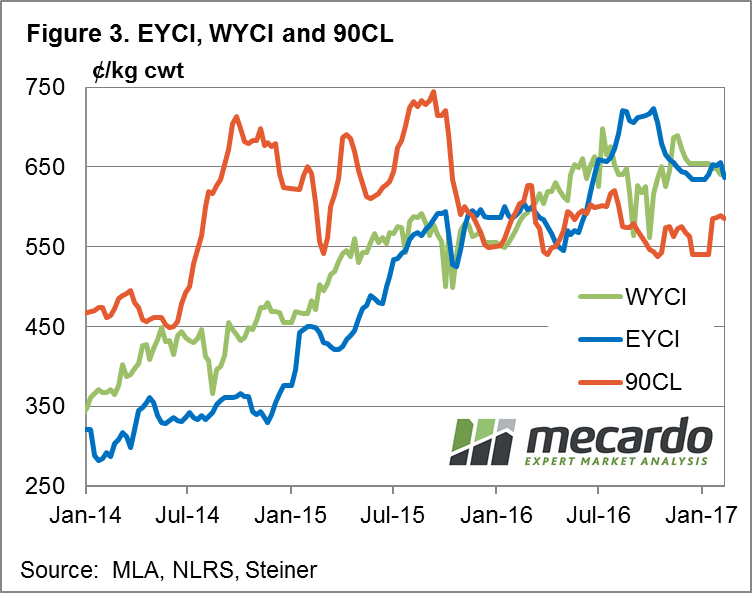 Register
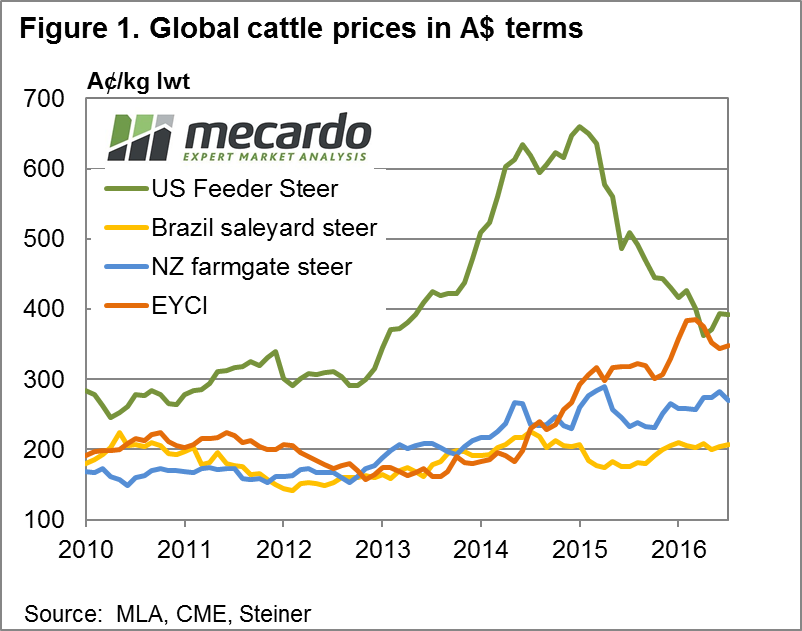 Often at Mecardo we look at local and global cattle price relationships in US$ terms as the US cattle market is one of the key drivers of Australian cattle prices over the longer term. However, in this analysis we flip the magnifying glass to take a look at global prices in our terms.
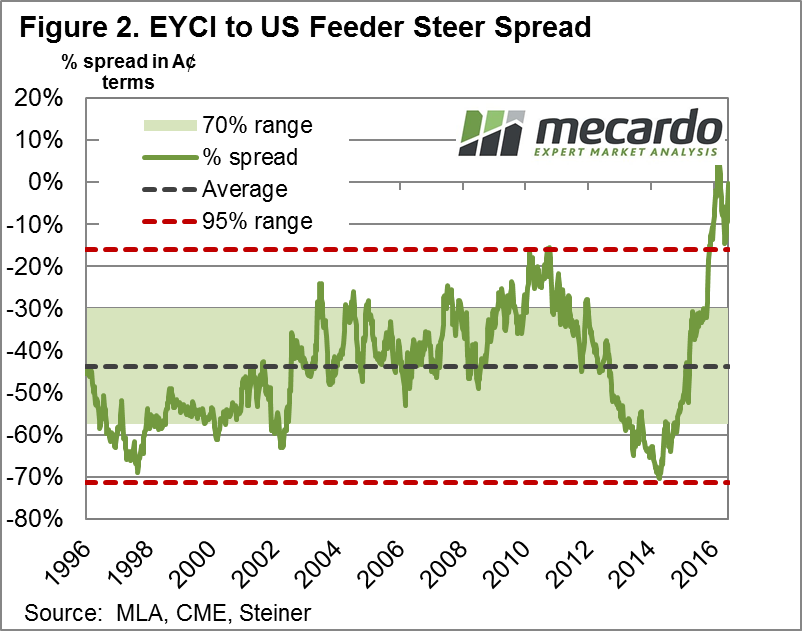 Taking a look at the correlation between US Feeder Steers and the EYCI we can see a moderately strong relationship between the two series when looking at annual average prices expressed in A$ terms – figure 3. Although,
 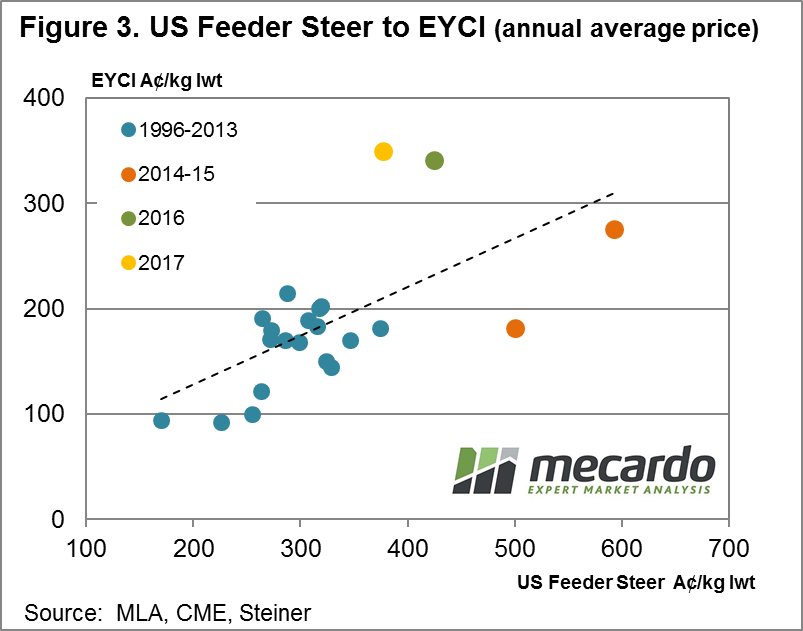 The lift in US prices since October has taken some of the downward pressure off local prices. Although from a longer term historical perspective local prices remain in overvalued territory and have not been helped by a stronger A$ during January.