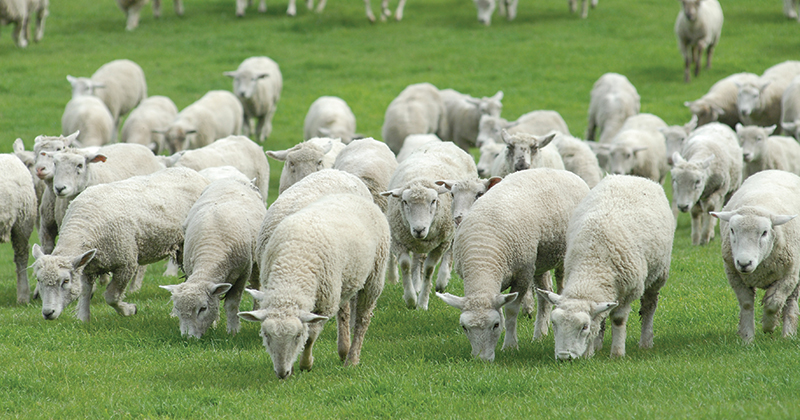
The 2016-17 season saw a change in the air drive a change in the paddock for wool production, but how did this impact the market? While winter is here and the recess lingers for the wool market, our season recap continues – this time hitting rewind to look at the prices.
 Considering the finale is always the main event, we’ve focused this market review on the last week of the season (July 10th 2017). Table 1 compares the average market price for the last week of the 2016-17 year for Northern, Southern and Western market regions to that of the previous year. The closing market clearly favoured the fine microns this year with a price jump at an average of 34% across the 16.5 to 19 micron range for the Eastern markets and 24% for the West.
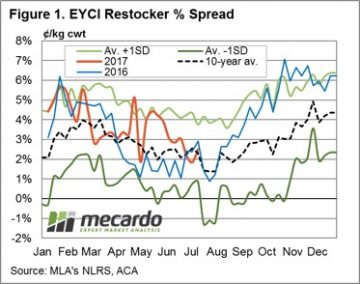
As outlined in our earlier analysis review, when the season in 2016/17 transitioned from the considerably dry conditions maintained over previous years towards wet, we saw the average micron broaden across the Australian flock. This shift in the clip lent to a return to premiums for fine fibres as supply thinned across the year (Figure 1). Improved seasonal conditions also returned a good market price across the country for the mid fibres of 19.5 to 24 MPG. Looking at Table 1, we can see that the market prices were much more favourable for all three regions this year round, boasting an average increase of 8% from 2015/16 to 2016/17.
As expected, the overall production lift in 2017 coupled with recorded increase in fibre diameter across all states but NSW, meant that supply of coarse wools was a plenty and hence didn’t quite see the gains received by the rest of the market. Southern region prices for coarse fibres finished 12% lower than the same time last year, while the North saw a slight rise of 2%.
 By comparison, the mid and coarse fibre market on the West Coast remained fairly stagnant, landing nearly right back where it ended 12 months ago. The market price was on average just 10c higher than last year for fibres above 19.5 micron.
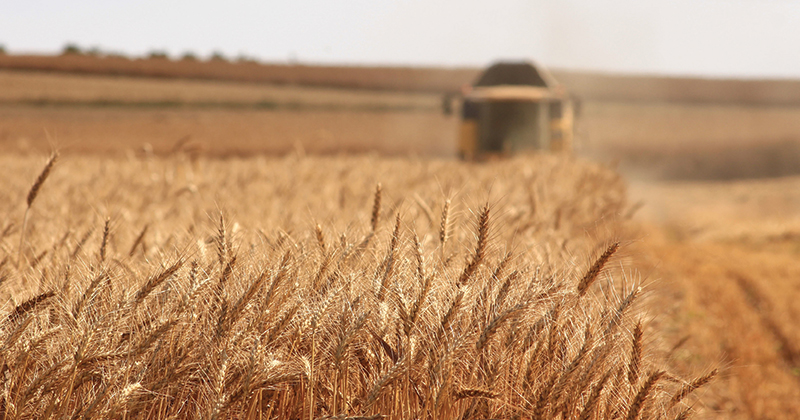
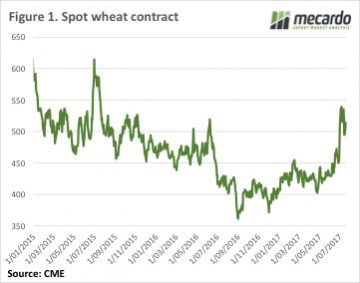 CBOT wheat prices managed to track sideways this week as the market digested the World Agricultural Supply and Demand (WASDE) report and weather outlooks improved. While the spot and Dec-17 CBOT wheat have fallen 50¢ from the peak, the Dec-18 contract is down 35¢. Dec-17 currently sits at 529¢/bu, with Dec-18 at 585¢ and full carry back in the market.
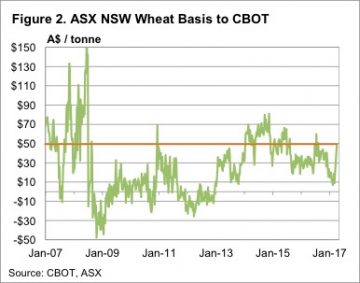 After also falling heavily last week, ICE Canola for Jan-18 has steadied at the $515CAD/t level. The Canadian dollar has matched the AUD increases, with the two currencies locked at parity, so swap prices remain around the $515/t value. With local port prices at $530-535/t, the basis value doesn’t look to be there, so swaps would be the way to go at the moment.
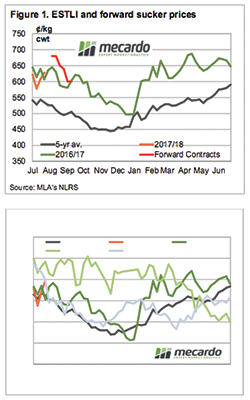
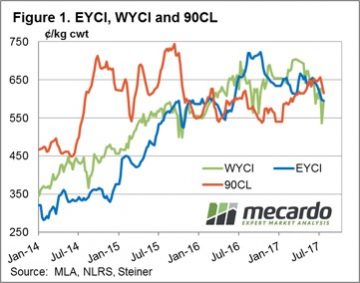 The 90CL frozen cow beef export indicator continued to slide this week, dragged down by a reduction in boxed beef forward sales in the US over the last few weeks. US meatworks report an 18% drop in forward bookings so have realigned their pricing to lower levels in order to attract additional forward sales interest. The 90CL settling 3.1% softer to close at 615¢/kg CIF – Figure 1.
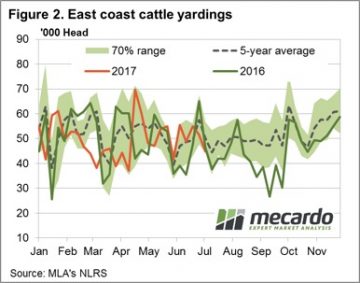 Despite the fall in the 90CL this week the indicator remains above the EYCI, combined with the steady decline in cattle yardings, this should start to add some support to cattle prices at the current level. Although, the rain forecast for next week shows limited falls to the southern tip of the nation so it’s unlikely that prices will get too much of a kick up. Consolidation at current levels seems the order of the day.
 When we set out to write this article, we thought it was going to be about how restocker demand was on the wane, and one of the reasons the cattle market was falling. While restockers are paying less, they are still buying plenty of cattle.
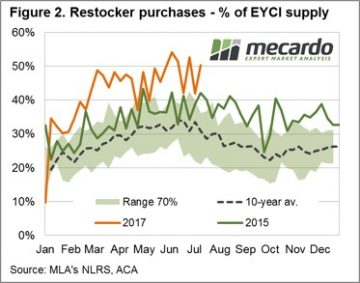 This is somewhat confirmed by the smaller fall in the price paid by feeders for EYCI cattle over the last six weeks. Figure 3 shows that feeders are paying 7% less than at the start of June, while restockers are down 10% and processors price have weakened 8%.
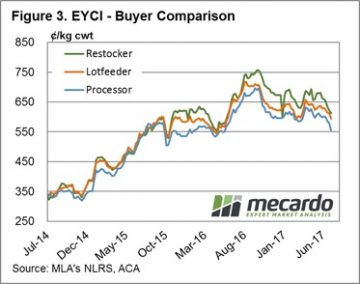 Stronger supply of light store cattle is not the only reason for the weaker EYCI, but it is contributing. For those lucky enough to have feed on hand, the fact the restocker cattle are now more in line with historical premiums to the EYCI means they are reasonable buying.
 The lamb price bounce continued this week despite a bit of a lift in yardings. The direct to works supply appears to have weakened, with plenty of competition back at the saleyards. All this despite the stronger Aussie dollar which is not doing great things for our export competitiveness.
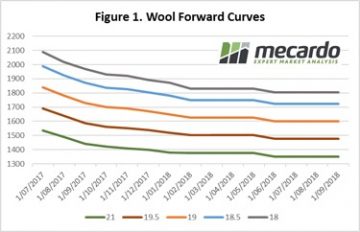

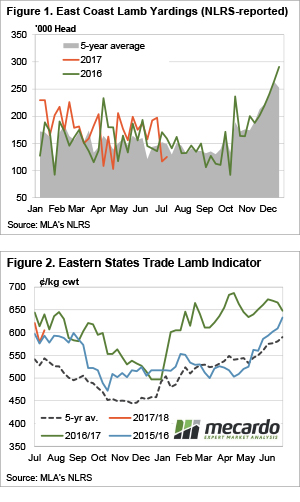 It’s nice to be right sometimes, even if it is only for a week. The weekly comment last week suggested the slide in lamb prices was about to halt, and halt it did. The market even bounced back above 600¢ as lamb and sheep yardings recorded another weak week.
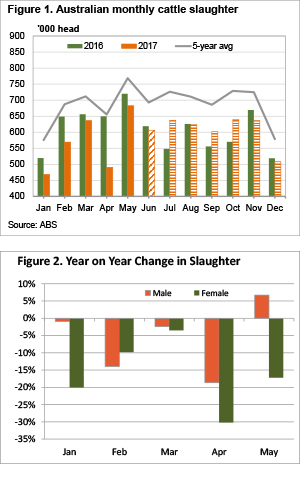 As we move past the half way mark of the year we can start to get an idea of how cattle supply is faring relative to industry forecasts. Those looking to sell cattle in the second half of the year will not only be hoping the weather does the right thing, but also that Meat and Livestock Australia’s (MLA) total cattle slaughter forecasts are an overestimate.
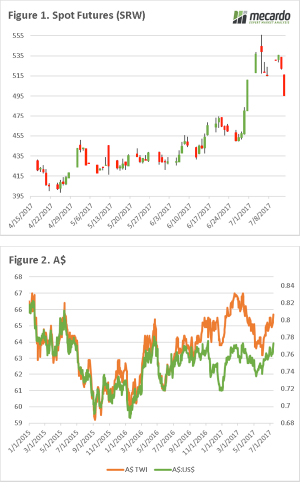 This week we saw the USDA release their July World Agricultural Supply and Demand estimates, the market has reacted to this news. In this update, we take a short look at Chicago futures & the dollar.
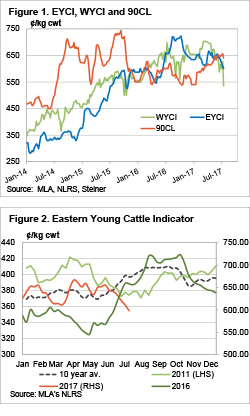 The Eastern Young Cattle Indicator (EYCI) fell for the sixth straight week, and took most other indicators with it. In the West prices tanked, but it might be an outlier. The story remains the same, with dry weather and relatively high prices encouraging offloading of stock.