Month: June 2019

What a difference a month made

What a difference a month made, seven hundred and thirty little hours. The market has turned 180° since this time last month. In this week’s comment, we take a look at what has caused this move.

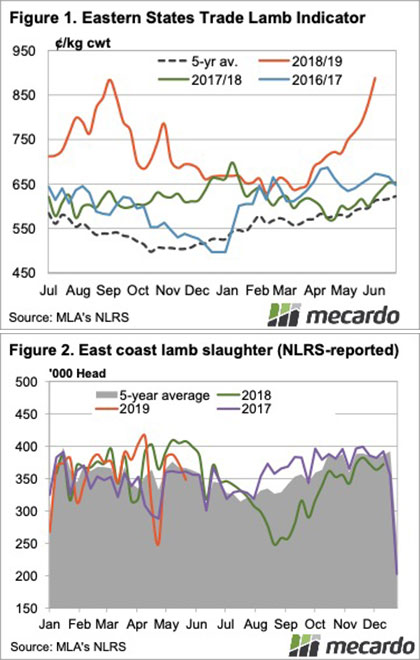
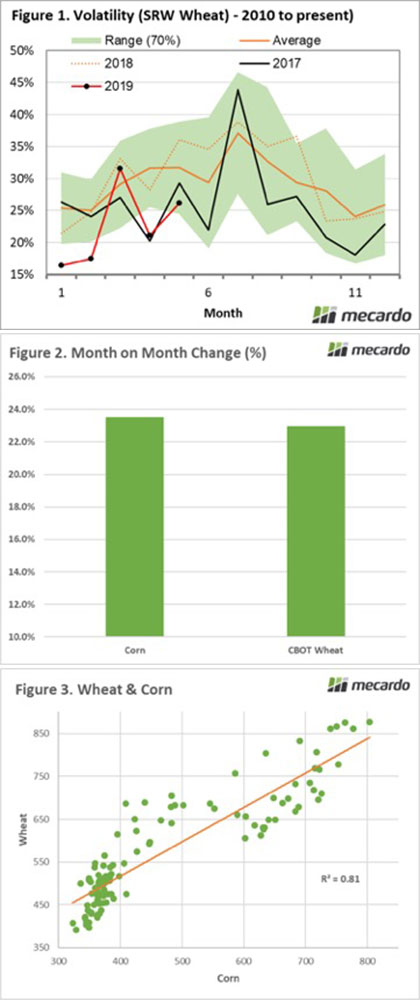
The market tends to be volatile towards the end of the second quarter of the year (Figure 1), and this year is no exception. At the start of May, the global environment had a bearish undertone. The USDA had forecast a year of ample production with most of the grain growing regions experiencing strong annual growth. This led to a projected production of 777mmt and end stocks of 293mmt, both record levels.

The picture with wheat is likely to change in June when the USDA releases their updated datasets, however not by much. So why is the wheat price globally jumping?

The US has received unprecedented rainfall during May, which has meant that areas forecast for corn are now more suited for trout. In the United States, producers are heavily reliant upon insurance. To comply with the insurance coverage there are set final planting days. If you plant beyond the date coverage is dropped by 1%.

Click below to see maps:

The impact has been dramatic, with corn and wheat prices on CBOT rising 23% (Figure 2). Although wheat production remains favourable the issues with corn have flowed through to wheat.

Agricultural commodities tend to have relationships with one another, as they are ultimately in groups of replaceable products. As an example, soybean and canola can be interchanged (to a certain extent). This is also the case with corn and wheat, which both have a high degree of relatedness.

This relationship can be seen in figure 3, which shows that as the price of either commodity rises the other will follow.

On our podcast, we had a chat with Brett Hosking, chair of Grain Growers. In this conversation, we discussed the opportunities for the grain industry over the next few years and the importation of wheat in Australia.
Click here

What does it mean/next week?:

The market will remain well supported in the coming weeks (and months) the nature of the rainfall events in the US will lead to a very sharp drop in expectations for the corn crop.

There are many who are considering that the rise in corn price will lead to farmers planting later and accepting a lower coverage. However, I don’t see this as likely as logistically it seems implausible for many farmers to be able to plant.

In Australia, expectations are also deteriorating with the outlook for rainfall not promising. Every week without decent rainfall will lead to an increase in basis levels.

It’s a record, and it’s only May

The rally in lamb prices is yet to slow, as you will have no doubt heard. The Eastern States Trade Lamb Indicator (ESTLI) hit a new record yesterday and it has come at least a month earlier than expected.

There are a lot of talking points this week, but the ESTLI breaking into new territory is a good place to start. With a 57¢ rally this week the ESTLI finished yesterday at 888¢/kg cwt. The previous record set last year was 884¢ on the 31st of August.

We talk about supply and demand, and all the pointers are that demand is much stronger. Figure 2 shows east coast lamb slaughter last week tipped just below the 2017 level. Prices back then were strong for the time, at 650¢/kg cwt (Figure 1).  With slaughter at the same levels last week, the price was 830¢. The same supply with prices 27% higher suggests much stronger demand.

Even when supply was at similar levels last year in early July, the ESTLI was only at 720¢. It seems likely that lamb supply will hit the doldrums seen last August, but it’s yet to be seen if prices can rise further.

Mutton also continued its record run, with the east coast indicator pulling up just 1¢ shy of 600¢/kg cwt. There were sheep quoted at over 700¢ at Wagga yesterday.

It was unusual to see SA with the most expensive lambs this week, trade lambs were just over 900¢.  By contrast, WA lambs are making 755¢. A 22kg lamb is $22 cheaper in the west, which is enough to see lambs cross the Nullabor.

What does it mean?:

The most common questions are ‘how high will it go?’ and ‘how long will it last?’  We know sheep and lamb supply isn’t going to improve until August at the earliest. New Zealand supply won’t improve until the end of the year, and goat prices are over $10.

Much depends on how much lamb importers will pay for lamb and mutton, as processors will keep killing as long as the losses don’t outweigh the cost of shutting down.

Cattle in a holding pattern

After a few weeks of yo-yoing movements for the Eastern Young Cattle Indicator (EYCI) prices have stabilised this week as east coast cattle supply measures have moved toward more normal seasonal levels.

The EYCI closed the week a mere 3¢ higher to see it finish at 471.75¢/kg cwt. The minor price adjustment over the week was mirrored across national cattle prices at the sale yard too with most categories posting mixed weekly moves within the 5¢-10¢ range – Figure 1.

Restocker Yearling Steers the best performer on the week gaining nearly 9¢ to finish at 258.7¢/kg lwt buoyed by increased optimism from southern restockers encouraged by decent rainfall across Victoria and southern NSW this week.

After a few months of wild swings in east coast cattle yardings recent levels have settled just below the five-year seasonal average for late May at around 55,000 head changing hands at the sale yard – Figure 2. The historic seasonal pattern for the next month indicates tighter conditions are likely to see weekly yarding move toward the 45,000 head level into June.

East coast weekly slaughter levels have been climbing steadily throughout May to see it a whisker above the five-year seasonal trend at 156,175 head – Figure 3.  This is the highest weekly slaughter recorded so far this season but as the long terms seasonal trend demonstrates we are only a few weeks away from the usually Winter dip in slaughter activity.

Next week

Fairly light rainfall is on the horizon for the coming week, with heavier falls centered close to the coastal fringe of Victoria and WA. The lack of rain for inland regions won’t lend support to cattle prices in the short term. However, if the slaughter and yarding trend follows the usual seasonal pattern lower into June the tighter supply may help to underpin prices.

In offshore markets the 90CL frozen cow indicator was a little softer this week but sitting at nearly 200¢ above the EYCI at 667¢/kg cwt it will continue to support local cattle prices on any dips too.

Wool buyers are back and busy

The wool market kicked back into gear this week as buying sentiment strengthened. A limited offering meant buyers were more aggressive with their purchasing to secure their requirement. All categories and microns felt the benefits. 

The Eastern Market Indicator (EMI) rose 54 cents on the week to close at 1,887 cents, nearly making up for last weeks 60 cent loss. There is still some way to go yet to climb back from the 3 consecutive weeks of a falling market.  The Au$ lifted this week to US $0.693 and as a result, the EMI in US$ terms rose by 46 cents to end the week at 1,307 US cents (Table 1).

The Western Market Indicator (WMI) gained 55 cents to 1,992 cents this week. Medium Merino wools attracted the most support. The largest increase being the 19 MPG in Melbourne lifting 80 cents.

Supply was again at low levels with the national offering of just 28,273 bales. With the market moving higher, growers were more content with their levels. The total pass in rate for the week was 8.4%, a dramatic drop from last weeks 28%. This meant 25,901 bales were cleared to the trade, which is in line with the volumes cleared this week of sale in 2018. In the auction weeks since the winter recess, 1,333,141 bales have been cleared to the trade, 252377 fewer than the same period last year.

The dollar value for the week was $50.69 million, much improved on last week. The combined value so far this season is $3.042 billion. A simple calculation of $ value divided by bales sold gives us $1,957 per bale across all types for the week.

Crossbred wools felt the results of strong demand, rising 45- 50 cents. Oddments also moved higher, with AWEX reporting that locks came under intense pressure as multiple exports competed for limited quantity which pushed prices up 30 – 40 cents.

The week ahead

Fremantle aren’t holding any sales next week, so the roster for Sydney and Melbourne is looking at a combined offering of just 23,619 bales. The following weeks 23,360 bales and 19,610 are currently forecast. While we usually see a dip in supply as we draw to the end of the selling season, this will add to what is already 12% less auction volumes this season to date compared to the same period in 2018/19.