Category: Cattle

There is no ho-hum in sorghum.

It’s been a while since we looked at the sorghum market, and its going gangbusters. A series of events have transpired to raise sorghum pricing levels for producers, although unfortunately for feed lotters this is raising their overall costs.
In the 2017/18 season, northern NSW and Queensland were impacted by very poor growing conditions, this obviously led to an overall decline in yields. The NNSW and QLD regions are dominated by the domestic market, with the bulk of the countries cattle feed lotters, and a high number of pig farms, in the region.

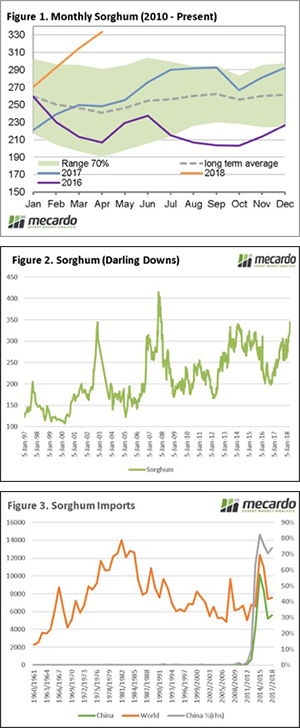
The drought has caused domestic buyers to pay up in order to compete against the export market resulting in ships of barley being sent from South Australia for feed purposes. In figure 1, the seasonality of sorghum on the Darling Downs is displayed. As we can see, the advance in sorghum pricing has been astronomic since September 2017. The current average price for April is $92/mt above average.

At this point of the year, the seasonal pattern is for a decline in prices from Jan-Apr as the summer crop is taken into account. This season has been very much against the mold. It is worthwhile examining how this compares against the long term.

In figure 2, the weekly price from 1997 to present is displayed. As we can see, the only years to achieve these current pricing levels were in 2002 and 2007. This coincided with major droughts, and also in 2007 the height of the commodities boom. There is no denying that these prices represent close to the best prices in twenty years.

The next factor, which is yet to play out, is China. In the past fortnight China concluded their investigations into allegations of sorghum dumping by the US. This has resulted in a required deposit of 178.6% of the shipment value. This has made US sorghum imports into China unviable, and ships in transit have been diverted to alternate destinations.

In figure 3, we can see the influence of China on the sorghum market. Prior to this decade, China barley rarely imported 1% of the global trade in sorghum. The past five years have seen them import on average 73% of the global trade!

If demand for sorghum continues in China, and high deposits remain in place for the US, then sorghum producers have some interesting times ahead of them.

What does it mean/next week?:

The sorghum market is being assisted by the lingering effects of the 2017/18 drought in NNSW & QLD, high levels of stock on feed & political tensions between the US and China.

Prices are currently at very high levels, but it remains to be seen how long they will continue their upward trajectory.

Key Points

  • The drought in 2017/18 is continuing to have an impact on prices of all cereals in NNSW/QLD.
  • A high number of cattle on feed in QLD, continues to provide strong demand for cereals.
  • Anti-dumping deposits by China are making US sorghum imports unviable.

Good timing for a short week.

With ANZAC day falling in the middle of the week, cattle supply was well down. Young Cattle yardings halved, and young cattle prices managed to remain steady. Other cattle categories followed a similar trend, as the market treads water waiting for rain.

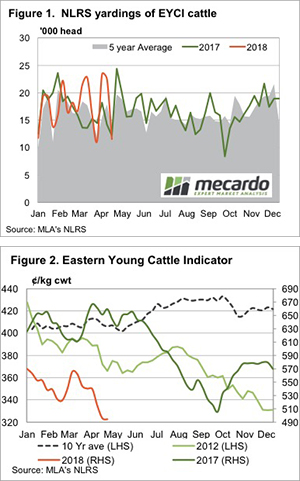
The Eastern Young Cattle Indicator (EYCI) managed to find some support this week on the back of much lower cattle yardings. The lack of sales on Wednesday obviously helped see yardings fall, but there was also a major pull back in supply as producers baulked at the lower prices.

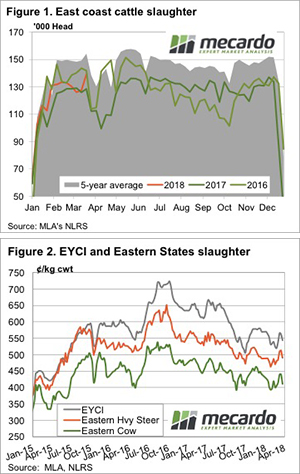
Figure 1 shows the yo-yo that has been EYCI yardings over recent weeks. It will be interesting to see where yardings head when we get back to a full week and with persistent low prices.

The EYCI did manage to steady however, with young cattle prices in Queensland, Victoria and NSW all managing to hold their levels at just under 500¢/kg cwt for the 270-290¢/kg liveweight range.

A few anecdotes we heard this week suggest light and restocker cattle might have found a base. There have been a few big yardings around, and prices managed to move higher as many backgrounders have decided they are cheap enough to take a punt on some rain arriving soon.

There is little doubt we will see a price rise when it does rain, but the trend in 2012 (figure 2) is looking eerily similar to current price moves. The market was then coming off record highs, similar to what we have seen recently. A lack of spring rain obviously helped the end of year fall.

The week ahead

So we wait another week for some rain to appear on the forecast. The longer we wait the more pressure comes on prices as potential autumn growth declines. It’s only five weeks until winter. Export prices have declined, but this doesn’t eliminate upside, with the 90CL still north of 550¢, which is a price many growers would take for their cattle at the moment.

A sea of red as EYCI dips under 500¢.

A glance at the weekly cattle price changes are an uncomfortable sight both domestically and in key offshore markets. Local prices are under pressure from the weight of throughput, particularly out of NSW and Queensland, while the 90CL beef export price to the US succumbed to concerns of high supply.

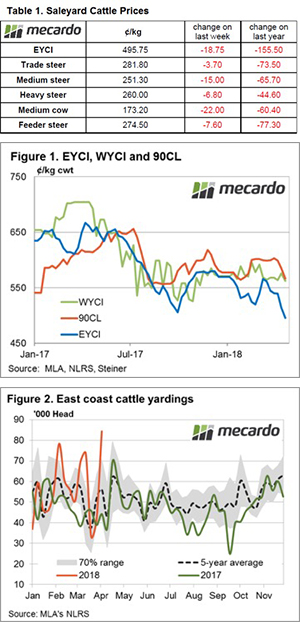
Table 1 highlights the weekly movement of East coast domestic cattle prices along with a measure of the movement from last season’s price levels. The Eastern Young Cattle Indicator (EYCI) is off 3.7% to 495.7¢/kg cwt, as a lacklustre start to the Autumn break forces producers to bring forward stock to market.

The EYCI moves were mirrored in all other cattle categories, although Trade and Heavy Steers are holding up reasonably well in comparison to other classes with declines of only 1.3% (281¢/kg lwt) and 2.6% (260¢/kg lwt), respectively.  Medium cow, the worst effected on the week, had a 12.7% drop to finish at 173¢/kg lwt.

The Western Young Cattle Indicator(WYCI) is also matching the trend with a 2.4% fall to close at 562¢/kg cwt. In offshore markets, the 90CL frozen cow appears to be reacting to concerns over anticipated high fed cattle slaughter levels in the US over April driving it to drop 3.2% to 566.5¢/kg CIF – Figure 1.

Increased cattle throughput was noted across all states this week. The big increases were particularly evident in NSW and Queensland when compared to their respective five-year seasonal average levels. Current NSW throughput is 73% higher than the seasonal pattern, QLD is at 67% higher and WA is sitting 43% above. In contrast, Victoria and South Australian cattle throughput only marginally over their five-year seasonal pattern at 1.4% and 1.2%, respectively.

The impact of the high NSW and Queensland throughput is evident in the broader East coast yarding levels with the 84,395 head sitting 50% higher than the seasonal five-year pattern for this time in the year – Figure 3.

What does it mean/next week?’

Apart from the coastal extremities of NSW and Southern Queensland, there is not much rainfall on the horizon for the week ahead for much of the nation. Cattle prices are likely to remain under pressure while the Autumn break in the South remains elusive.

The 90CL is approaching key support at the 550¢ region so may fortify local young cattle prices if it can hold this level. a .

No news is good news.

At a time when the live sheep export trade is making headlines for all the wrong reasons the big brother of the industry is quietly getting on with the job. Live cattle exports make up the lion’s share of the total trade out of Australia, with the combined beef and dairy trade representing 1.5 billion of the 1.8 billion annual farm gate returns. This piece takes a quick look at how the key markets are faring so far this season.
A look at the current seasonal pattern shows that total live cattle exports for the first quarter of 2018 have pretty much been on the five-year average trend after a slow start in January – Figure 1. Average monthly trade volumes across the first quarter of 2018 sit just 5% below the five-year first quarter average, but is 14% higher than the average monthly volumes set during the first quarter of 2017.

The trade to Indonesia dominates the market share and it is currently sitting at 50% of the 2018 total live export volumes. This is despite the first quarter of the season averaging 3% below the five-year seasonal pattern at around 36,000 head per month – Figure 2.

The flow of live cattle to China has been more erratic than the Indonesian experience so far this year. After an average start to 2018, February saw nothing delivered and then March followed up with the biggest monthly figure reported since the middle of 2015 at just under 16,000 head – Figure 3. Indeed, this is the largest March flow on record from Australia to China and represents a 175% increase on the five-year average pattern for March.

Average monthly consignments to China for the first quarter of 2018 are running 19% above the seasonal five-year trend and sit 3.5% higher than during 2017, a good sign of continued growth in the demand from China – which currently comprises about 9% of the market share of the trade out of Australia.

Vietnam holds the second spot in terms of market share of Australian live cattle exports, with the percentage of the trade so far this season sitting at around 18% of total flows. The first quarter of 2018 has begun in a reasonably solid fashion with average monthly volumes over the period sitting 61% above the five-year seasonal pattern monthly average levels – Figure 3.

What does it mean?  

Seasonal movements of total live cattle flows show that during April and December there is often a peak in trade volumes as consignments to Indonesia commonly increase during this time.  Domestic cattle prices are broadly softer and the Australian dollar has been trending lower since the January 2018 peak above 81US¢, which should assist the competitiveness of live cattle into the peak part of the season.

Combined with the strong start to the year out of Vietnam and China, it is something positive to look forward to for live export participants enduring a bit of a delicate time at the moment.

It’s a buy opportunity if you’ve got feed.

The Eastern Young Cattle Indicator’s (EYCI) decline continued this week. We’re not seeing finished cattle prices being dragged lower, especially not in the south, as the supply of slaughter ready cattle is weakening due to the dry. It’s not great for young cattle producers, but good news for traders.

The EYCI eased another 25¢ this week, heading back through support at the 514.50¢/kg cwt level. No doubt the fact that there has been no real rain in April, in addition to the usual increase in young cattle supply in Northern NSW, is helping drive the EYCI lower.
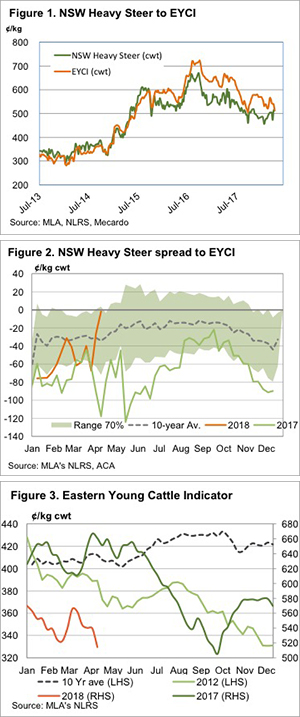
Heavy cattle prices remain relatively strong however. The NSW Heavy Steer Indicator (figure 1) is actually sitting close to a nine-month high, at 512¢/kg cwt. The 2¢ discount for the Heavy Steer is as close as it’s been to the EYCI since spring 2015.

A relatively small spread between finished cattle and young cattle is not unusual for this time of year, but it’s not something we’ve seen during the herd rebuild. It suggests the young cattle supply is approaching normal, but the tight spread is obviously partly driven by the dry summer in NSW, Victoria and South Australia.

The bad news for cattle producers is that seasonality suggests that continued dry conditions are likely to see young cattle prices continue to fall. Figure 3 shows that the fall usually runs until at least May, and this could see the EYCI below 500¢ for the first time since the first half of 2015.

The week ahead

There’s not a lot of precipitation on the forecast, so we might see young cattle prices continue to ease next week.

There is opportunity for restockers to buy at close to 3 year low prices, and the fact that heavy cattle values are holding strong gives an indication that the finished cattle market might find support, making a good trade.

Easter lull hits supply.

A short week due to the Easter break has taken its toll on cattle supply with yarding levels and slaughter reflecting the holiday break. Saleyards reported some higher steer prices on the back of the reduced supply, but most other cattle categories trekked sideways in the reduced trade environment.

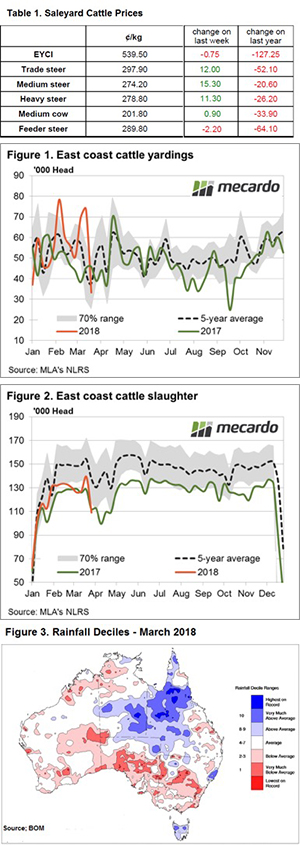
Table 1 outlines some price movements on the week for key categories of cattle at East coast sale yards. The benchmark EYCI was only marginally lower, closing at 539.50¢/kg cwt yesterday. Trade (298¢), Medium (274¢) and Heavy Steers (279¢) all managed 10-15¢ gains on live weight prices, while Feeder Steers lost a little ground off 2¢ to close at 289.8¢/kg lwt.

Figure 1 shows that East coast cattle throughput is back within the normal seasonal range, after posting elevated levels over the past fortnight and is now trending slightly below average at around 33,000 head. The recent volatility noted in East coast yarding levels have been mainly QLD centric with northern producers responding to monsoonal climate variability.

The East coast slaughter pattern is also reflecting the Easter inspired lull in activity and is demonstrating a similar pattern to yarding levels with a higher than 2017 pre-Easter slaughter now back under the 2017 levels this week. A 109,000-head cull was reported for the week ending 30th March – Figure 2.

In off shore markets, the 90CL frozen cow indicator continues to consolidate around 600¢/kg CIF and has been holding firm at this level for the last two months. The usual seasonal pattern for 90CL is for an increase in prices as we head toward the US grilling season with a few more burgers flipped onto the BBQ.

What does it mean/next week?’

The April Bureau of Meteorology forecast suggests average rainfall across the eastern seaboard for the month, although not much is anticipated to fall in the coming week in the South as a blocking high pressure system is keeping it clear and sunny.

Dry rainfall deciles for March across much of NSW and SA demonstrate just how some parts of the country are in need of the Autumn break and the dry conditions have been keeping prices subdued in some areas – Figure 3.

Prices are likely to keep in a consolidation phase in the coming week, with a slight downside bias as the delayed start to the break applies some pressure – all eyes are on the sky for some rainfall and some price support as we head towards Winter.

Cattle supply is up and so is demand it seems.

Just when you thought the rain in Queensland was starting to tighten supply, we get a week like this. Cattle slaughter was higher everywhere, and this pushed east coast slaughter to 20 month highs. The stronger supply, and limited demand for the coming week, saw prices ease.

Figure 1 shows the massive jump in east coast cattle slaughter last week with 9% more cattle processed than the previousweek, and 4.3% more than the 2018 high. In fact, we haven’t seen this many cattle slaughtered in a week since June 2016.
While Queensland did have its highest slaughter week for this year, it has been higher in the last 12 months. It’s the drier states of Victoria and NSW which are driving the increase, having slaughtered 21% and 8.5% more than last year to date respectively.

Figure 2 shows the stalling rally in the Eastern Young Cattle Indicator (EYCI) and heavy steers and cows. The stronger supply has seen prices ease, but demand must be a bit stronger, as prices haven’t fallen back below February levels – yet.

In WA, young cattle prices rallied, moving 17¢ higher to 578¢/kg cwt, a one month high. Over the hooks prices remained steady in the West, as they tend to do. Currently sitting at 500-510¢ for yearlings, and 540¢ for MSA yearlings.

In the export market, the 90CL indicator remains remarkably steady. This week the US price lost a cent, but the lower Aussie dollar saw the 90CL in our terms creep 4¢ higher to 603¢/kg cwt.

The week ahead

Autumn is usually the time for peak cattle slaughter, but we weren’t expecting it this year. An autumn break in Victoria and NSW should tighten supply post Easter, but there isn’t anything on the forecast.

The good news is demand seems to be partly driving the increased slaughter, with more space being made available. If supply does tighten, stronger demand bodes well for the winter price rise that we normally see, but was absent in 2017.

US cattle cycle outlook – revised

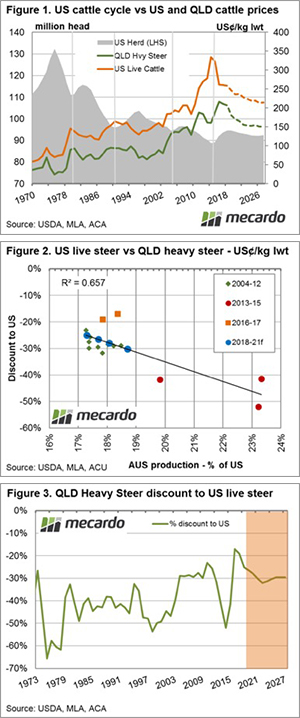
The United States Department of Agriculture (USDA) have released their updated long-term projections for key agricultural markets and they contained some adjustment to forecast herd growth, production and cattle price forecasts. This article takes a look at what these revisions mean for cattle prices and spread relationships between the US and Australia in the coming years.  

The US are a few years ahead of Australia in their herd rebuild phase and the updated USDA forecasts show that the US herd is anticipated to peak during the 2018/19 season at 94.5 million head. Revisions to the herd size beyond 2020 now show the USDA expecting a gradual liquidation as we head toward the 2025/26 season.

Figure 1 outlines the US cattle cycles back to the 1970s along with the impact changes to the herd size has had on US cattle prices. Often the peak in the herd size during the cycle corresponds with a trough in the price cycle. The chart also highlights the broad similarity in price behaviour over the longer term between the US Live Cattle price and the Queensland Heavy Steer price. Notably in the recent USDA release cattle price forecasts have been revised down by 7.5% over the 2020 to 2026 period.

Analysis of the relationship between the Australian to US production ratio and the annual average price spread between US live cattle prices and the Queensland Heavy Steer shows a moderately strong interdependence – figure 2.

During times of drought in Australia, like in the 2013-2015 period, the production ratio increased as our turnoff levels increased and placed pressure on the spread discount between US and local cattle prices to see it widen beyond 50%. Conversely, as our climate turned more favourable into 2016-17, and the herd rebuild began, the production ratio contracted and the discount narrowed to just under 20%.

Figure 3 highlights the historic pattern for the spread discount between US live cattle and the Queensland Heavy Steer. Using the production ratio estimates based off the USDA and MLA production forecasts we can see that the spread is anticipated to widen as the production ratio increases as we head toward the end of the decade.

What does it mean?  

The discount annual average spread between US live cattle and the Queensland Heavy Steer is set to move toward 30% by 2020. However, the production ratio estimates assume average seasonal conditions. As highlighted by the dip in the spread during the 2013-15 drought inspired turnoff a return to harsh seasonal conditions will see the spread come under further pressure.

After the Easter break we will run the adjusted USDA numbers through the Mecardo EYCI forecast model to see what the changes to long term forecasts for price and supply mean for local young cattle prices out to 2020 – stay tuned.

Key points:

  • The USDA have revised their projections for the US herd size, pointing to a peak in the heard of 94.5 million head during the 2018/19 season.
  • US Live cattle price forecasts beyond 2020 have been revised down by 7.5%
  • Production ratios between the US and Australia signal a widening of the discount spread between US and local prices toward 30% as we head to the end of the decade.

Prices succumb to higher throughput.

A jump in throughput across the Eastern seaboard, particularly in NSW and Queensland, puts the heat on cattle prices this week with the Eastern Young Cattle Indicator (EYCI) shedding 3% to finish trading yesterday at 544¢/kg cwt.  

Losses were noted across the board for most cattle specifications, with only East coast trade steers managing to hold their ground, trekking sideways to remain above 300¢/kg lwt. Medium cows taking the biggest hit with an 8% drop to close at 195.3¢/kg lwt – Table 1.

Figure 1 gives a clue to the pressure behind the price weakness – a 37 % lift in cattle throughput along the East coast to see 69,515 head yarded. This reflects a level 22% higher than the seasonal average pattern for this time of the year and extends above the usual range that could be expected given the historic variation in the series, as shown by the yardings pattern breaking outside the top of the grey 70% band. The primary catalysts for the lift in East coast throughput were increases on the week in NSW and Queensland yarding levels of 38% and 87%, respectively.

In the West cattle yardings trended sideways, although this week’s yarding of just over 3,000 head sits 16.5% lower than the average weekly yarding seen in WA since the start of the season. Throughout of young cattle in WA also remained subdued, easing 10% to 1,245 head and the lighter numbers here managed to help the Western Young Cattle Indicator (WYCI) hold its ground at 568.25¢/kg cwt. Offshore markets for 90CL grinding beef continue to maintain a stable footing with the sixth straight week remaining firm near the 600¢ level – Figure 2

What does it mean/next week?:

Its hard to see East coast throughput sitting this elevated for too long and the prospect of the looming Easter break along with the northern rains due, courtesy of Cyclone Nora, will see supply tighten temporarily in any event – which should give some support to prices.

Although, some meat works may take the opportunity to close for maintenance or reduce capacity during the holiday lull so processor buyers may not be as active, impacting demand in the short term. On balance we’re probably looking at some sideways price consolidation as we head to the Easter break.