 Last week we spent a couple of articles looking at the interesting price phenomenon that we are currently seeing in lamb markets. Strong prices continued last week, in the face of strong supplies, so today we take a look at the export data to see where the extra lamb is going.
Meat & Livestock Australia seem to be having some issues getting slaughter data out of some NSW and Queensland plants, and as such we are currently being denied total weekly slaughter data. We do know, however, from what we can see in Victoria and SA, and saleyard yardings, is that supply remains stronger than last year.
Prices remain around 600¢ for lambs, which is similar to last year, but it was this week in 2016 that prices started their seasonal dive.
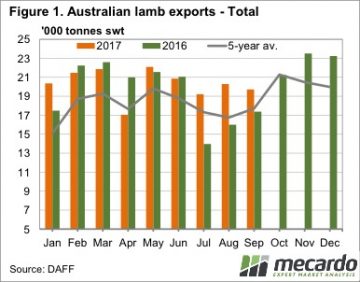
Figure 1 shows that the extra lamb supply we have seen hit the market since June is being soaked up by export markets. The increase has been diminishing, with September exports sitting 13.4% above last year. The three month total increase for July to September is 25%. Interestingly lamb exports for the last three months are not a record, falling just 0.75% behind the levels of 2014.
 A simple indication of increased demand is the fact that in 2014 the Eastern States Trade Lamb Indicator (ESTLI) averaged 459¢/kg cwt from July to October. This year the ESTLI has averaged 604¢/kg, 31% higher.
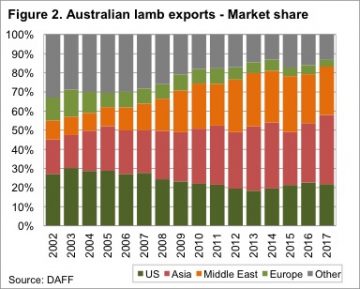
Pinpointing the source of increased demand is a little difficult. Lamb exports for July to September were up 38% to the US, 21% to the Middle East and 36% to Asia. These three destinations have accounted for 83% of lamb exports for the year to date (figure 2), so it’s safe to say demand is up in all our major markets.
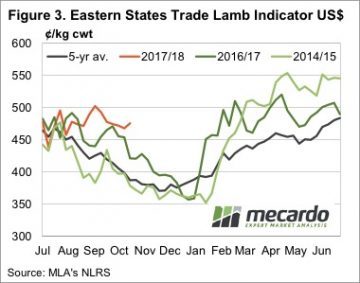
It’s also not exchange rates driving stronger demand from export markets. Figure 3 shows the ESTLI in US dollar terms, and while it’s not at record highs, it hasn’t been this strong at this time of year since the very tight supply of 2011.
We are left with the fact that all our major lamb markets are buying more lamb, and seemingly paying more for it. This is the key indication of stronger demand.
What does this mean?
 We have in the past seen significant jumps in lamb demand from exports markets, and we might now be seeing early indications of the next one. Significantly larger export volumes, coinciding with similar or stronger prices suggests that consumers in the US, Middle East and Asia have become comfortable with the higher lamb prices seen over the past nine months.
This bodes well for future lamb prices, as increasing supplies are unlikely to push the market as low as it got last year, with a 550¢ floor a possibility.
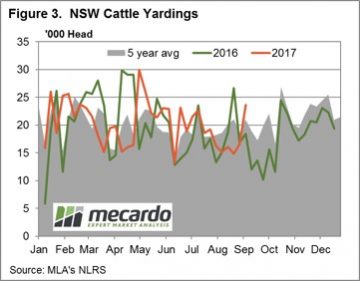
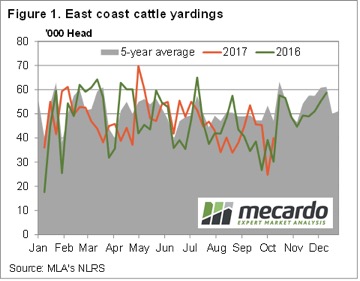 There was a significant jump in yardings this week, but this failed to dampen cattle prices, which continued to rally. In fact, it seems to be rain that is doing the opposite of dampening prices, with prices finding strength, almost across the board.
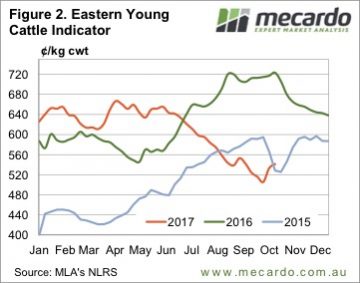 The Eastern Young Cattle Indicator (EYCI) continued to rally, but the pace slowed. The EYCI gained 8¢ this week, to lift it to the levels of five weeks ago, at 541.25¢/kg cwt (Figure 2).
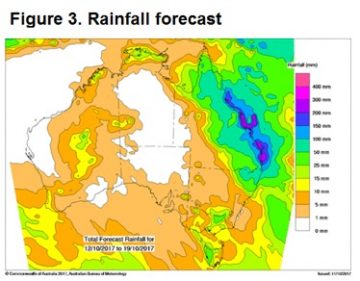 The forecast says there is more to come for at least half of Queensland (figure 3), and this suggests that there is only one way for cattle prices to go next week, especially young cattle prices.
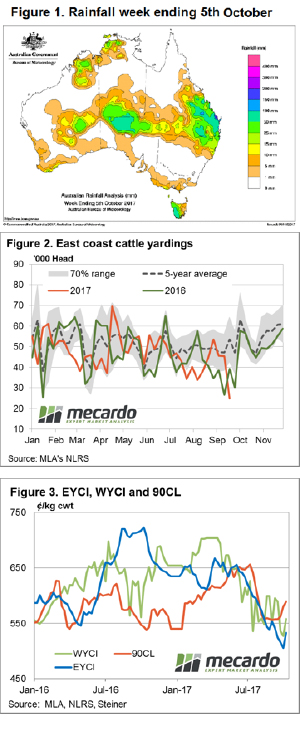 The Mecardo team have been suggesting a price bounce was imminent for the last few weeks given the rainfall forecast, recovery in export prices and falling supply at the saleyards. But as the old trading adage goes, “even a broken clock gets it right twice a day” so we won’t puff out our chests too much on this one.
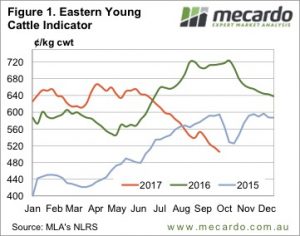 It was only in mid-July that the Eastern Young Cattle Indicator (EYCI) broke through 600¢. The downward spiral now has the EYCI looking down the barrel of a number with a four in the front. There has finally been some positive news on the climatic front, however, which could and should provide some support, if it eventuates.
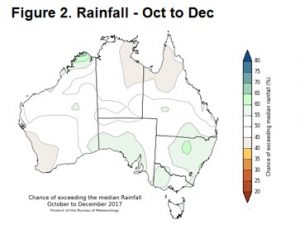 It was feeder steers which managed to defy the trend this week, gaining 8 and 7¢ in NSW and Victoria respectively, to move back to 286 and 283¢/kg lwt. It was trade steers that drove the EYCI lower.
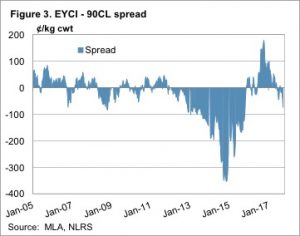
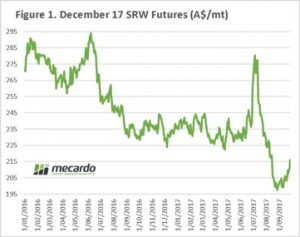 The country sits on tender hooks, as we come to the end of September. The forecasts for the crop from ABARES and USDA seem to be wholly optimistic, and will see severe downward revisions after a terrible month for much of the growing regions.
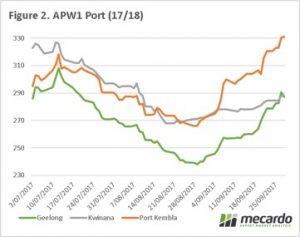 The A$, although still high compared to the last year has dropped back below 79¢, helping the local price. In the past month we have seen iron ore futures (figure 3), start to slip which put pressure on the A$. As China drops demand after an intensive import program over the past few months will we see a further slide back down to 75¢
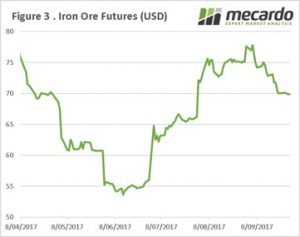
 The headline Eastern Young Cattle Indicator (EYCI) finished softer again this week, but not before staging a slight gain off the mid-week low of 513.50¢/kg cwt as saleyard throughput numbers decline in the face of the lower prices.
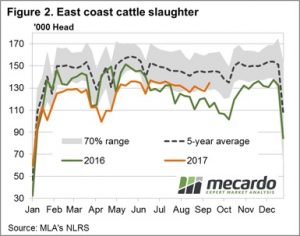
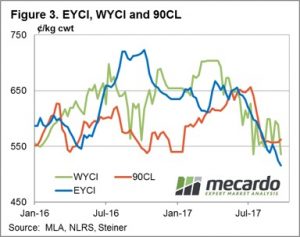

 A couple of weeks ago we wrote in this column that the Eastern Young Cattle Indicator (EYCI), and cattle prices in general, might have found a floor. Turns out we were wrong. Figure 1 shows the EYCI falling below the spring lows of 2015, and heading towards 500¢.
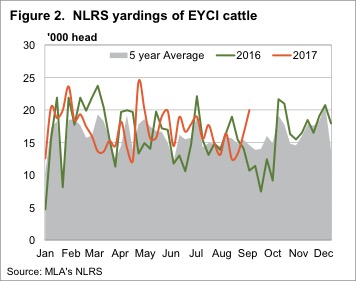 Over in WA the Western Young Cattle Indicator (WYCI) has also weakened, but only eased 6¢ to 589¢/kg cwt. Unlike the EYCI, which is sitting 26% below this time last year, the WYCI is just 4.7% lower, so things aren’t too bad for WA producers.
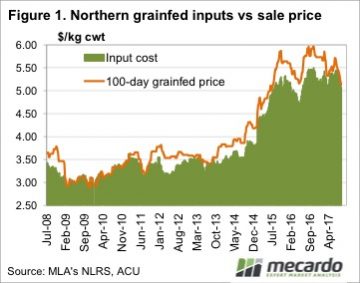 Grainfed cattle prices have fallen in line with the rest of the market, with the consistent decline putting pressure on lotfeeder margins. With pressure on lotfeeder margins comes lower feeder cattle prices, although, on a relative scale, they are performing ok.
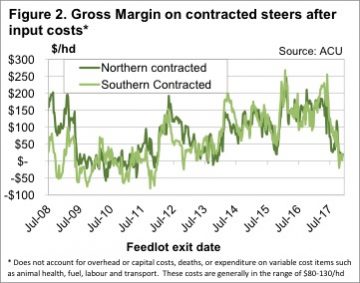 The situation is a bit different now, compared to 2009-2011. Back then cattle on feed numbers were low, with cattle going through feedlots at break-even to keep the doors open. Currently there are plenty of cattle on feed, and we have seen over the past couple of years that weak margins don’t last long.
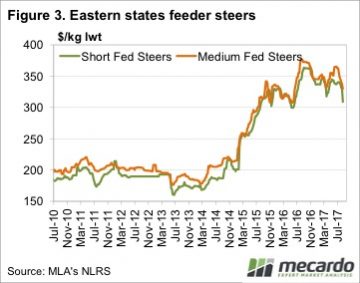 It’s not unusual to see tight feeder cattle supply causing low lotfeeder margins at this time of year. The question is what happen when supply improves in September and October. Under current grainfed cattle and grain prices, feeder prices will have to fall 20¢/kg lwt for lotfeeder margins to improve back to $100/head. Figure 2 shows that $100/head is more in line with recent history.
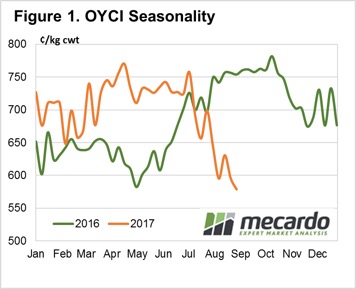 This weekly comment marks the first in our planned fortnightly Online Young Cattle Indicator (OYCI) updates as well as a general summary of the broader cattle market over the last week. Interestingly, the spread of the OYCI to the EYCI has narrowed over the month of August.
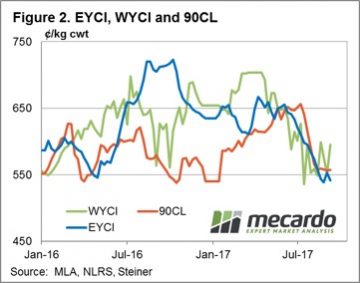
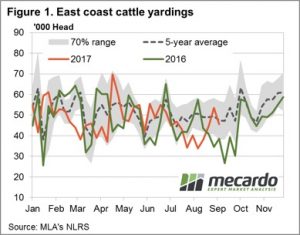
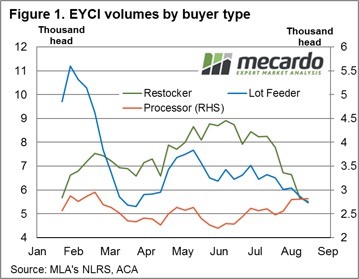 Since the start of Winter there has been a changing dynamic at the saleyard for young cattle purchases. Declines in average volumes have been noted for restockers and lot feeders, on the back of reduced pasture availability and higher feed costs. However, processor purchases have bucked the trend as their margins are stubbornly clinging on to positive territory.
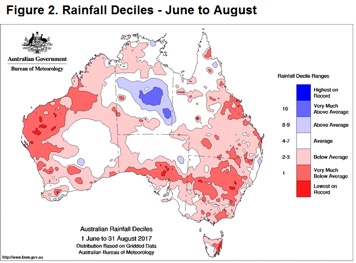 Over the season so far, restocker purchases have been averaging around 7,250 head of EYCI cattle per week. However, average purchases for the last month have reduced to 5,500 head as unseasonal dry conditions, highlighted by the rainfall deciles from June to August (figure 2), sap some of the optimism out of restocker demand.
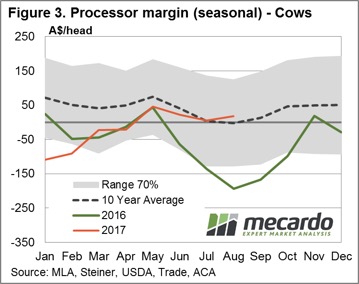 The updated Bureau of Meteorology three-month weather outlook indicates a move to a more neutral condition for much of the country. The BOM expect rainfall to be below average in southwest Australia, above average in parts of southeast Queensland, and has a 50/50 chance of being above or below average elsewhere.