Category: Grain

WASDE & rain

The rain has arrived in the east, but it’s still too early to call the drought broken. Nonetheless, the sound of rain on the roof is great therapy. In this weekly comment, we take a brief look at the WASDE report and how the market has reacted to the downpours.

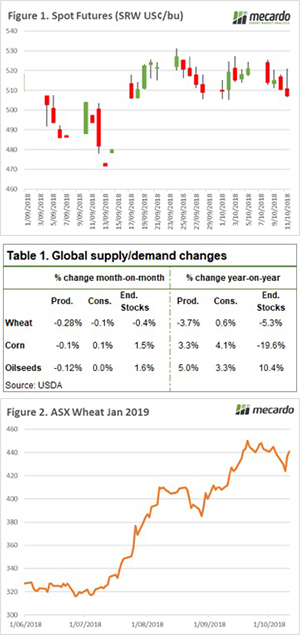
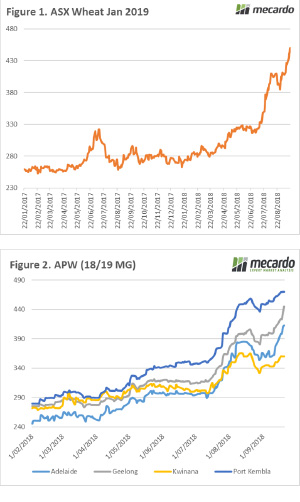
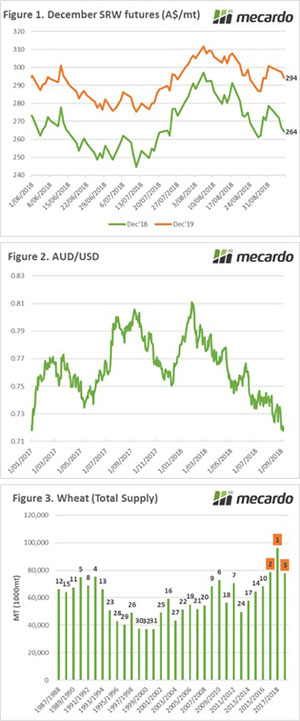
The futures market is down 2% week on week (Figure 1). The market has largely been treading water over the past fortnight with the lack of substantive data. At this point of the year, the world production is largely set with only the southern hemisphere being a relative unknown. The big issue is where we go to in 2019, as globally we are on the tipping point.

The WASDE was released overnight (Table 1).  The report didn’t provide enough fire to really move the market, however global wheat production was reduced overall by 2mmt, with falls in Australia (-1.5mmt) and Russia (1mmt).

The USDA has lowered Australian wheat exports to 13mmt, however, at this point this is overly optimistic. While the east coast suffers through a deficit, the WA crop will find it’s way around the Bight. In the coming months, this figure will be downgraded substantially and impact the availability of global exports.

It was expected that the USDA would drop their projection to 17 or 18mmt, however they were conservative with 18.5mmt. This fall will not be a surprise to anyone in the Australian grain trade and will have little impact on pricing locally as most are working on a sub <18mmt national production figure.

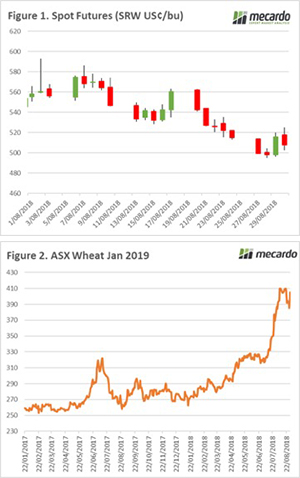
The east coast has seen some very welcome rainfall at the beginning of the week, with more forecast over the next fortnight. This led to a 4% decline in ASX futures, with the contract falling from $441 to $424. However, the market regained all its losses and settled on Thursday at $441. The reality of the rain is that it is too late for the majority of the crop, and the only hope for consumers is the outcome of the summer crop.

What does it mean/next week?:

Harvest is starting to get underway in WA. Over the next month, it will be interesting to see how the frost impacted the crop. All expectations are still for a reasonable crop and sufficient stocks to feed the east coast domestic demand.

In the east coast, many will be watching the moisture profile to make the decision on whether summer planting of sorghum is worthwhile. At present, there are a lot of acres to be planted, with moisture being the only barrier.

Warning: This isn’t the new level.

It’s a dog of a year. There was some hope that September would bring some rain to at least keep the crop stable. Unfortunately, September has brought frost and continued dry weather. As a result, wheat pricing has stepped up a gear. In this article I look at the structure of the market and why it is important to remember that this price is not the ‘new, new’.

At present, the local market is the most important driving factor for pricing, with basis levels trading at post-deregulation records. As an example, basis (Port Kembla) now comprises approximately 45% of the overall flat price, against an average of 13%. Nonetheless, the futures market and overseas pricing should not be ignored.

The futures market has lost ground since its late July/Early August rally and is tracking the 2015 season reasonably closely (Figure 1). US futures have lost strength due to lower than expected exports with commitments at 38% of projections. This is a substantial drop from the typical 57% for this period of the year. The futures pricing, however, does indicate that globally concerns for wheat availability is not yet critical.

In this analysis we have chosen to analyse pricing in Geelong, however, a very similar picture is apparent in all port zones within Australia. In Figure 2, the seasonality of Geelong APW is shown. The stratospheric ascent. The market is currently pricing at $430-445, with limited grower selling. This is clearly an abnormal year for pricing and shows the impact of a drought.

The basis level has clearly been the main driver (Figure 3), with the premium in Geelong over Chicago at +$160. This is a remarkably strong level and as we can see is well above what would be considered the normal range.

At present pricing levels are unlikely to see a substantive fall this harvest and risk management for growers at this point is largely not required. However, it is important to remember that these prices are caused by a drought premium and as figure 2 & 3 display, this is an abnormal year.

What does it mean?:

It is important to understand that these prices are not the ‘new, new’. If we have an average or above year in 2019, the premiums currently in the market will erode very quickly. The market will move back to a pricing point based on the export market and will align with international values.

At present no-one knows how the weather will treat us in the next year. If anyone tells you that they do; they are guessing. It therefore makes sense to investigate the forward market either through physical or futures to commence a structured sales plan for the 2019/20. At present 2019/20 Australian markets have a drought premium already priced in.

Key Points

  • The basis component of pricing in Australia typically contributes around 13% to the overall flat price. This year basis is at a post-deregulation high in all port zones, with Port Kembla at 45%
  • Chicago futures have fallen during August & September, whilst local prices have risen. This has led to very strong premiums.

The pricing levels as present are due to local drought. It is important to understand that these prices will not be around for the 2019/20 harvest if we see an average or above average crop.

Some people feel the rain. Others just get wet.

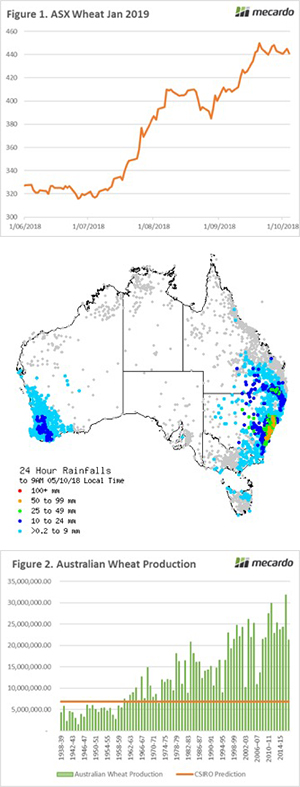
The drought continues to be the main talking point, with this September being officially the driest on record. The areas that were in reasonable condition at the start of the month (Vic, SA & WA) have all seen downgrades to their potential production. However, it’s not all doom and gloom with welcome rainfall in NSW.

The ASX futures saw strong volume this week, however, is currently marginally lower than the end of last week (Figure 1). Interestingly there was increased interest in delivery periods further on the horizon with trades at $370 for Jan 2020 and $360 for Jan 2021. I wrote on Tuesday about the importance of looking beyond the current harvest (Warning: This isn’t the new level.).

This has been a tough year, however, it is fantastic to see some reports of substantive rainfall in NSW and QLD (see map). It is much too late for many crops, but it will fill some dams and assist with the moisture profile for the coming summer planting. Most of all, it improves everyone’s wellbeing.

The CSIRO has released crop updates based on their Yield Gap model. They currently predict an overall yield of 0.62mt/ha, this equates to 6.8mmt. In comparison, in the last ABARES update a yield of 1.45mt/ha or 16mmt was forecast. This is a bold call from CSIRO, however as we all know a ‘small crop only gets smaller’.

This forecast would place the crop at the lowest level since 1972/3 (Figure 2). They may indeed be correct, but I think that market forecasts of between 12-16mmt are more realistic.

What does it mean/next week?:

In the next week, we will see the WASDE report released, I don’t expect many big surprises in this report as most crops are now a known entity.

There are many in the industry examining the possibility of importing wheat or by-products for feeding purposes, as many consuming industries are unable to remain profitable at these levels.

Prices are soaring like an eagle.

It’s another week of increased pricing. In this week’s comment we look at wheat pricing, the new action in canola and increased to global wheat production. 

The continued poor conditions and lack of grower selling has led to further increases in pricing in the past week. All zones have shown strong rises, with the lowest being in the Port Kembla zone, at a meagre 1% (figure 1). The reality being that in NSW and QLD, there isn’t much value in increasing prices because it just isn’t available to buy.

Two weeks ago I wrote about the relative inaction in the canola market (see link). At this point the canola market has only risen 10% since the beginning of widespread drought panic whereas wheat had increased an impressive 27%. A combination of the high price of hay alongside dry/frosted conditions in the east coast has led to substantial cutting for hay.

It seems that this is now starting to filter to the buyers. In the past two days prices have markedly advanced, with Port Kembla and Geelong rising 4-6% week on week (figure 2). The spread between Port Kembla and Geelong has decreased from its season high in early September, as buyers chase areas of potential production.

The International grains council has increased its forecast for this year’s wheat crop to 717mmt after improved prospects in Russia. This provides some limited breathing room for importers, but, for Australian producers the only real concern is the local situation.

What does it mean/next week?:

The market really is soaring like an eagle in Australia, but it is bittersweet. The reality is that this drought is no good for anyone on the east coast. The consumers of grain are paying prices which will massively impact upon their profitability. Grain producers will find that the higher price will nowhere near offset the reduced yield.

The great fuel robbery of 2018

Fuel prices have seen a dramatic rise in recent days. Talkback radio has been airing calls to boycott the petrol stations. I thought it was therefore worthwhile revisiting fuel prices within Australia – are we being screwed over?

We start our journey in Singapore, where the bulk of our fuel is imported from. In Figure 1, the Singapore and the average Australian petrol price (at terminal) is displayed since the turn of the decade. There is an extremely high degree of correlation between (0.9615), with 1 being a perfect correlation and 0 being no correlation. In effect, this shows that when Singapore prices increase, our prices will also rise.

In Figure 2, the spread between Singapore and the average Australian price has been plotted, with the 7-day moving average to smooth out the data. This will give an indication of whether we are paying a higher premium, and therefore being gouged. However, the current spread is quite close (4¢) to the average compared to the start of the decade (61¢), but in recent years the trend has seen a rising premium in Australia.

The fuel premium in Australia over Singapore can be attributed to logistics and excise duties on fuel. However, the relatively narrow range that the basis trades within can allow us to effectively use Singapore fuel pricing to determine our price (or even hedge).

The major machinery items on-farm use diesel, and whilst we were looking at spreads, it is worthwhile to examine the spread between diesel and petrol prices. In Figure 3, we have plotted the spread, again using the 7-day moving average. At present diesel is currently pricing at a premium over 2.97¢ over petrol. This is above the average of 0.82¢ above petrol since the turn of the decade.

Interestingly however, since the start of 2015, the spread has been a lot lower, with diesel being discounted at 1.6¢ below petrol.

What does this mean?

In reality, this isn’t the great robbery, more a result of market forces.

The cost of my 600km a week commute has increased substantially. As much as it would be nice to blame the fuel companies, the price is a result of the market. It is important to remember that a large chunk of our local fuel price is fuel excise and we will be unlikely to see a government reduce taxes on fuel.

By looking at the numbers, it means that petrol and diesel prices are largely following the international market. There doesn’t seem to be any evidence of gouging, as spreads between Singapore and Australia have remained within the narrow band that we have historically experienced.

To those calling for a one-day boycott of fuel stations. It really won’t make a difference. Those who use a car have a relatively inelastic demand for fuel, if we don’t purchase on one day, we will buy it on another day. The impact on fuel companies will be infinitesimally small.

Key points

  • The bulk of fuel in Australia is imported from Singapore
  • The correlation between Singapore prices and Australian is 0.98, almost perfect.
  • The spread between Singapore and Australia has risen strongly above the decade average.

Strap on: We are in for a ride

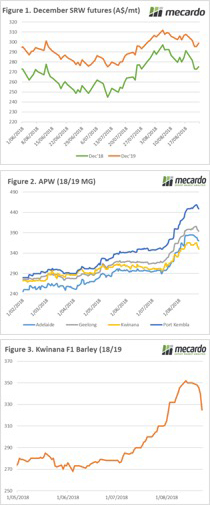
‘A big crop gets bigger and a small crop gets smaller’. This seems to be an apt statement to apply to this year’s Australian production. Continued concerns in the east coast & now in WA have led to more positive price action in the past week.

The ASX wheat contract in the past has been quite illiquid, recent months has seen reasonable volumes move into the contract. The lack of grower forward selling due to drought (& frost) concerns. The contract is deliverable; therefore it provides an opportunity for consumers to have cover to meet requirements.

After a rapid rise through July and mid-August to $400-410, the market fell to $385. This dip was short lived, and in September continued dryness and frost in both sides of the continent have led to impressive gains. In the past week the price has risen $25/mt or 6% (figure 1).

At a physical pricing level the new crop multi-grade APW contract has seen a corresponding rise, however selling has been at low. Interestingly the market in Port Kembla, has seen a more sluggish (figure 2) rise than other east coast areas (Adelaide & Geelong).

What does it mean/next week?:

At present there are a high number of growers cutting grain and canola for hay. This leaves an interesting conundrum – will this increase in hay due to drought and frost lead to a downturn in hay prices?

One thing is for sure though, it’s time to strap on our helmets as its going to be a bumpy ride.

Global supplies up but local take no notice.

The second of the major supply reports of interest this week was the World Agricultural Supply and Demand Estimates (WASDE), released on Wednesday night. The United States Department of Agriculture (USDA) surprised the market by lifting production estimates for good crops, more than it cut estimates for bad crops.

The USDA stripped 2mmt off the Australian crop and 1mmt off Canada. Both being major exporters of wheat, this could be expected to initiate price support. However, the cuts were offset by a 3mmt lift in Russia and 0.5mmt in Kazakhstan. Apart from being the home of Borat, Kazakhstan is also an exporter of wheat. Both Black Sea countries are reporting good harvests to date, so the lift was somewhat on the back of actual supply, rather than estimates.

The impact on global supplies was a 0.5% lift in production and 1% lift in ending stocks. Figure 1 shows the stocks to use ratio sits at 35%. Down on last year but still very strong. It’s little wonder the CBOT Soft Red Wheat market fell back to 503¢/bu, a two month low.

To local markets, it seems the CBOT Dec-18 fall to around $270/t in our terms was of little consequence. Local markets actually gained ground, with wheat rallying to new highs across many markets.

In terms of international markets, we are now more interested in what they can do for us in the 2019-20 market. With CBOT at $285 in our terms, we might have to wait a little longer for it to hit the magic $300 mark.

What does it mean/next week?:

There doesn’t appear to be a lot of downside for local markets at the moment. As outlined in the ABARES report earlier in the week, supply relief isn’t likely to appear until at least the northern sorghum crop appears in March. That will require some rain, which is yet to appear on any forecasts.

Russian rumours relegated.

Russia is in the press a lot at present, in geopolitics its due to accusations of Novichok poisoning. In grain, its rumours of export bans. In this week’s comment, we take a quick look at the chance of an export ban and the decline in the AU$.

At the end of last week, I highlighted the market concern related to potential export curbs. This had led to an increase in futures values (Figure 1) towards the end of the week. There was a meeting between the Russian government and exporters to discuss export pace. My view was that this would amount to nothing and that was the case.

The lack of any export controls, alongside some very cheap sales and strong export pace, has led to a softening of Chicago futures throughout this week. At present, December 2019 (& ASX Jan 2010) still offers a reasonable hedging option for producers to lock in strong prices for next harvest.

The Australian dollar has assisted by limiting the damage caused by the decline in offshore futures. In the past week, the AU$ has fallen to 20-month lows (Figure 2). The decline is attributed to a combination of concerns, with Asian stocks taking a tumble and the bank interest rate rises out with an RBA decision, this has limited the chance of further rises in the near future.

I was asked by a client this week to elaborate on my view that there wouldn’t be an export curb in Russia. There are several reasons why restrictions are unlikely, however, the main one for me is the combination of beginning stocks and production (total supply). The current year will be ranked 3rd out of 32 for highest available production. There is no need to put in place a ban, as there are sufficient supplies for domestic demand.

*Article written on Thursday evening and may not reflect overnight moves.

What does it mean/next week?:

The next week will see the release of the WASDE and the ABARES crop report. It will be interesting to see where ABARES place the Australian crop. It should not come as a surprise to anyone that downwards in the East and upwards in the West will be the trajectory.

On tenterhooks.

The drought has put the whole country on tenterhooks. The market is currently at very strong levels, any event has the capacity to cause very big swings in pricing. The weather at present seems to be trying to play its tricks and keep everyone on their toes. 

Chicago futures received some attention this week. At the start of the week, the market was on its eighth downward session in a row. The trend was bucked, albeit correcting itself the next day (Figure 1). The rise is due to continued concerns related to curbs of exports in Russia. At present, it is a case of will they, won’t they.

Russia is always a hard place to make views on, as they tend to play by their own set of rules. My view at present is that they are unlikely to drastically curb exports and at most, we will see an export tariff.

Welcome rains were received in northern NSW and southern QLD last weekend. They were however following the pattern of forecast rainfall events that we have seen throughout the year – much lower than projected. The rainfall for most in these regions is too little, too late. The market fell on the back of the expectations and projections that this event will be supportive of summer planting of sorghum (Figure 2).

The weather, however, had another trick up its sleeve. On Tuesday morning there was a substantial frost event impacting large tracts of the east coast. It is too early to ascertain the extent of any damage; however, many plants are still immature for this point of the year.  If we are lucky, we will have dodged a bullet. But the frost concerns did drive the market back up to sit close to highs of the past month, indicating just how nervous the market is at present.

What does it mean/next week?:

Canadian crop estimates will be released overnight. They have had some poor conditions in many regions and we could see further tightening of global stocks.

Rainfall is due to hit the NSW in the middle of next week, which will hopefully provide some confidence for the summer crop.

More fake news and a spill in wheat

The week that was in wheat. There is always something interesting happening in the wheat market and when there isn’t, the industry can just make things up. In this week’s market comment, we provide some insights into fake news, futures pricing, local basis & the drop in barley pricing in WA.

The futures market lost its leadership this week when futures prices fell, albeit only to late July levels (Figure 1). The recent fall is largely attributed to the increasing corn yields in the US and the expected reduced feed consumption of wheat. I wrote about this potential issue in early July, as the wheat to corn ratio started to rise (see here).

There were rumours towards the end of last week of Russia enacting an export ban, which pushed up prices, at least momentarily. This was, however, another example of ‘fake news’, in a similar fashion to the rise in early August as a result of misinterpreted social media postings by a Ukrainian minister (see here).

A Russian export ban is not going to be legislated this year, it is important to keep perspective on the fact that Russia is still on track to produce its 3rd largest wheat crop. If Russia takes action to limit exports, it will be in the form of export tariffs.

These fake news incidents further highlight the importance of high quality information in the agricultural sphere. it is extremely important to ensure that you are getting information that is of high calibre, timely (but not at the expense of accuracy) and free from bias & interference.

The local market lost some fire over the week, with basis level across all zones falling (Figure 2). The smallest fall was in Port Kembla (-1%), which makes sense due to the norths dire need for feed. All other zones fell by 2-5%. There is rainfall on the horizon in NNSW, which has pressured the ASX contract. There are some anonymous commentators (see here) calling now for a rise in wheat production up 25mmt.

My view from discussions with farmers and agronomists in the region is that it is a case of being too late to make any substantive change. It will however, provide some valuable soil moisture for the coming summer crop.

The barley market in WA has been interesting this week, with prices dropping considerably. The kwinana zone has seen F1 feed prices drop by $25/mt or 7% since last Friday (Figure 3). It has to be noted that although the price has fallen considerably, it would still be considered a very strong price from a historical perspective.

What does it mean/next week?:

It will be interesting to see what happens to wheat during the next week. The market has fallen sharply, but aside from lower feed usage the picture is still pointing towards a bullish pricing scenario.

The Russian crop is going to win the war of exports over the next six months, however we are likely to see a switch back to the US in the early part of 2019.