Category: Sheep

Perfect storm for wool market.

A fall in the Au$, alongside a reduced offering and the prospect of a further reduction in the offerings into the future, conspired to create an almost frenzied wool market this week.

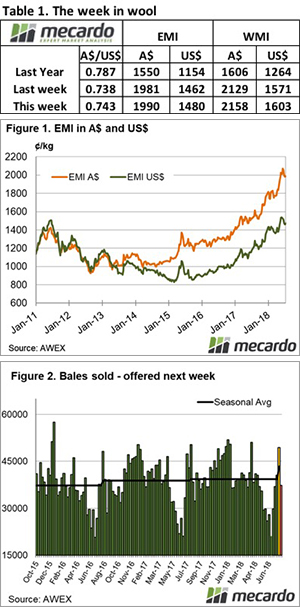
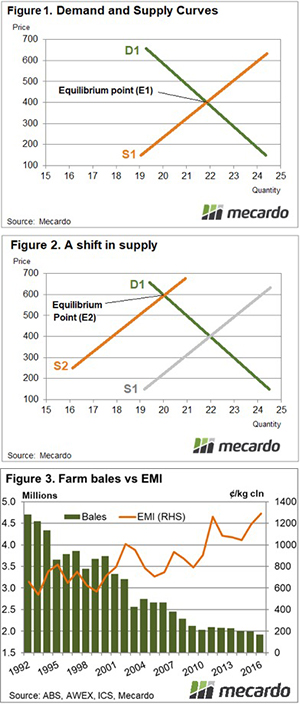
The Eastern Market Indicator (EMI) rose strongly from 
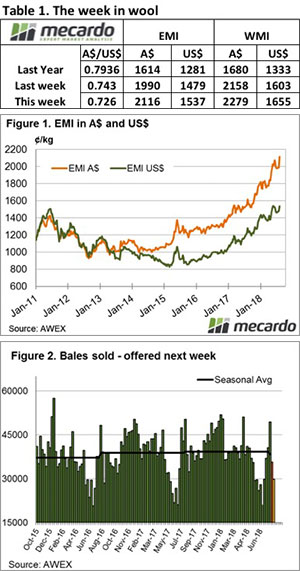
the start and never looked back, gaining 126 cents for the week, to settle at 2116 cents AU$ (Figure 1).

On the first day of selling, the EMI set a new record for the largest daily rise, increasing 99 cents. This lifted the EMI above the previous record high of 2,073 set in June this year.

The EMI was stronger but slightly more subdued in US$ terms, closing at 1,537 US cents, up 56 cents on the week.

AWEX reported that the main drivers of the rally were the reduced offering, concerns about future supply and the benefit of a lower Au$. This is in line with the general explanation of the very good market levels, however, there is also the cyclical effect on the wool market (we are in a super-cycle), as well as a growing appetite for wool from activewear and luxury products. Whatever the reasons, wool producers are in for another good wool cheque for their next wool clip.

Sellers embraced the rally, passing in only 1.5% of the offered bales resulting in a clearance to the trade of 35,759 bales. Of note is that this clearance is 13k bales less than last week, and next week the roster is 6.5k bales fewer again.

This resulted in dollar value for the week of $87.3 million, with a combined value of $352.1 million so far this season.

Previously we have reported that better style wool has been more keenly sought and lower styles sometimes overlooked, this week small faults were ignored as buyers sought to secure quantity.

Skirtings and Crossbred wool didn’t miss out. After struggling to find support last week, Crossbred types increased across the board of 60 to 90 cents, recovering all of last week’s falls.

Merino Cardings also improved on a limited offering with all centres closing higher and above the previously unheard of 1500 cent level.

The week ahead

Next week only Melbourne and Sydney are listed to sell.

A look ahead shows that roster offerings are declining, with 29,800 bales listed for next week and 34,400 for the following week when Fremantle resumes.

As one analyst said when asked what the market will do next; “who knows, we are in unprecedented supply and price conditions”.

For what it is worth, we think that in the absence of further currency falls the market will steady next week and could in fact ease albeit slightly.

A reversal of fortune for WA producers.

The first quarter of 2018 was characterised by above normal price behaviour for many categories of lamb and sheep in Western Australia when compared to the Eastern markets. However, uncertainty surrounding the live sheep export trade has seen the situation reverse since April, placing WA producers at a distinct price disadvantage to their Eastern neighbours.

In early April disastrous footage of a live sheep export vessel from 2017 aired on commercial TV prompting a government review of the trade, undertaken by Dr Michael McCarthy, that was delivered in May. After the McCarthy review, some recommendation were put in place immediately and others have been scheduled for further investigation.

In June, the exporter identified in the footage had their license suspended and another exporter announced they would temporarily cease exporting from Australia after considering the new export requirements put in place from the McCarthy review. These two companies are recognized as the top two exporters of live sheep from Australia and the result of their exit left sheep stranded in transit in WA and producers in a bind.

Analysis of the price relationship between categories of WA lamb and sheep compared to their Eastern state counterparts shows that after experiencing above average prices for much of the first quarter of 2018 the spreads have been in steady decline since April. WA Trade Lamb dropped from a 50ֶ¢ premium to the ESTLI in April to a 125¢ discount by the end of July (Figure 1).

The reversal in spread behaviour for WA categories for lamb and sheep wasn’t confined to trade lambs. WA Restocker Lambs have dropped from a 50¢ discount spread in April to a 300¢ discount spread, WA Light Lambs declining from a 25¢ premium spread to a 170¢ discount and WA Heavy Lambs from a 50¢ premium spread in April to nearly a 150¢ spread discount during July (Figure 2).

WA mutton also experienced a significant turnaround in spread behaviour across the April to July timeframe with a widening in the discount spread by over 200¢ (Figure 3). Indeed, for nearly all categories of WA lamb and sheep, the spread has transitioned from trending above the normal seasonal range to languishing below the normal range as the situation for live export sheep out of WA became more uncertain.

*In recent weeks the team at Mecardo have become aware of suggestions that our live sheep export analysis and reporting has been funded by live exporters and is therefore biased. This is incorrect. Our analysis is backed by data from trusted sources, like MLA, ABS, ABARES, etc, and Mecardo website publications are not funded by anyone other than our subscribers. 

In late April Mecardo were commissioned by WA Farmers (WAFF), with the support of Sheep Producers Australia, to produce a short report on the live sheep export trade. The report was clearly labelled as to whom funded the project and is available on the WAFF website.  For the record Mecardo has not received any payment from live export companies, nor their representatives, for any live sheep export related analysis or report produced.

What does it mean/next week?:

The reversal of fortune for WA sheep and lamb producers certainly coincides with the timing of all the uncertainty around the live export trade. In terms of annual offtake in WA live sheep exports contribute around 30% of the available outlet for turnoff and the disruption to the trade, with the two biggest exporters not currently participating, seems to be having an impact on prices and spreads.

Key points:

  • WA markets for lamb and sheep have seen price spreads between Western and Eastern markets turn unfavourable for WA producers since the start of the live sheep export issues in April 2018.
  • MLA reported categories of WA lamb and sheep have seen saleyard price spreads move adversely for WA producers by an average magnitude of over 200¢ from April to July.

Wool market back in action

The wool market opened after the winter recess with what appeared early to be a negative sentiment on the back of an increased offering. This didn’t last long, as by the end of the week buyers were keen to purchase and pushed the market above the previous close.

The Eastern Market Indicator gave away 25 cents on the first day, however by the end of sales had picked up 9 cents above the previous sale close to settle at 1,990 cents AU$ terms (Figure 1).

The EMI was also stronger in US$ terms, closing at 1,480 US cents, up 18 cents on the week.

When we thought that perhaps the wool market would settle down into maybe a declining market after the extreme ride that occurred pre-recess, in fact, the result this week suggests that we may not have seen the last of this “Bull” market.

Sellers began the week reluctant to follow the market lower, but by the end of the week, there was a positive tone, with a total of 4.7% passed in for the week.

An offering of 49,415 bales resulted in 47,0176 bales sold, a solid clearance for the resumption of sales.

A couple of notes from AWEX caught the eye; early in the week, the better style wool held in the face of a softer market, while lower quality types struggled to find support. This has been a notable pattern over recent times especially when the market is soft.

The other message was in regard to non-mulesed wool; it was noted that buyers competed aggressively, especially on Thursday. We are hearing of a more regular demand and AWEX is reporting more frequently identifiable premiums for wool designated non-mulesed.

Crossbred wool didn’t see the shining results of Merino fleece this week. Demand was lacking and as a result, 26-28 micron wools lost 50 to 90 cents.

Merino Cardings also improved with the Cardings Indicator in Sydney – 13, Melbourne – 16 and -31 in Fremantle compared to the previous sale.

The week ahead

Next week all centres are listed to sell.

A look ahead shows that roster offerings are declining, with 37,290 listed for next week and 33,761 for the following week. This should support the market in the short term.

High prices having an impact on price.

There is an old market adage that the best cure for high prices is high prices. They often encourage additional supply to come to the market and lead to a price easing which was certainly the case for most lamb and sheep categories this week.

East coast saleyards reported declines for all categories of lamb and sheep, except Restocker Lamb, which managed an 8.7% gain to close back above 600¢/kg cwt (Table 1). The remaining lamb categories posted falls between a 3-4% magnitude, with the benchmark Eastern States Trade Lamb Indicator (ESTLI) sitting right in the middle of the pack at a 3.5% decline to 761¢/kg cwt. Mutton registered the weakest drop, down 2.8% to close at 421¢/kg cwt.

Combined East coast lamb and sheep yarding levels remaining elevated and well above the normal seasonal range. This is a bit of a clue to the weaker prices, with the additional sale yard numbers acting as a drag on prices (Figure 1). At nearly 260,000 head yarded this week, throughput levels of lamb and sheep are sitting 44% above the seasonal average for this time in the year. Above average sheep and lamb yardings were reported across Victoria, NSW and South Australia, suggesting it’s not just the dry conditions in NSW encouraging the stock to be brought forward but also the decent prices on offer.

The surge in sheep slaughter noted in last week’s commentary extended further this week with an additional 10% added to see the highest weekly sheep slaughter since 2015 at over 152,000 head of mutton processed for the week ending 3rd August (Figure 2). In contrast, lamb slaughter numbers continue to slide, reaching the lowest weekly total it has seen this season at just over 307,000 head and resting 5% below the five-year seasonal average for this time in the year.

What does it mean/next week?:

Apart from Victoria, there continues to be little rain forecast for the upcoming period. Despite the easing prices this week for most categories of lamb, across the East coast prices remain well above the levels they recorded this time last season (Table 1). Indeed, Heavy Lambs are sitting 36% above 2017 levels at over 800¢/kg cwt. This suggests supply will continue to be encouraged forward and with that in mind its likely to see a continuation of softening prices into the short term.

Lamb and sheep spreads across the states.

Price volatility, market uncertainty and climate variability across regions can play havoc with the normal seasonal spread behaviour between categories of sheep and lamb. With the Eastern States Trade Lamb Indicator (ESTLI) coming off record highs, the ongoing live sheep export issues facing WA producers and dry conditions affecting NSW producers we thought it time to assess the state of play with regards to state spread behaviour for a range of categories of lamb and sheep.

Analysis of percentage price spread discounts and premiums for a variety of categories of lamb and sheep across the states is shown in Figure 1. The orange dash signifies where the current price spread premium or discount is sitting relative to the ESTLI.

Overlaid on the chart is the historic mid-point for the spread, which gives an idea of the average seasonal spread level for this time in the year (black dash), and the normal seasonal range (green columns). The green columns show where the spread has fluctuated 70% of the time during this part of the season for the last decade.

The current discount spread for NSW Restocker Lamb shows that they are very much underpriced compared to the ESTLI with the spread level sitting well below the normal range at a discount of around 45% to the ESTLI. This is unsurprising, given the dry conditions facing producers in NSW now.

Interestingly, the WA Restocker Lamb spread shows a similar picture to the NSW situation, with the discount spread of around 60% to the ESTLI sitting below the normal seasonal range. The seasonal conditions in WA haven’t been as dire as those facing NSW producers but perhaps the uncertainty around the live export trade is giving WA producers second thoughts about building up flock size.

To get a quick snapshot of the categories of lamb and sheep that are significantly above or below the normal level we have produced a chart that shows the percentage that the current spread level is above or below the average midpoint level (Figure 2). Along with Restocker Lamb in NSW and WA it shows that WA Trade Lamb, WA Heavy Lamb and NSW/Victorian Mutton are all registering below par spread performance at the moment.

However, on a positive note, the South Eastern mainland states Merino and Heavy Lambs are faring relatively well, registering current spread levels that are 5-25% above the norm. The stellar performance of wool prices this season is underpinning Merino Lamb prices and is appearing to keep the Merino spreads to the ESTLI in good shape.

What does it mean/next week?:

The SA Merino Lamb spread is performing particularly well compared to the other state Merino classes. This seems to have drawn out a few more Merino lambs in SA in recent weeks with the yarding level trending around 45% above the seasonal average (Figure 3).

The additional supply of Merino lamb in the SA saleyards is likely to put pressure on the spread in the coming weeks to see it move back toward more normal seasonal levels.

Key points:

  • WA lamb and sheep spreads to the ESTLI have been underperforming in recent weeks which suggests that the uncertainty around the live sheep export situation may be having an impact on price.
  • NSW Restocker and mutton spreads showing the most impact from the dry conditions.
  • Merino and Heavy Lamb spreads in the South Eastern mainland states are performing best, with SA Merino Lamb doing particularly well.

A bit of red ink on the sheep.

The rally in lamb and sheep prices has come to an end, for now. Trade lambs lost a little ground, heavy lambs are as rare as hens teeth, and sheep supplies seem to have started to flow. Restocker lambs can’t find any friends, as expected in dry times.

We’re not sure if they are leading indicators, but restocker lambs and the mutton prices both tanked this week. Figures 1 and 2 show a drop for restocker lambs of 96¢ and 47¢ for mutton prices, both to levels near those of this time last year.

The Eastern States Trade Lamb Indicator (ESTLI) lost just 10¢, so still hasn’t managed to breach 800¢ yet. The ESTLI finished Thursday at 788¢/kg cwt, while Heavy Lambs remained the star of the show at 842¢. Weight remains king in the lamb market, and while mutton and restocker lambs are priced pretty well historically, rising feed costs means the cost of getting weight in lambs, or wool on sheep, is getting prohibitive.

Lamb slaughter for the week ending the 27th of July finally slipped below last year’s levels. We’re still thinking that a lot of light lambs are being slaughtered, which is propping up the number of head, but the production of lamb meat is likely to be back.

Mutton slaughter last week ramped up significantly (Figure 3), hitting the highest weekly level since December 2015. It’s little wonder mutton prices took a hit. Sheep slaughter doubled in NSW and was up 61% in South Australia.

What does it mean/next week?:

The Bureau of Meteorology (BOM) released another depressing three-month outlook earlier in the week, forecasting 20% chance of better than median rainfall across most of NSW and Victoria.  This doesn’t mean it’s not going to rain, it just means chances are there won’t be a lot of it.

As such, the current dynamics afflicting the market, being a good supply of light lambs and tight supply of finished lambs, is likely to continue.

Wool Economics 101

In our lamb analysis this week we have looked at the demand-based reasons as to why the Eastern States Trade Lamb Indicator (ESTLI) has been on the improve since the 2000’s. Given the market recess for wool, we thought a demand and supply retrospective would be of benefit too, in order to help explain one of the key drivers for surging wool prices.

The Mecardo Lamb analysis that focuses on demand curve shifts that have led to higher lamb prices can be viewed here.

The laws of economics state that demand curves have an inverse relationship to price. This means that as prices increase the quantity demanded declines and as prices drop the quantity demanded increases. This is outlined by demand curve D1 in Figure 1.

On the other hand, supply curves have a direct relationship to price. As prices rise so does the quantity supplied and as price falls the quantity supplied is lower, as highlighted by the supply curve S1 (Figure 1).

Market forces will act to push the price to an equilibrium level where the quantity demanded is equal to the quantity supplied. This is where the demand and supply curves intersect at a price level of 400 and a quantity of 22 units –  point E1 on Figure 1.

In the case of the wool market, there has been a steady decline in wool supply since the collapse of the Reserve Price Scheme in the early 1990’s and the gradual switch from wool production to cropping. As such, for every price level, the quantity of wool supplied is now lower. This can be represented on the demand and supply diagram as a shift in supply to the left, with the supply curve moving from S1 to S2 (Figure 2). The new equilibrium level (E2) under this scenario of reduced supply is shown as a price of 600 and a quantity of 20 units. In this circumstance, the price has been driven higher by a contraction in supply over time.

Analysis of the wool market supply (bales produced per year) and price (Eastern Market Indicator – EMI) since the early 1990’s confirms the theory that reduced supply has been a key driver of higher wool prices. As identified in Figure 3, annual total wool bale production has declined from over 4.5 million bales in 1992 to under 2 million bales in 2016, with the EMI more than doubling over that time frame from 600¢/kg clean to over 1200¢/kg.

Key points:

  • Supply of wool has been in decline since the early 1990s and is a key underlying reason as to why wool prices have been increasing over time.
  • The annual level of wool bales produced has more than halved over the last two decades which has coincided with wool prices more than doubling in value.
  • In recent years the wool supply has stabilised, yet prices have continued to climb suggesting demand led factors are behind the current market rally.

Lamb Economics 101

In last week’s piece on deflated lamb prices, we mentioned that the underlying reason behind the increased lamb prices we have seen since 2000 has been increasing demand. This analysis highlights the lamb demand curve and shows why prices have risen despite increasing levels of lamb slaughter and production.

Recap on the deflated lamb price article here.

Before we cover how the demand for lamb has shifted over time it is probably prudent to provide a summary of the basics of demand and supply curves. Economic theory states that demand curves have an inverse relationship to price, or as prices rise the quantity demanded falls and as prices fall the quantity demanded rises. This is outlined by demand curve D1 in Figure 1.

In contrast, supply curves have a direct relationship to price. As prices go up so does the quantity supplied and as price goes down the quantity supplied is reduced, as highlighted by the supply curve S1. In a market, the competition between buyers and sellers act to push the price to an equilibrium level where the quantity demanded is equal to the quantity supplied. This is where the demand and supply curves intersect at a price level of 400 and a quantity of 18 units –  point E1 on Figure 1.

Let us assume that in this market something happens, other than a change in price, that increases the demand for this product. This could be a successful advertising campaign for the product, an increase in income levels for the people that buy this product or perhaps a competing product become more expensive, leading to buyers shifting their preferences to this product. This would mean that for every price level, there is now more quantity demanded and this is represented by a shift to the right of the demand curve to a new spot, D2 on Figure 2. The new equilibrium point in the market is now established at point E2, at a higher price of 500 and a higher quantity of 19 units.

Effectively this has what has been happening in the lamb markets since around 2000 onwards. We have been seeing successive shifts to the right in the demand curve as the demand for lamb increases. We can see the plot of the demand curves for lamb as highlighted in Figure 3. Annual average price levels based on the Eastern States Trade Lamb Indicator (ESTLI) have been plotted against annual average lamb slaughter levels to estimate the situation of the demand curve at different points in time.

There are some more Economics 101 lessons in the Mecardo Wool analysis this week that focuses on supply curve shifts that have led to higher wool prices.

What does it mean/next week?:

The current surge in lamb prices suggests that the demand curve for lamb may have shifted further to the right again, fueled by a growing Asian middle class, a series of successful Meat and Livestock Australia marketing campaigns and a reduction in supply from our only export competitor, New Zealand.

The step ups in lamb prices, outlined in last week’s article on deflated prices tend to coincide with the shifts in demand outlined in Figure 3. Furthermore, the current demand curve shows that if there are no more shifts in demand in the coming years its likely lamb prices may soften back towards the mid 500¢ level for the ESTLI by 2022 as production and slaughter begin to increase. However, if the dry persists and the flock rebuild is delayed, the ability to increase production will be constrained, leading to sustained prices at current levels.

Additionally, if demand can stage another shift to the right beyond the next few years (as Asian buyers continue to become wealthier) there isn’t any reason why we can’t see an ESTLI of 900-1000¢ as we head towards 2025.

Key points:

  • Since 2000 the lamb demand curve has continued to shift to the right, signifying that factors other than price movements have been responsible for an increase in demand for lamb.
  • The shifts in the demand curve have coincided with intervals in time when the ESTLI has seen a step-up in the trading range.
  • Growth in Asian wealth, successful marketing campaigns by MLA for Aussie lamb and a reduction in NZ supply are all reasons why demand for Australian lamb has increased since 2000.

Hilltop lambs in the nosebleed section

Robust lamb prices have been encouraging Victorian producers to come forward with lambs earlier than usual, but a dip in throughput this week has seen the Eastern States Trade Lamb Indicator (ESTLI) rocket to a breath away from the 800¢ barrier.  

Trade lamb prices across the East coast during July have been averaging 21% above this time last season and the strong performance has been inspiring producers to come forward with stock, particularly in Victoria.

East coast lamb yarding levels have been trending 23% above the five-year pattern for the first three weeks of July as highlighted on Figure 1. East coast lamb throughput boosted by Victorian numbers which had been trekking nearly double the normal levels during July attracted by prices above 700¢.

However, this week East coast lamb yardings eased 9%, moving back into a more normal seasonal range and the result of the relatively tighter numbers at the sale yard was to see a 5% price spike for the ESTLI to close yesterday at 798¢/kg cwt.

In a classic example of text book Economics, East coast mutton did the exact opposite to lamb, as the increased numbers of sheep recorded at the sale yard this week pressured the mutton indicator down 7% to close at 480¢/kg cwt.

East coast sheep yarding continuing to trend well above the seasonal average and above the normal range that could be expected for this time of the year – Figure 2. Mutton yardings jumping 15% on the week to sit 48% higher than the seasonal average.

The jump in local lamb prices flowing through to higher offshore prices this week with the ESTLI in US$ terms climbing to 590 US¢/kg – Figure 3. It’s interesting to note though that during the 2010/11 season lamb prices in US terms have been higher than where they are now, despite the record local prices. Indeed, when the A$ was above parity against the US$ in 2011 saw the ESTLI in US terms peak at 673 US¢. Mathematically speaking if the ESTLI was to reach toward the 670 US¢ level with an A$ back at the 75US¢ level that would translate to an ESTLI in local terms of around 890¢.

What does it mean/next week?:

It’s unlikely that we will see the ESTLI get to 890¢ this season with the Spring flush approaching. Even if there are less Spring lambs around this season, which is quite likely given the dry conditions we should still start to see the normal seasonal Spring price decline as we head out of Winter.

Some reasonable rain falls for WA and Victorian sheep rearing country is expected for next week but probably won’t be enough to support another strong rally in prices with them already being up in the stratosphere as it is. We are in nosebleed territory at the moment with these high-altitude lamb prices so it wouldn’t take much to see a little bit of a dip back toward the mid 700¢ region in the coming weeks.

Lamb has been more expensive in US terms.

Earlier in the week, we looked at lamb prices in deflated terms, and they are indeed near record highs. We know that export markets are helping drive lamb prices, so it’s worth assessing whether lamb importers are also forking out record dollars for lamb.

When I started researching this article, I was sure that at some stage in the recent past there was an outlandish claim somewhere amongst the articles stating that lamb prices could get to $8. It took a while to find, but it was there (Read here).  The forecast was, admittedly, not made with a lot of conviction, but the thinking behind it was basically the price of lamb in US dollar terms.

Even with the Eastern States Trade Lamb Indicator (ESTLI) sitting just shy of 800¢, in US terms the ESTLI still isn’t at a record (Figure 1).  Back in 2011 when the Aussie dollar was at or around parity with the US dollar, the ESTLI in US terms was at 670¢/kg cwt. This week the ESTLI remains below this, at 588¢/kg. Lamb prices are not cheap in US terms, but they have been more expensive, albeit only for three months.

The peak of lamb prices in US terms is still 14% away in nominal terms, and obviously further in real terms. If the exchange rate stays steady, and the ESTLI reaches 670¢ in US terms, it puts the ESTLI in AUD at 905¢/kg cwt. Those who study Meat and Livestock Australia’s (MLA) saleyard reports will have seen plenty of lambs making more than 900¢, so it’s possible the indicator could get there, although unlikely.

For mutton, the upside seems to be stronger. Figure 2 shows the National Mutton Indicator (NMI) in US terms on a financial year on year basis. The current close to record mutton values are still 23% behind the record price in US terms set in autumn 2011.

While the dry weather has seen lamb supply tighten, it is still seeing sheep coming to market and keeping a lid on mutton values, to an extent.

What does it mean/next week?:

Looking at lamb prices in US terms helps go some way to explain how strong prices can be at the moment. While lambs prices are extraordinary in our terms, they are ‘only’ 20% above the levels seen for most of 2017 for importers. This might be sustainable for the short term and the good news is that it makes prices of 600¢ seem cheap.

There is still plenty of upside for mutton, especially when it rains. Strong lamb and wool prices are likely to see a real squeeze on the supply of older sheep over the coming years.

Key Points

  • Lamb prices in US terms are strong but have been higher back in 2011.
  • There is still a 10% upside for lamb to reach the 2011 records in US terms.
  • There is more upside for mutton prices than lamb, as it was 20% stronger in 2011 in US terms.