In a week of “smoke & mirrors”, the market reflected a similar image to last week and absorbed a large offering of wool in all centres with 39,000 bales cleared. It was the finer than 19 MPG this week that disappointed with all other categories posting gains.
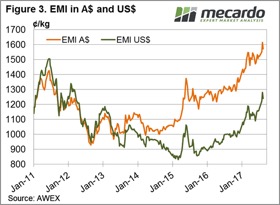
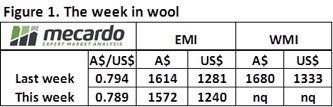
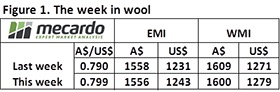 The EMI fell only 2 cents in A$ terms to settle at 1,556 cents, while in US$ terms the market improved 12 cents over the week (figure 1). The WMI was 9 cents lower than the previous close of last week.
Merino skirtings started slowly but picked up over the week to finish strongly; it was a similar story for X Bred types while Cardings, including lambs, locks and crutchings, were solid early and stronger by the week’s end.
 This week was a pretty good result considering a larger offering and a higher A$ could have pushed the market lower following the last couple of weeks of price corrections. It wasn’t the case however, and growers responded by clearing the large offering and only passing in 5.2%.
In fact, AWEX reported that on Wednesday Melbourne offered the largest merino fleece offering in almost 12 months.
Fremantle struggled on Thursday, with across the board price reductions predominately in the19.5 to 22.5 micron offering, although growers only passed in 5% indicating satisfaction with the market levels.
In the Forward Market, the past couple of weeks have seen growers take up good forward prices out as far as February 2018. This would seem a reasonable approach given the strong current market and the somewhat uncertain global circumstances.
The week ahead
 Through the looking glass into next week, another large offering of 44,281 bales are rostered for sale in all three selling centres (Figure 2). The solid performance this week in the face of a large offering and stronger A$ bodes well for next week.
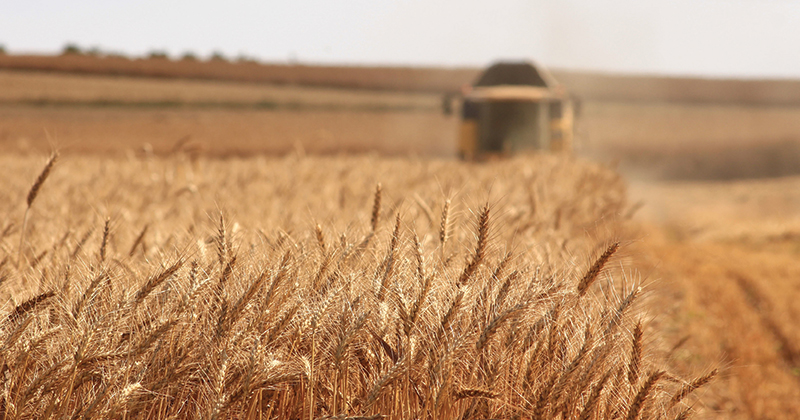
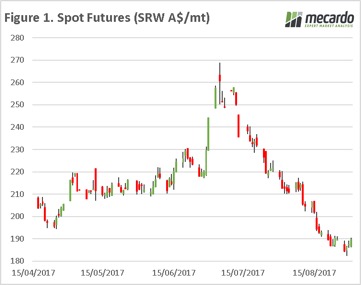 In nautical terms, ‘Dead Calm’ is completely still sea, with the absence of wind or waves. The grain market could be considered to be in a period of dead calm, with the market waiting for some wind or waves in the form of substantial new data to blow us either way.
 In contrast, Victoria seems to be the jewel in the crown and after having covered part of the state in recent days the crop looks to be in almost perfect condition, appearing to be on track for well above average yields.
 In two weeks, we will have the September WASDE report released, along with the ABARES report. The question will be whether the trade has priced in any downgrade, or whether any likely downgrades will cause a stir.
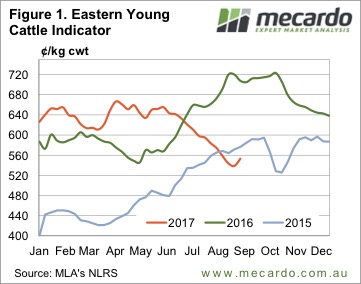 Young cattle prices gained some ground this week, for the first time in some while. The Eastern Young Cattle Indicator (EYCI) has fallen for 12 weeks without any real break. This week the break came, with the EYCI gaining 14¢ to move back to 553¢/kg cwt. Is it a dead cat bounce or a sustainable rally?
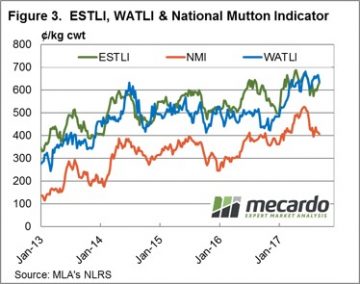
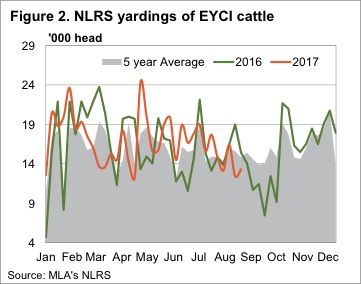 The 90CL Frozen Cow price has tracked sideways for the fourth week in a row and both the EYCI and Western Young Cattle Indicator (WYCI) have met it at around 555¢. Figure 3 suggests it’s hard to argue that falling beef export prices aren’t driving the cattle price.
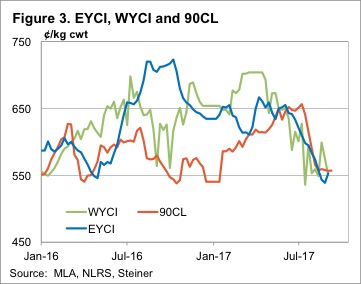
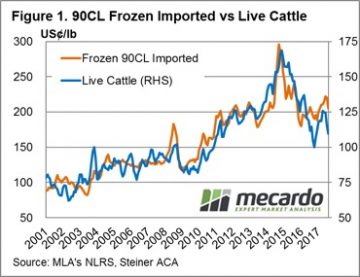 At Mecardo we regularly refer to the 90CL frozen cow indicator as a key beef export price benchmark when undertaking analysis of the domestic market prices in relation to overseas markets. This is because a strong long-term correlation exists between indices like the Eastern Young Cattle Indicator (EYCI) and the 90CL. We often get asked to explain what the 90CL actually is and what influences its movement – this will be addressed in this piece.
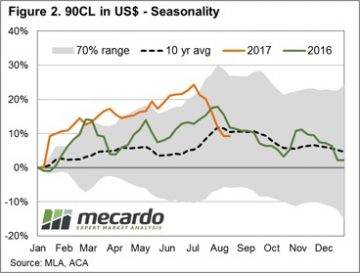 Therefore, it should come as no surprise that the influence of the broader US cattle market on the price of the 90CL is fairly strong. Indeed, as highlighted in figure 1, the movement of US Live Cattle futures is closely mirrored by the movement in the 90CL. Analysis of the monthly average price of US Live Cattle to the 90CL since 2001 shows a correlation measure of 0.9139 which suggests that nearly all of the movement in the 90CL can be explained by the fluctuations of the US Live Cattle market.
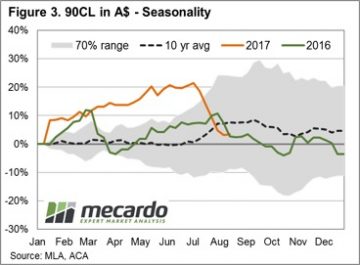 Compared to current US Live Cattle levels the 90CL in US terms seems a little overvalued, and the normal annual pattern heading into the remainder of the season shows that the 90CL usually begins to decline beyond the US grilling season peak around July/August.
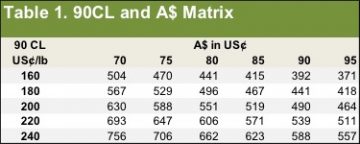
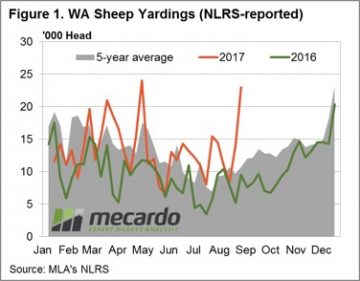 Figure 1 highlights the reaction of Western mutton producers this week to the robust prices for sheep and lamb prices being experienced recently, as covered by our
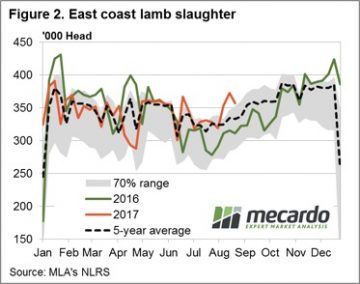
 During this period in the wool market, it seems to be performing as a more predictable beast than usual. Market rallies strongly – growers sell – buyers lose orders because market is “too hot” – market retraces – growers pass-in higher levels – market recovers – buyers receive increased orders – market rallies …….. repeat!!
 The underlying story for this week however is positive, the market opened on Wednesday with “red ink” across the board, but a reversal on Thursday was clear, with gains of 10 – 20 cents across all microns and the market finishing on a positive sentiment.
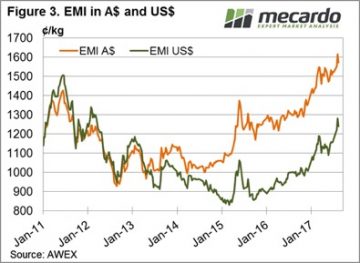 Next week 42,872 bales are rostered (Figure 2). The pattern over recent months of correcting but quickly recover as growers hold wool back from sale was again in evidence this week. This suggests that next week will see a continuation of the positive sentiment evident towards the end of this weeks sales.
 Technical analysis isn’t a strongpoint, but we do know that when the pace of a rally, or a decline, slows, the market is usually getting close to changing direction. Over the 12 weeks to last Friday the EYCI has fallen 112¢ at a rate of 9.3¢ per week (figure 1).
 Weakening prices amid weakening supply is a pretty good indicator of weaker demand. For young cattle we can blame restockers, who have pulled back after driving the market for two years. For finished cattle the abundance of cattle on feed is helping to keep a lid on finished cattle values.
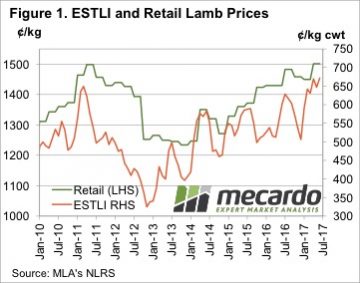 The sharp rise in saleyard and over the hooks lamb prices in the first half of 2017 took a while to translate into strong retail lamb prices, but it did eventually push them to a record. The average retail lamb price increased 51.77¢, or 3.6%, to move to 1501.37¢/kg rwt.
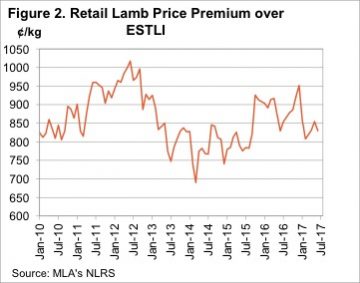 Things are a bit different this time. Obviously in real terms lamb remains cheaper than it was in 2011, and compared to its main red meat competitor it is not yet in the expensive range. Figure 3 shows retail beef prices remained strong in the June quarter, and despite the rise in lamb values, beef it still at a 22% premium. In 2011 the beef premium shrunk to just 4%, and this put considerable pressure on lamb demand.
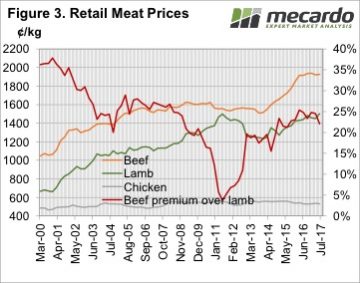 There remains some concern in the expensive red meat prices relative to static cheap chicken prices, and this is being borne out in consumption levels.
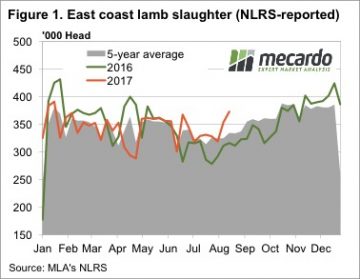 Markets can sometimes defy even the most rusted on seasonal trend. A couple of anomalies caught our eye this week. Figure 1 shows the massive jump in lamb slaughter over the last two weeks, to the point where for the week ending the 18th August, we hit its highest level since the third week of 2017. In fact lamb slaughter last week was the third highest for the year.
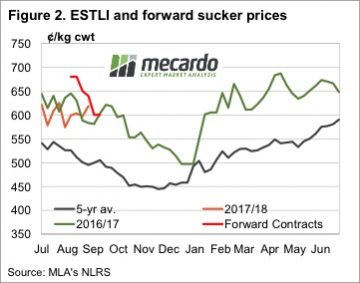 There has been some talk around about slow lamb growth rates impacting on the supply of finished lambs early in the selling season. While this could explain continued strong prices, the high slaughter rates suggest supply is ok, and demand may be pushing prices higher.
 The optimism that was evident following the last two weeks of strong wool market sales suffered a reality check this week. With the market only selling in Melbourne & Sydney, and with the sale conducted on Tuesday & Wednesday due to “Wool Week” activities, it was a sharp correction across all types that occurred.
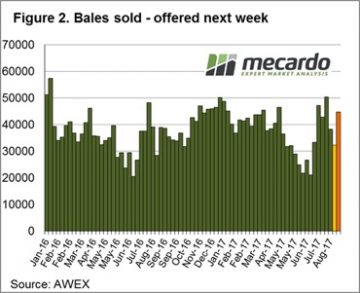 The response from growers was to pass-in14% of the offered wool, resulting in 32,342 bales sold for the week, well down on the average for this season. It is an interesting situation with the market trading at historic highs and yet we have a pass-in rate that is high by any measure. Growers are clearly comfortable holding out, despite these historically good prices, suggesting their not too concerned that any major correction will occur in the near future.
 Next week Fremantle rejoins the selling roster and 44,750 bales are rostered (Figure 2). The pattern over recent months has been for the market to rally, then correct but quickly recover as growers hold wool back from sale. This is likely to be the pattern going forward so next week there is an air of optimism from sellers that we can see the market at least hold.