Tag: Beef

Dead cat bounce or finding base

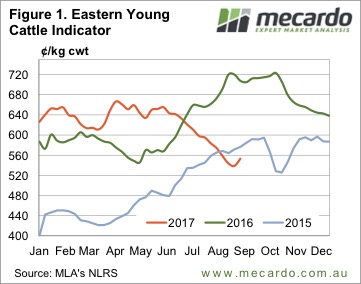
Young cattle prices gained some ground this week, for the first time in some while.  The Eastern Young Cattle Indicator (EYCI) has fallen for 12 weeks without any real break.  This week the break came, with the EYCI gaining 14¢ to move back to 553¢/kg cwt.  Is it a dead cat bounce or a sustainable rally?

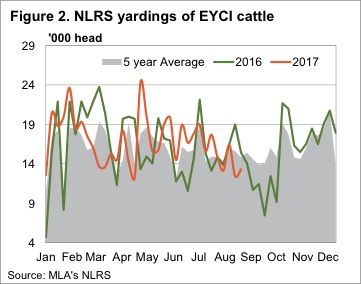
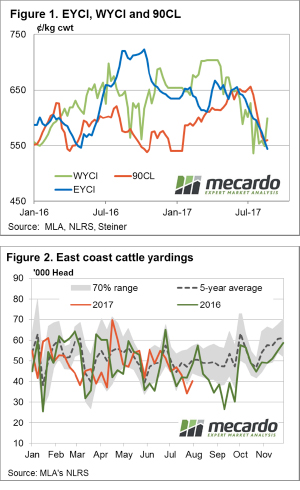
Figure 1 shows the bounce in the EYCI, going back to the level of 3 weeks ago.  We can see in figure 2 that EYCI yardings have been low for a couple of weeks in a row, which seems to have been enough to see buyers competing a bit harder and pushing prices higher.

Young cattle weren’t the only category to gain ground.  Heavy steers in Queensland and NSW rallied to 480 and 514¢/kg cwt respectively.  While Heavy Steer prices in Victoria didn’t rise, they in fact fell 17¢, they remain at a premium to northern states, at 522¢/kg cwt.
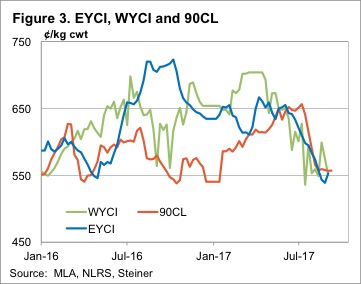
The 90CL Frozen Cow price has tracked sideways for the fourth week in a row and both the EYCI and Western Young Cattle Indicator (WYCI) have met it at around 555¢.  Figure 3 suggests it’s hard to argue that falling beef export prices aren’t driving the cattle price.

This time last year the 90CL was around 570¢, while the EYCI was at 707¢/kg cwt.  This is a good indication of the extraordinary restocker demand we saw last year, which this year has basically returned to normal, seeing cattle prices match the export price again.

The week ahead

It’s going to rain in southern parts of Victoria and South Australia, but nothing to speak of in the north.  As such we’re not going to see demand pick up for young cattle.  Additionally, the supply of grainfed keeps coming out of the record numbers of cattle on feed, and that’s not going to change in a hurry either.  As long as the export price holds, there is a good chance prices have found a base for now, with the next test coming in October.
What in the hell is the 90CL?

Key points:

  • The term 90CL describes how lean, in chemical percentage terms, a pack of meat is. 90CL refers to meat that is 90% lean red meat and 10% fat.
  • Monthly fluctuations in the 90CL closely follow the price pattern set by US Live Cattle futures.
  • Movements in the A$ can have an impact on how the 90CL fluctuations flow through to added support or pressure on local cattle prices.

At Mecardo we regularly refer to the 90CL frozen cow indicator as a key beef export price benchmark when undertaking analysis of the domestic market prices in relation to overseas markets. This is because a strong long-term correlation exists between indices like the Eastern Young Cattle Indicator (EYCI) and the 90CL. We often get asked to explain what the 90CL actually is and what influences its movement – this will be addressed in this piece.
The abbreviation CL refers to the term chemical lean which measures the amount of lean red meat compared to the amount of fat in a sample of meat, using an approved method chemical analysis. The CL of meat being analysed includes a ratio of meat to fat as a minimum percentage, for example 90CL, where 90% of the pack will be lean red meat and 10% of the pack will be fat. Much of the frozen 90CL product imported into the USA from Australia finds its way into the meat grinding process where the lean 90CL is combined with the 50CL US fat trimmings to make the iconic 75CL American burger meat patty.

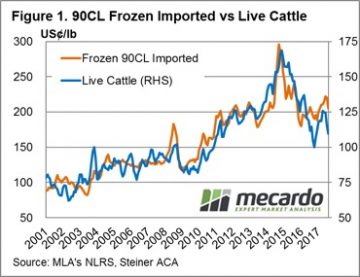
Therefore, it should come as no surprise that the influence of the broader US cattle market on the price of the 90CL is fairly strong. Indeed, as highlighted in figure 1, the movement of US Live Cattle futures is closely mirrored by the movement in the 90CL. Analysis of the monthly average price of US Live Cattle to the 90CL since 2001 shows a correlation measure of 0.9139 which suggests that nearly all of the movement in the 90CL can be explained by the fluctuations of the US Live Cattle market.
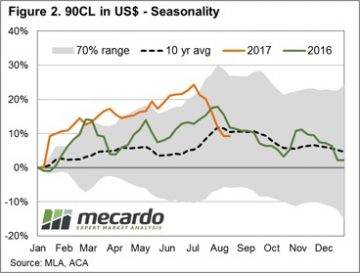
The 25% gain in US Live Cattle futures experienced since October 2016 had been mirrored in the progress of the 90CL in US$ terms this season – figure 2. In recent months drought effected parts of the American mid-west have seen Live Cattle prices ease 13.4% toward 109US¢/lb, subsequently the 90CL in US$ terms has also eased by a similar proportion, dropping 11.9% to 200US¢/lb.

What does this mean?

Compared to current US Live Cattle levels the 90CL in US terms seems a little overvalued, and the normal annual pattern heading into the remainder of the season shows that the 90CL usually begins to decline beyond the US grilling season peak around July/August.
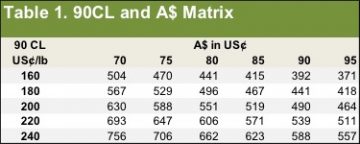
However, the local price impact of any price decline in the 90CL in US terms will depend upon what is in stall for the A$ for the remainder of the year. As outlined in Table 1, which shows the relevant 90CL in A$ terms for a selection of pricing scenarios, any softening of the A$ will act to support local prices while further appreciation will act as a headwind.

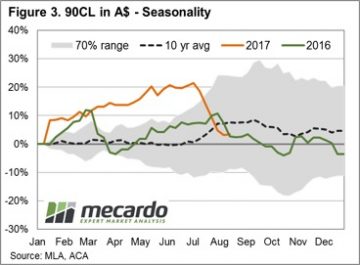
In addition, the relative movement of the A$ can act to offset or exacerbate 90CL fluctuations. For example, the recent decline in the 90CL was exacerbated by an appreciating A$ over the same time frame such that the 90CL in A$ terms declined by a greater magnitude, shedding 14.7% to 559¢/kg – figure 3.

Rain helps support Victoria and WA

National Trade Steers holding up reasonably well this week, supported by price lifts in Queensland, as most other categories of cattle take the lead of the Eastern Young Cattle Indicator (EYCI) and continue to probe lower. Although, prices out West and in Victoria buck the trend as continued rain provides a bit of support.
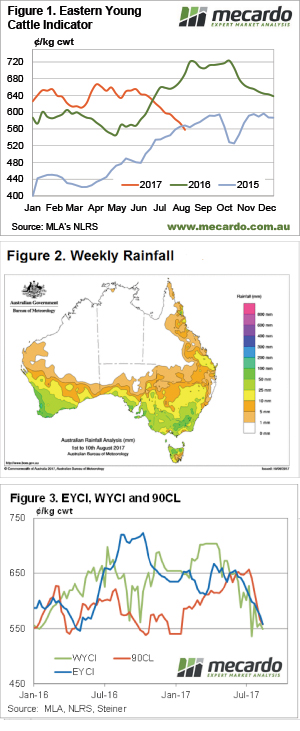
Figure 1 highlights the 9.2% lift in the Western Young Cattle Indicator (WYCI), a solid recovery but not as strong as WA cows, with Heavy Cows up 12.7% to 188¢/kg lwt and Pastoral Cows posting a 26% increase to 110¢/kg lwt. In contrast, the EYCI continued its slide to shed 2.6% on the week to close at 543.5¢/kg cwt, while the 90CL frozen cow was largely unchanged at 559¢/kg CIF. National saleyard indicators all softer, with the exception of Trade Steers, posting a 1.1% gain to 568¢/kg cwt. The biggest falls in the national market reserved for Medium Cow and Heavy Steers, off 5.3% (393¢/kg cwt) and 4.6% (497¢/kg cwt), respectively.

A 17% lift in East Coast cattle yardings noted, although it must be noted coming off a fairly low base from last week, to see just over 40,000 head change hands – figure 2. Comparing the weekly cattle throughput figures on a state by state basis showing relatively higher yarding levels in Queensland persist, with figures here just 8% below the five-year average levels for this time of the season. In contrast, compared to their respective five-year average levels, NSW throughput is 20% under, Victorian yarding sits 36% below and SA is 40% below.

The week ahead

The rainfall distribution we have seen over the last few weeks continues again for the week ahead, with much of NSW and all of Queensland missing out, while Victoria and parts of WA continue to get a soaking. National cattle price movement likely to remain in a consolidation phase as softer prices in drier areas are offset by firmer prices for those regions enjoying some rainfall. The stabilisation of the 90CL in the last few weeks also likely to lend some support to the EYCI in the short term.

This was a good price in 2015

The slide in cattle prices continued this week, with more help from lower export prices, pushing the EYCI back to two year lows for this time of year. Rainfall across NSW and Victoria doesn’t seem to have helped the cause yet, as supply continues to outweigh demand.
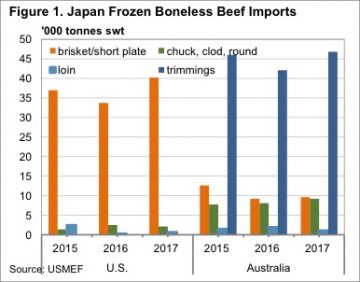
After only recently falling below 2016 levels, the Eastern Young Cattle Indicator (EYCI) this week eased below 2015 levels. The two year low puts the EYCI a very large 134¢, or 19% below the levels of this time last year.

Obviously when the EYCI reached 560¢ back in July 2016, it was happy days for cattle producers. This year prices are still ok, but given they have fallen 14% in 12 weeks, at a time of year when they normally rise, has taken the market by surprise.

There was also some decent rainfall around this week, and for August to date (figure 2). This hasn’t at all translated into any demand, as young cattle prices continue to ease even though yardings haven’t been anything extraordinary.

The 90CL price continued to fall this week, losing a further 10¢ in AUD terms. This is no doubt helping to drag cattle prices lower, as it’s now also lost 14% in 12 weeks. Weakening demand for 90CL beef in the US is apparently the driver, with foodservice not doing so well.

Positives in the cattle market were hard to find this week. The National Heavy Steer Indicator gained 15¢ to move back to 521¢/kg cwt. This was despite the Queensland indicator sitting at 494¢, and there being no quote from any other state.

The week ahead

We are still waiting for cattle prices to find a floor after this very abnormal decline. It’s hard to know if the market will experience a normal spring decline from there, or whether there will be some rain and a subsequent price rise.

Despite the falls in the 90CL export price, there is a little room for upside, especially if the Aussie dollar does the right thing, and it rains.

Japanese tariff hike supportive but not game changing

The last week has seen some interesting events in the international beef trade.  The good for Australia was the increasing of tariffs on US frozen beef exports to Japan.  The bad and the ugly was the Chinese temporary ban on beef and lamb exports from six Australian meat processing plants.  We’ll try and make some sense of how the Japanese tariffs might impact on cattle prices, China will have to wait until next week.

The background to the Japanese tariff increase for US frozen beef is a lot to read.  The gist of it is that the year on year increase in imports of US frozen beef for the April to June period was large enough to trigger Japan’s ‘safeguard’ mechanism, and send tariffs for that segment of the market from 38.5% to 50%.

According to the US Meat Export Federation (USMEF), who have produced an excellent fact sheet, a vast majority of US frozen beef exports to Japan are grainfed brisket and short plate cuts.  These cuts are used in gyudon beef bowl chain restaurants.
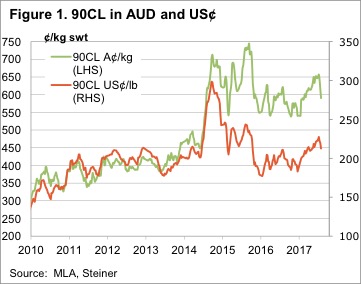
Australia’s frozen beef exports to Japan are made up primarily of grassfed trimmings, as shown in figure 1, with brisket/short plate cuts at just 26% of the US volume.  It’s not as simple as increasing prices of US beef shifting demand for that type of cut to Australia, as we simply don’t have that amount of beef available for export.

The likely result of the increase in US tariffs is stronger demand for brisket and short plate cuts from Australia, and higher prices, while US processors will receive lower prices, to account for the tariff increase.  Japanese consumers are likely to suffer as some of the increase is passed onto them.

The USMEF have also outlined the risk of a shift to chilled brisket and short plate imports, which could trigger the safeguard for US chilled beef.  Chilled beef makes up 55% of US exports to Japan, so to trigger the safeguard on this would be even more disastrous for US beef.

Key points:

  • Japan have triggered a safeguard increase in tariffs on US frozen beef imports.
  • Most of the frozen beef the US export to Japan is short plate or brisket, a smaller part of Australian exports.
  • The increase in US tariffs will be supportive of our beef export prices to Japan, but unlikely to have too much impact at saleyard level.

What does this mean?

The USMEF calculate that the tariff increase will equate to an effective 8% increase in the price of US frozen short plate/brisket.  The best case scenario for Australian beef exporters is an 8% increase in frozen brisket cuts.  Brisket cuts generally account for around 10kgs of beef in an export slaughter animal.  The latest quote from MLA for frozen brisket to Japan was 598¢/kg, an 8% increase would add 48¢.

The net result on a heavy steer would be $4.80 per head in increased value.  Not a huge benefit, accounting for just 1.5¢/kg cwt.  There is likely to be some spinoff benefits for other beef categories, as higher prices cause some demand shift towards chilled and other frozen cuts.

Heavy slaughter cattle should find some support from higher prices triggered by the increase in US tariffs, but it’s unlikely to outweigh too many of the headwinds the market is currently facing.

Is there any good news for cattle markets?

A quick glance at Meat and Livestock Australia’s (MLA) ‘Market Insider’ on Thursday afternoon would be enough to come to the conclusion that we are headed back to 2013 price levels.  It’s not that bad, but there is plenty of downside pressure coming on the market.

The first story states that US herd expansion is continuing.  The latest numbers on the US cattle herd from the United States Department of Agriculture (USDA) put the herd at 102.6 million head.  This is a 6 year high, and up 7 million head from the 2014 low. The US have added the equivalent of 25% of the Australian herd in just 3 years.
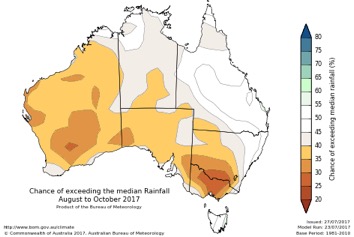
The second story is on beef export prices to the US.  This week they fell 7¢/lb in US terms, or 21¢/kg in our terms.  Figure 1 shows that it took three months for the 90CL to gain 50¢ in our terms.  It takes just two weeks to lose it as issues in Asian markets, and expectations of stronger supplies drive the heavy fall.

Obviously the rising Aussie dollar, which went through 80¢ yesterday, has a bit to do with weaker export prices.  This was the third story on the ‘market insider’.

All this has no doubt contributed to the fourth story, weaker grid prices in Queensland, which has the Heavy Steer 53¢, or 10% below the same time last year.

Finally, we come to the fifth story, which is more of the same on the weather forecasting front (Figure 2).  While key cattle areas of Queensland and Northern NSW are back at a 50:50 chance of getting more than the median rainfall, the dry is forecast to continue for southern NSW and much of Victoria.
The week ahead

While there is plenty of bad news, the good news is that cattle prices remain anything but disastrous. The lower 90CL prices this week brings it into line with the EYCI, despite it falling further to 583¢/kg cwt.  The EYCI is now not far off falling below the 2015 price line, and it is strange for it to continue to fall at this time of year.  There is a reasonable chance the market will find a base soon.

Live export market share and price relationships

It has been some time since we had a look at live cattle exports so we thought it timely to focus in on the changing market share of the live cattle trade among the key export states, along with the price relationships that exist between live cattle and domestic young cattle.

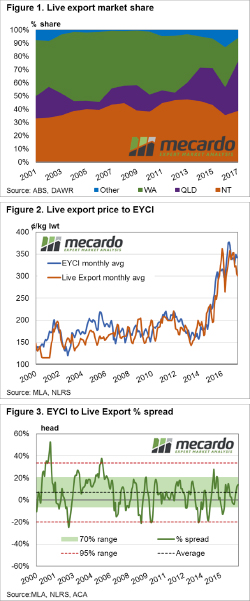
Figure 1 outlines the percentage of market share in volume terms that are attributed to the three largest exporting states for live cattle, namely the Northern Territory (NT), Queensland and WA. Historically, NT and WA have held the lion’s share of the trade volumes over the last two decades. NT market share has been relatively stable fluctuating between the seasons from 35-45% of the total trade volume. In the last five years there has been a noticeable expansion of volume exiting Queensland. Indeed, for much of the period from 2001 to 2013 Queensland accounted for 10-20% of the trade. However, in recent times the proportion of live cattle leaving Queensland has extended toward the 25-30% range.

Turning our attention to price movements we can see a fairly strong relationship between average monthly EYCI prices when compared to a Live Export Index (created by averaging the live weight prices per month out of the ports of Broome, Townsville and Darwin). Analysis of the correlation between the monthly EYCI and the Live Export Index shows a correlation co-efficient of 0.83, which is indicative of a reasonably strong relationship between the two-price series. The correlation in price movement increases to 0.94 when the two-price series are compared on an annual average basis.

Analysis of the historic monthly percentage spread between the EYCI and the Live Export Index shows the EYCI to Live Export long term average spread sits at a premium of 7% and spends 70% of the time fluctuating between a 6.5% discount spread to a 20% premium spread (green shaded zone – figure 3). The red dotted lines highlight the 95% range between a 20% discount spread to a 33.5% premium spread, indicative of the extreme ends of the historic range.

What does this mean?

Analysis of seasonal live cattle trade flows shows that volumes out of Queensland tend to peak in the first quarter of the year, while WA peaks mid-year and NT peaks at the end of the season. This would suggest that the current market share of volumes out of Queensland at 28% is likely to diminish slightly as the year progresses and volumes out of WA and NT expand.

The current percentage spread of EYCI to Live Export prices sits at a 14% premium, and within the 70% range banding, which indicates that price levels for the two data series are comfortably within the “normal” range and suggests that neither price is too far over or undervalued in comparison to the other.

Key points:

  • Live cattle volumes exiting Queensland has shown steady growth in percentage market share in the last five years.
  • Movements of the EYCI and Live Export cattle prices show a close relationship over both monthly and annual average comparisons.
  • The EYCI tends to sit at an average premium spread to Live cattle prices at around 7%, but can fluctuate between a 20% discount to a 33.5% premium, dependent upon the season.