Tag: Business

A rocket to the moon, or even beyond the Kuiper belt?

Well this is good news, wheat is on a journey to the moon, and at this rate beyond the planets. The downtrend of the past week has been reversed in dramatic fashion, is this a sign of things to come?

It’s the middle of the weather market, and as we have mentioned for months this is where opportunities can arise when the trade gets jittery. Overnight we saw futures close up across the board, with US futures up 5%, and Matif following up 2%.

The market has rallied on the back of continuing bullish data being release to the market, with the US drought monitor showing large parts of the Great Plains being in a rainfall deficit, and a corresponding drop in the crop potential. In Canada, canola planting according to Statscan have exceeded wheat, as a result of more attractive gross margins on the oilseed.

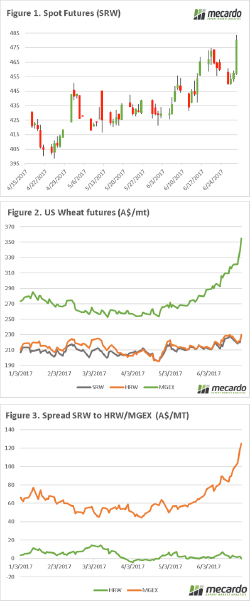
In figure 1, we can see the rise in nearby Chicago SRW futures, the rise was so high that I had to change my scale this morning to fit it on the chart. The spot contract has not been at this level since mid-June last year, before it fell as production became sure. As we go through the next month, how will the weather impact on the crop?

The rise in SRW has been fantastic, and most welcome to farmers around the world. However, it is dwarfed by the Minneapolis spring wheat contract which has been a stratospheric rise the like of which has been seen for a long time. In figure 2, we can see the SRW, HRW & Mgex contract converted into A$/mt since the start of the year.

The spread between SRW and HRW/MGEX is shown in figure 3, and it currently sits A$124 above spot SRW. This is due to the expected shortage of hi-pro wheat, will this rise be sustainable and make it past the moon, and beyond the Kuiper belt or will it crash back down to earth?

Next Week

The USDA will release their quarterly grain stock reports, will this show a downturn in US stocks or has less been used than expected. This report has traditionally had the capacity to move the markets markedly.

All strategies must evolve to take into account the potential average-low production environment in the coming season. There is no point removing price risk in order to replace it with production risk.

Live export market share and price relationships

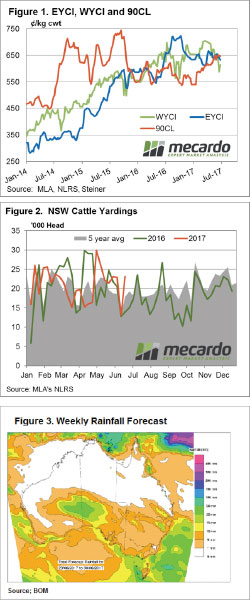
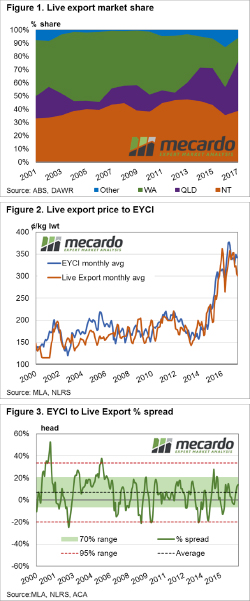
It has been some time since we had a look at live cattle exports so we thought it timely to focus in on the changing market share of the live cattle trade among the key export states, along with the price relationships that exist between live cattle and domestic young cattle.

Figure 1 outlines the percentage of market share in volume terms that are attributed to the three largest exporting states for live cattle, namely the Northern Territory (NT), Queensland and WA. Historically, NT and WA have held the lion’s share of the trade volumes over the last two decades. NT market share has been relatively stable fluctuating between the seasons from 35-45% of the total trade volume. In the last five years there has been a noticeable expansion of volume exiting Queensland. Indeed, for much of the period from 2001 to 2013 Queensland accounted for 10-20% of the trade. However, in recent times the proportion of live cattle leaving Queensland has extended toward the 25-30% range.

Turning our attention to price movements we can see a fairly strong relationship between average monthly EYCI prices when compared to a Live Export Index (created by averaging the live weight prices per month out of the ports of Broome, Townsville and Darwin). Analysis of the correlation between the monthly EYCI and the Live Export Index shows a correlation co-efficient of 0.83, which is indicative of a reasonably strong relationship between the two-price series. The correlation in price movement increases to 0.94 when the two-price series are compared on an annual average basis.

Analysis of the historic monthly percentage spread between the EYCI and the Live Export Index shows the EYCI to Live Export long term average spread sits at a premium of 7% and spends 70% of the time fluctuating between a 6.5% discount spread to a 20% premium spread (green shaded zone – figure 3). The red dotted lines highlight the 95% range between a 20% discount spread to a 33.5% premium spread, indicative of the extreme ends of the historic range.

What does this mean?

Analysis of seasonal live cattle trade flows shows that volumes out of Queensland tend to peak in the first quarter of the year, while WA peaks mid-year and NT peaks at the end of the season. This would suggest that the current market share of volumes out of Queensland at 28% is likely to diminish slightly as the year progresses and volumes out of WA and NT expand.

The current percentage spread of EYCI to Live Export prices sits at a 14% premium, and within the 70% range banding, which indicates that price levels for the two data series are comfortably within the “normal” range and suggests that neither price is too far over or undervalued in comparison to the other.

Key points:

  • Live cattle volumes exiting Queensland has shown steady growth in percentage market share in the last five years.
  • Movements of the EYCI and Live Export cattle prices show a close relationship over both monthly and annual average comparisons.
  • The EYCI tends to sit at an average premium spread to Live cattle prices at around 7%, but can fluctuate between a 20% discount to a 33.5% premium, dependent upon the season.

Soft prices a tale of the weather and supply

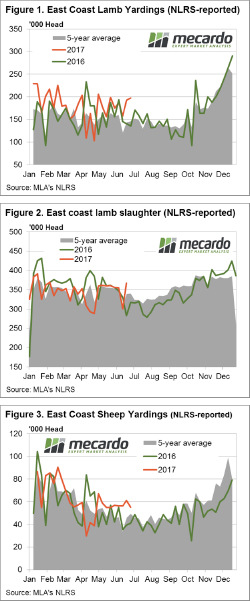
On the radio in today the weather report included a brief from BOM saying that June has been the driest in Victoria since records began and its taking its toll on the price of lamb and sheep. East coast figures show price falls in all categories other than Restocker lambs on the week and Light, Heavy and Trade lambs are now trading lower than this time last year.

The Eastern States Trade Lamb Indicator dropped 3.8% this week to close at 625¢/kg cwt and National Mutton shaved off 5.7% to see it at 467¢/kg cwt. East coast supply metrics providing a clue to the weaker prices with lamb and sheep throughput and slaughter tracking well above last season and the longer-term average levels for this time in the year. Drilling into the figures on a state by state basis shows that NSW is leading the pack in bringing forward supply.

East coast lamb throughput up 2.5% on the week to over 197,000 head, and while the weekly change isn’t too earth shattering a look at the trend compared to this year and the five-year average shows it to be 35% higher than it normally is this time of year – figure 1. NSW lamb yardings are currently sitting 50% above the five-year average, with over 138,000 head going to the saleyards this week, clearly having an impact on the East coast figures.

A similar pattern displayed in lamb slaughter for the week ending 23rd June with a jump in head of 22% to just over 367,000 this week – figure 2. NSW, again the key state behind the surge with a 26% lift in lamb slaughter on the period. East coast mutton yardings levels dipped on the week, but remain persistently high when compared to this time last season and against the five-year average, figure 3.

The week ahead

A look at the rainfall forecast for the next week doesn’t hold much promise for a surge in prices with the best falls noted out at sea across the Great Australian Bight, Bass Straight and the Tasman Sea. The Tasmanian West and North-west will get some reasonable levels and parts of the WA, SA and Victorian coastline look promising, but for much of the sheep rearing regions it is going to be pretty light on. Happy end of financial year.

It’s a rare thing for cattle prices to fall in June

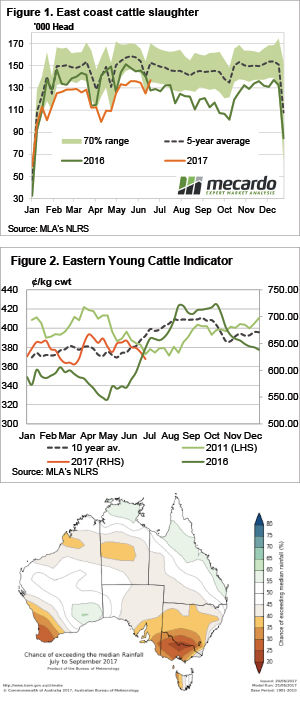
Here’s a quiz question. When was the last time the Eastern Young Cattle Indicator (EYCI) finished June lower than it started? You’ll have to read the article to find out….

Young cattle markets continued to slide this week, the EYCI dropped another 12¢ to finish the week, and the month at 621¢/kg cwt. Dry weather and historically high prices appear to be driving cattle to market as a time when supply is usually tightening.

Nothing exceptional is happening with cattle yardings, they were down a touch this week, and largely in line with the same week of the last two years. Cattle slaughter is doing strange things however. In the week ending last Friday, east coast cattle slaughter reached a peak for 2017, setting a 7 month high.

Figure 1 shows MLA’s weekly cattle slaughter figures hitting 137,019 head, 7% higher than the same week last year. It was also the first time weekly slaughter had been higher than the previous year since this exact week back in 2015.

If something sounds familiar, but backwards, it’s because we have been banging on in recent weeks about prices falling below the same time last year for the first time. It was the EYCI’s turn this week (figure 2), posting a lower price than the same week in the previous year for the first time since March 2014.

It’s always a nice fit to see stronger supply than last year equating to weaker prices. It tells us demand is relatively steady, with price being governed by supply.

The week ahead

The answer to the question is given away in figure 2. In 2011 the EYCI finished June lower than it started, by 24¢. This year it was 34¢. It also happened in 2003, so that’s 3 out of 18 years cattle prices have fallen in June. It’s not a regular occurrence. The good news for cattle producers is that in 2011 prices levelled out, but figure 3 shows this might just be the start of the slide.

The season ends on a downer

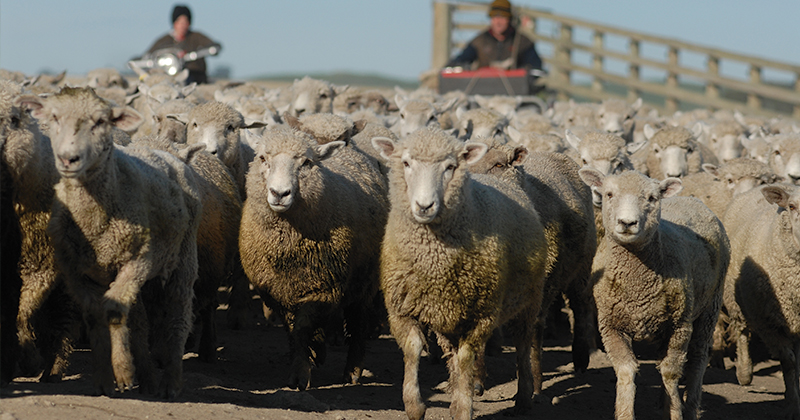
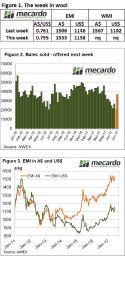
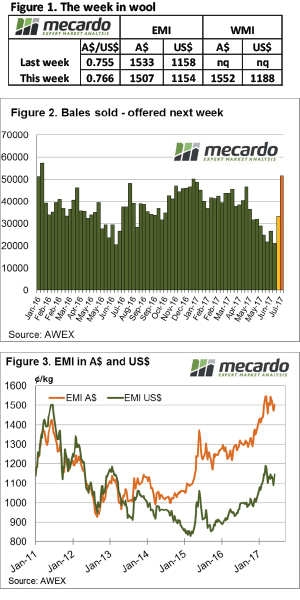
The fragility of the wool market was evident this week in what was the final sale for the financial year where increased supply (Fremantle back selling again) and a rising A$ pushed all types lower however, the strong Crossbred types showed some resilience. The EMI shed some weight nearing 1500¢, down 26¢ to 1507¢ and also falling a more modest 4US¢ to 1154US¢.

The return of Fremantle resulted in 37,000 bales offered, a big increase from the smallest offering for the year last week.

The take home positive was in the overall result of the wool market for the year, with AWEX reporting that it was the highest season ending level on record. The average for the EMI in 2016 – 17 was 1401 cents, 147 cents (+11.7%) above the 2015/16 season average.

Again, it was evident that buyers became more selective with an increased volume of wool, and once again it was the lessor style and faulty types that were most effected. There is a strong argument that the poorer lines in the clip require the most attention when selling, strategic price reserves and advice from the selling broker will pay dividends.

The week ahead

Next week the market sees all centres selling with almost 52,000 bales on offer as growers bring forward wool that was held over from the last financial year.

Based on recent supply and price relationships this increased volume will test the market; and it will also probably mean that growers will respond by passing-in an increased number of bales.

Turnaround Thursday (at least partially)

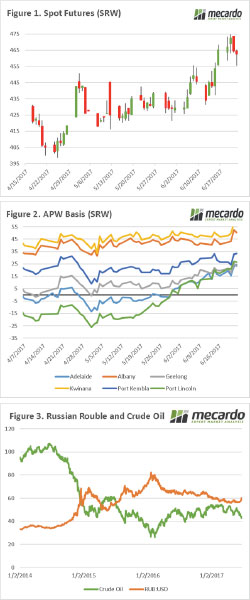
There has been a slight turnaround in the market, but overall prices are substantially more attractive than they have been in the post-harvest period. In this week’s commentary, we examine the potential impact of crude oil on Australian wheat, and why we should be aware of it.

There has been a welcome (for sellers) rally in the wheat futures over the past fortnight (figure 1), as a result of weather woes in the US. Overnight however the market performed a partial flip and dropped around 2%. The trade will be watching the weather with close eyes, especially as Russian crops look to again be in good condition. This factor, combined with a depreciating rouble (more on that later), is likely be putting some caps on futures for the next few days.

At a local level, there are still major concerns about the coming harvest which has led to a substantial rise in pricing. This has especially been seen with continuing strengthening in basis in Adelaide & Port Lincoln (figure 2).

In addition to supply concerns for the coming season, the growers are not surprisingly reluctant sellers. This has led to the market paying up to acquire some cover, however we need to be aware that if the concerns start to be alleviated, then the interest from the trade may diminish. There is still a long way to go until harvest, and we shouldn’t write off the crop at the end of June.

As we all know, foreign exchange plays a factor in commodity trading. The Russian economy is largely dependent on oil revenues, and is also a major competitor for Australian wheat. In figure 3, we have charted the Rouble against the US$, and the price of crude oil since early 2014. This period has seen a reduction in crude oil prices, which has led to a weakening of the Rouble, the correlation between the two is almost perfect at -0.96.

The oil price in recent weeks has started to slide again, and the market remains bearish which has resulted in a further deterioration in the Rouble. If the fall in oil continues, then by proxy Russian wheat will become more competitive on the market.

Next Week

Like a broken record, the trade will largely be concerned with weather events in the northern hemisphere. As the days flow, any weather risk premium in the market will lessen unless we see some major production failures.

We still have to keep into account that even when excluding Chinese wheat stocks, the world still has considerable supplies.

Queensland outshines NSW

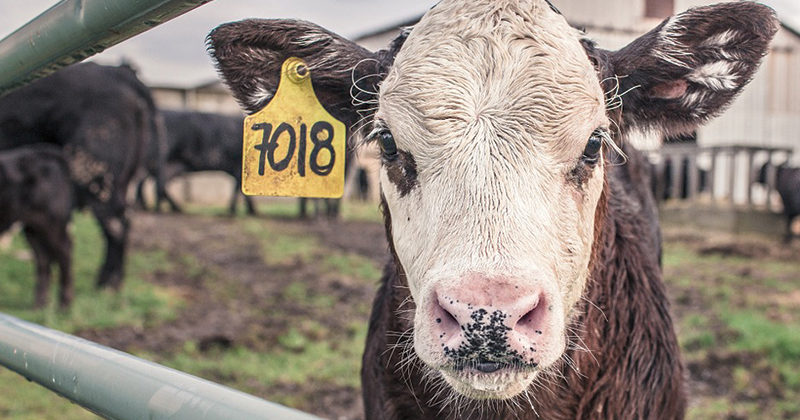
A good recovery staged by Queensland across the board, while NSW disappoints… no I’m not talking about the State of Origin – although the phrase fits there too! Actually, it’s the cattle market this week. Despite the national market indicators posting largely flat results, with weekly moves of less than 2% either way some state based indicators saw more substantial action.

The headline Eastern Young Cattle Indicator (EYCI) mirroring the national saleyard indicators with a minor retracement of 1.3% to close at 633.25¢/kg cwt, yardings of EYCI cattle up 22% on last week a potential reason for the softer prices. In contrast, young cattle price in WA recording an impressive 4.5% gain to close at 615¢/kg cwt and the key export indicator, the 90CL frozen cow relatively flat on the week, dropping just 1¢ to 646.8¢/kg CIF – figure 1.

Big winners in Queensland (other than the Cane toads) were Trade Steers, with a 13% lift to 336¢/kg lwt. The remaining QLD indicators up too (0.5-4.5% increases) with the exception of Medium Cows at 214¢/kg lwt, a fall of 1.6%. NSW saleyard indicators all softer this week, with falls ranging from 1-3%. NSW Medium Steers showing the biggest live weight percentage price drops, down 2.8% to 298¢/kg. A bit of a mixed bag for Victoria, with Feeder Steers down 3% to 325¢/kg lwt and Medium Steers up 5.7% to 315¢/kg.

Increased weekly throughput a potential reason for the broad price falls in NSW with yardings up 76% on last week and 29% above the long-term average for this time of year to see over 23,000 head change hands – figure 2. Perhaps the extended dry spell is starting to have an impact on supply and effecting the normal seasonal winter price rally. In case you missed it, Thursdays analysis piece on Mecardo takes a look at the potential impact of continued dry weather event and is worth a read.

The week ahead

The rainfall forecast for the week ahead showing some much-needed moisture to SA and lighter falls to the much of the South, but most of the decent stuff concentrated in the Tasman Sea. It is unlikely these falls are going to put a rocket up cattle prices this week but might be enough to continue to encourage consolidation at current levels. Although I’m Melbourne born maroon blood flows through my veins so eyes focused on the final State of Origin in just over a fortnight to see if the Toads can stage another upset.

What to expect if it stays dry

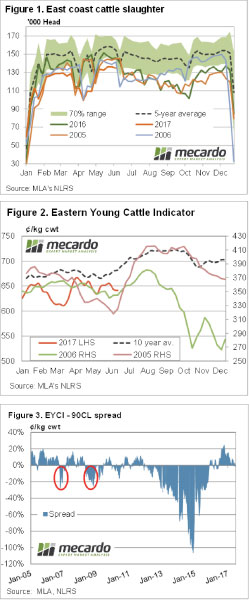
Whether or not you believe the Bureau of Meteorology (BOM) three month forecast, there is always the chance the current dry spell could continue. Dry winter’s and springs are not great for cattle prices, but given the current historically strong values, how bad could it get?

The usual impacts of a dry winter and spring are relatively predictable. Cattle producers usually hold out on selling cattle until past the point of no return, while grain prices inevitably rise. Come mid spring there is a rush to offload stock, while demand has weakened, leaving prices in freefall.

To work out where prices might end up, we can take a look historical slaughter during dry times, and associated prices. Obviously fundamental price levels have changed somewhat since the most recent dry spring, but we can try and account for this and come up with a base level for cattle prices.

The 2005 and 2006 seasons are a reasonable template for the market to follow. In 2005 cattle markets reached record highs on the back of strong demand, and a herd rebuild restricting supply. The following year saw cattle supply track in much the same way, before diverging in mid-August (figure 1).

For the last five months of 2006, slaughter was up 16.5% on 2005 levels. The impact on price was dramatic. The Eastern Young Cattle Indicator (EYCI) peaked in mid-August, and as the dry set in, subsequently fell 25.1% to bottom out twice, in October and December.

We can’t really use a 25% fall as the benchmark for price declines in a dry winter or spring. But we can use the 90CL price, and the discount the EYCI reaches, to estimate how low prices might go. Figure 3 shows the long term EYCI spread to the 90CL Frozen Cow Indicator. Before the massive discounts of 2013-2016, the biggest the EYCI got to the 90CL was 20%.

Key points:

  • There are some concerns emerging on around dry weather which could possibly continue.
  • Historically a dry winter and spring has resulted in a strong increase in cattle supply.
  • If the EYCI moves to a historical dry winter/spring discount, values could fall by 130-150¢.

What does this mean?

Figure 3 shows a few dry winter/spring periods when the EYCI has fallen relative to the 90CL indicator. Currently the EYCI is basically at parity with the 90CL price, and a 20% fall would shave 130¢ off the current value. Based on the current 90CL price of 648¢/kg, a 20% discount would give an EYCI of 518¢/kg cwt.

If the EYCI falls into the low 500¢ it would be the weakest price in two years. There is also a chance the 90CL could fall, which would obviously mean cattle prices could weaken further.

It could rain, and cattle prices could hold on to current strong values, but if the rain holds off cattle prices will fall significantly. This could be good enough reason for some to take the money on offer at the moment.

Other comments:

Include here any additional information or specific comments to ensure successful upload by the web manager


Lengthening days trigger weaker restocker demand

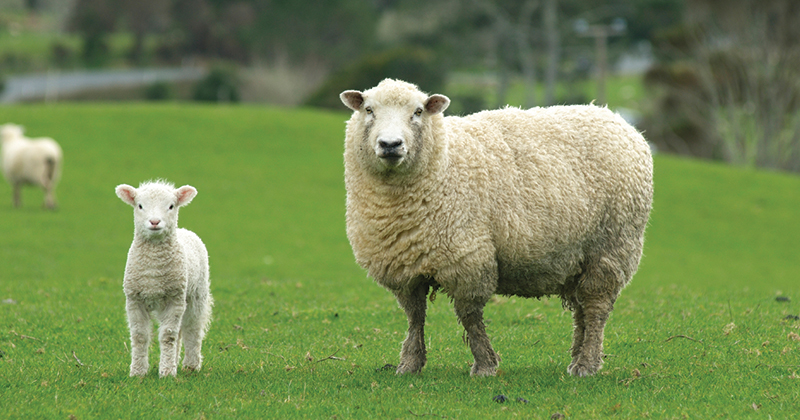
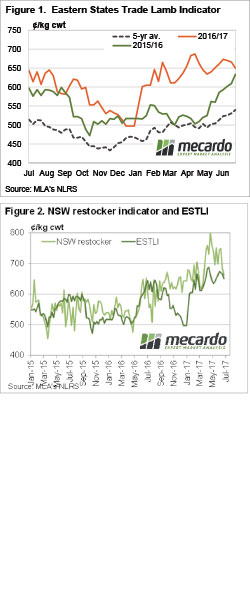
In general lamb prices were largely steady this week, but trends were mixed depending on category and state. With supply remaining relatively strong as we pass the winter solstice, and new season lamb supply fast approaching, the question is whether we have seen the peak.

After spending the best part of six months tracking well above last year’s prices, the Eastern States Trade Lamb Indicator (ESTLI) this week eased back to within 17¢ of the late June-16 value, at 650¢/kg cwt (figure 1).

We are yet to get hold of any supply figures for the last week, but anecdotally are hearing that there are plenty of heavy trade, and heavy lambs hitting the market at the moment. This is at a time when some major processors are winding down for winter shutdowns, thereby reducing demand.

Light and Merino lambs also fell this week, losing 16 and 25¢ respectively on the east coast. But it was Restocker lambs which were the major movers, falling 54¢ to 661¢/kg cwt. Figure 2 shows this is the cheapest restocker lambs have been since February.

It’s not unusual for restocker demand to ease at this time of year, as any lambs purchased could have to be marketed against new season lambs, and price declines can get ugly in the spring.

Mutton markets eased in line with trade lambs, losing 17¢ to move back to 504¢/kg cwt. Still a good price, and just 22¢ off the peak.

the week ahead

There shouldn’t be many old season lambs left out there, but they seem to keep coming. With only about six weeks until new season suckers come to the market, time is running out for the ESTLI to have a crack at 700¢. Forward contracts are still available for trade and heavy lambs at around 660¢ for August, so there is some concern around supply at that time of year. Given the price resistance being found at 700¢, it’s hard to see prices being much higher than this come August.


Demand up on limited supply plumetts

Again, the occasional, yet extreme demand for wool with good measurements (low mid breaks & good tensile strength) contributed to a mixed message out of this week’s wool market. The better types pushed the overall market to new levels while lower style wool battled to keep pace.

This week only Melbourne & Sydney were selling resulting in the smallest offering for the year at just over 22,000 bales. Buyers were active and purchased 21,104 bales although 5.4% was still passed in. The EMI improved A$0.27 for the week while the easing A$ resulted in a more modest US$0.12 lift.

Week–on–week comparisons showed that all categories (except 32 MPG) posted gains. However, in percentage terms it was again the medium Merino types that ended the week with the biggest lifts.

AWEX reported that the week just past was the lowest offering of Merino fleece types in over 8 years. This is reflecting the demise of Merino flocks over the recent time. As Mecardo has previously outlined, this is a concern for the long-term sustainability of the Australian wool industry as continued lower supply must translate into reduced processing capacity. Over time this will see wool continue to lose its position in the fibre market on volume. The challenge then will be to position wool as an even more niche product.

Impacting on the declining supply is the strong demand for sheepmeat resulting in lamb prices at record levels. As reported by Mecardo, with the big economies in Asia positioned to continue their appetite for Australian sheep & lamb encouraging sheep producers to continue their focus on meat this demand is likely to continue. Of course, a modern Merino flock is also taking good advantage of the high meat prices, so for those who have stayed the course with Merino sheep these are indeed good times.

The week ahead

Next week Fremantle returns to the selling roster and a larger offering of 37,000 bales is rostered – figure 2. It is with some confidence that wool growers should approach wool sales as a softening A$ and tight supply is encouraging wool processors to compete strongly.