
Another week, and another week of relatively flat prices for wheat. There was some upside for canola in international markets, which is providing some opportunity. There has been some talk around regarding CBOT wheat being primed for a spike, and there might be something in it.
 Earlier this week we took a look at some of the production data US wheat markets take note of, and there is also some data which shows how traders react. The CFTC Traders Summary tells us what type of trader holds long or short positions in CBOT wheat.
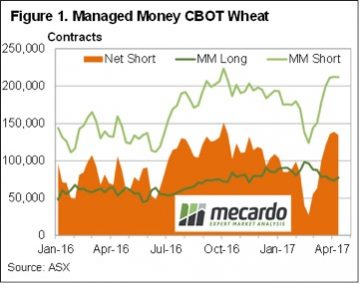
The most interesting data in the Traders Summary report comes from the Managed Money positions, where they report how many are long and how many are short. Figure 1 shows the Managed Money short positions have been climbing stronger, and sit close to an 18 month high. The Net Short, that is the number of short positions minus long positions, also sits close to a high.
This basically means that speculators are punting on wheat prices falling, as they are heavily sold. While this is the general feeling in the market, it does bring opportunity. If something does go wrong with production somewhere, there are a lot of sold positions which will need to be bought back in a hurry, which can add impetus to any price rally.
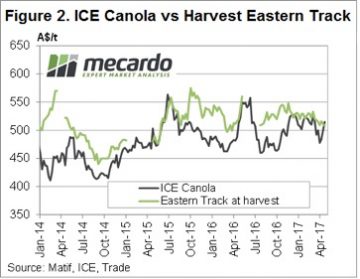 Canola has found some strength in Canada this week as wet weather delays sowing. The spot ICE contract rallied over $30 to $520/t, while Jan-18 gained $15 to sit at $497/t today. With the weather forecast not looking favourable for sowing, there could be some more upside for Canola.
The week ahead
With Anzac Day, and rain falling last week, conditions for sowing are almost ideal. Any grain growers who haven’t started yet will be well and truly underway next week, and old crop selling into delivered markets might slow. This could see some improvement in local basis, but I’m not sure I’d want to be a seller in 6 weeks’ time when growers look to quit some stocks.
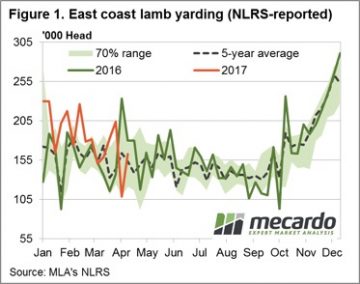 A rebound in East coast yardings post the Easter break, particularly out of NSW, sees the Eastern States Trade Lamb Indicator (ESTLI) take a breather this week. The ESTLI posting a 2.9% drop to 667¢/kg cwt. Not so for National Mutton, bucking the trend with a 1.9% gain to 495¢ – dragged higher by gains to Western Australian sheep.
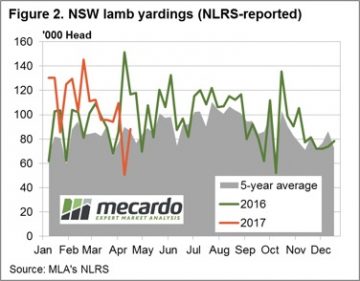 Despite the higher supply, restocker lambs in NSW and Victoria gaining some ground up 10.4% and 6.6%, respectively. NSW restockers now fetching $119 per head, while Victorian restockers are enjoying a $126 per head level. The higher NSW yardings having most impact on Heavy and Trade lambs in that state down 4.2% (641¢/kg) and 1.4% (656¢/kg), correspondingly. The two softest categories of Victorian lamb for the week were Merino, falling 5.2% to 616¢, and Light lambs, down 3.5% to 660¢. Trade lambs the star performer in SA, the only category of sheep in that state to post a gain this week, up 4.2% to 614¢.
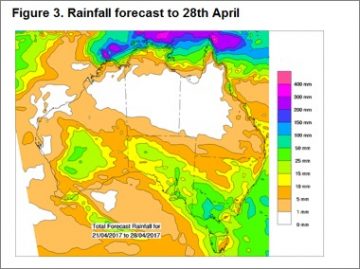 Another short week ahead with the ANZAC break and some decent rainfall to much of the sheep regions of the nation (figure 3) should see prices hold, or perhaps firm slightly. As outlined in the sheep/lamb analysis piece this week longer term fundamentals will continue to support any price dips seen in sheep and lamb markets for much of the current season.
 In the earlier analysis (
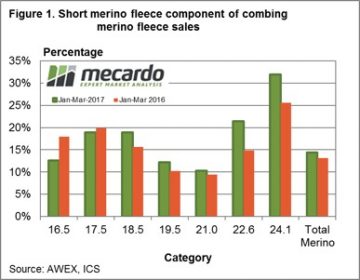
 Figure 2 is where the data becomes interesting. This shows the year on year change in volume for 50-69 mm length merino fleece wool by the micron ranges, for the January to March period. The changes vary widely. There has been a lot broader short staple fleece wool sold in 2017. This fits with the analysis from last week of the broader merino micron volumes. It points to plenty of downward pressure developing in the market as it struggles to absorb increases in the range of 40% to 100% of broad short staple fleece wool. This explains some of the low quotes coming out of the market for wool in these categories.
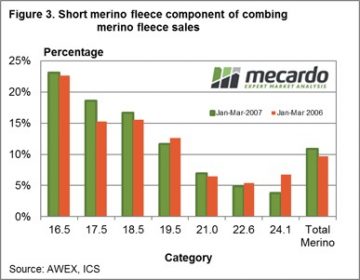
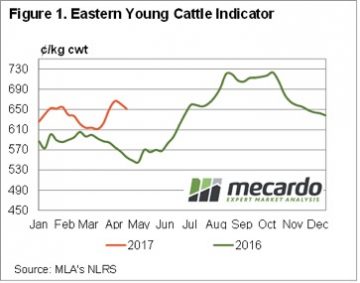
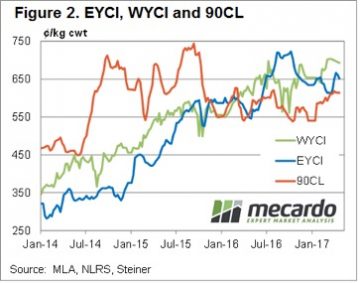 Figure 2 also shows the 90CL export beef indicator holding onto a price around 20 month highs. This week the 90CL sits at 614¢/kg swt, supported by tight supply from Australia and New Zealand.
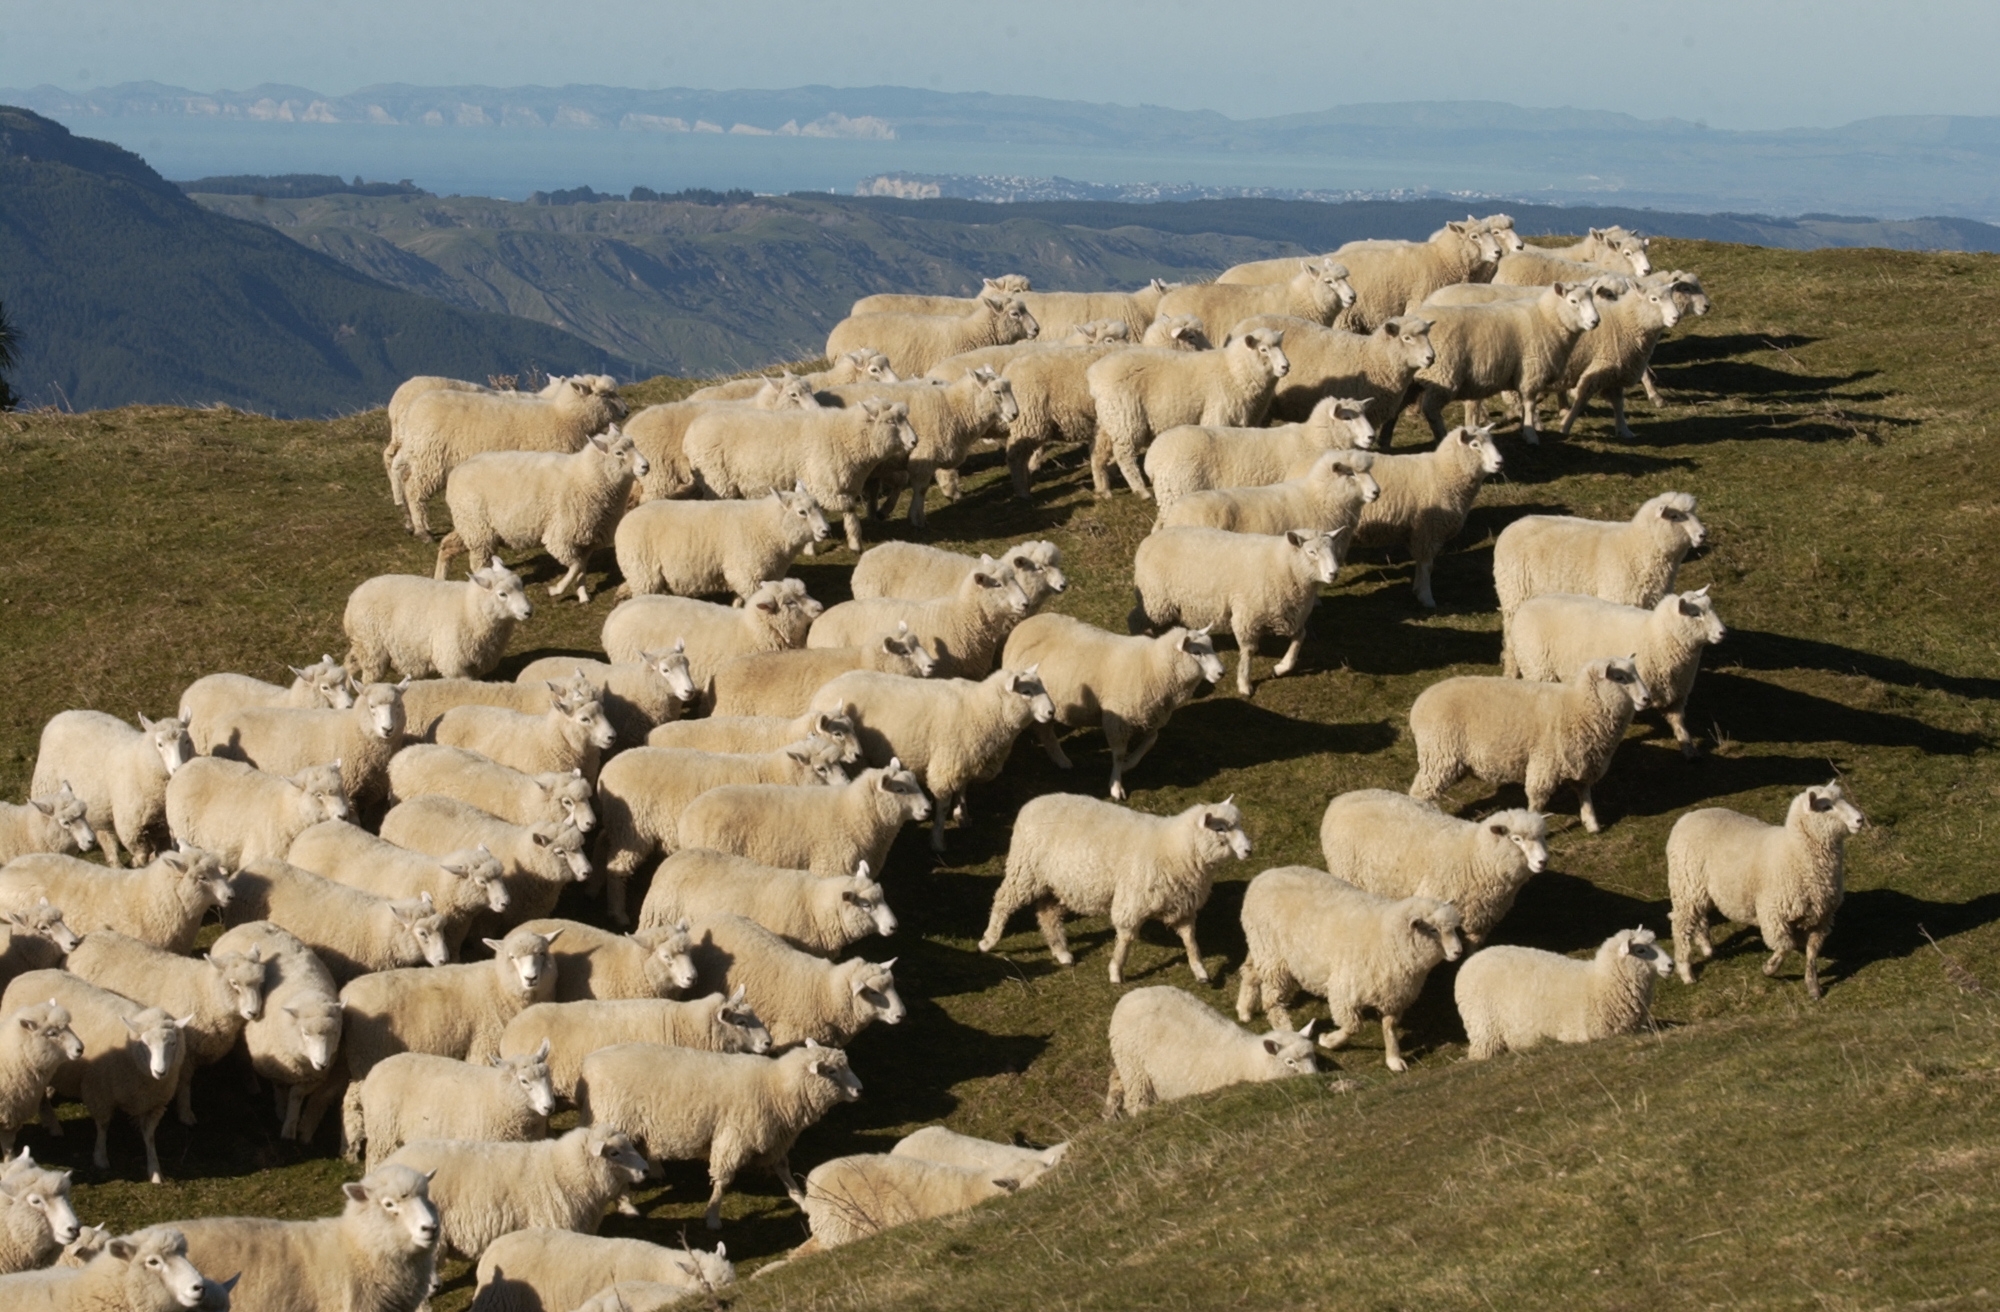
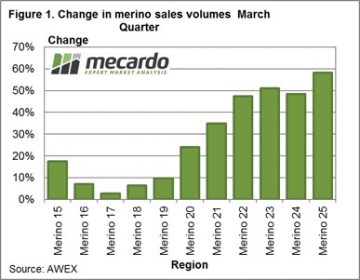 Recent sales volumes and AWTA data have shown strong increases in the supply of broad merino wool in Australia. While the supply was expected to pick up on the back of improved seasonal conditions in 2016, the rise has been faster than anticipated. This article takes a look at where the wool is coming from.
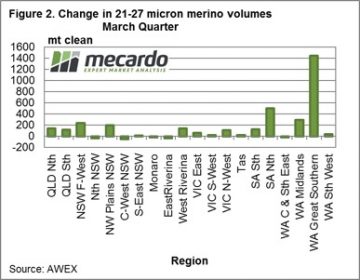 The question is where is the extra broad merino wool coming from? As Mecardo showed in an article a couple of weeks ago (
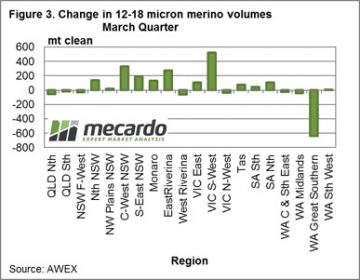 As a check on this change, Figure 3 shows the year on year change in the volume of 12-18 micron wool sold by each region in the March quarter. The big swing to broader wool in the Great Southern region is matched by a big drop in 12-18 micron volumes. Notice the higher rainfall NSW regions have had increased fine wool sales this year, along with south-west Victoria (which was coming off a drought induced low base). The expected decrease in supply of fine wool from NSW has not eventuated, except for the western Riverina. Good seasonal conditions in 2017 (which has started in the Monaro) will be required to pull the micron broader in the regions, in order to lower the supply of fine merino wool.
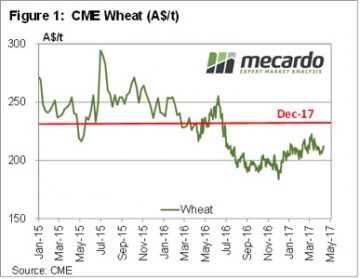 In reality, price movements were small in international markets this week. But after months of tracking sideways at low levels, commentators need something to talk about. CBOT wheat gained 9¢ over a few sessions, to hit a two week high of 432¢/bu. In our terms this puts spot wheat at $212/t (figure 1), and December 17 at $235.
 The coming month sees the USDA release their first estimate for the 2017/18 growing season, and this can often bring volatility to the market. There is no doubt US wheat production is going to be lower, but whether this can move the market remains to be seen.
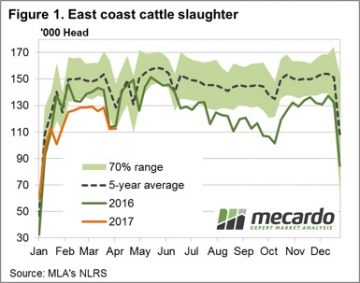 Figure 1 shows the pattern for East coast slaughter, with marginal week on week change as just over 112,000 head processed. The Easter dip in slaughter levels seeing numbers processed that were not too dissimilar to this time last season. Although for most of this season slaughter figures have been trending around 10% below the 2016 levels.
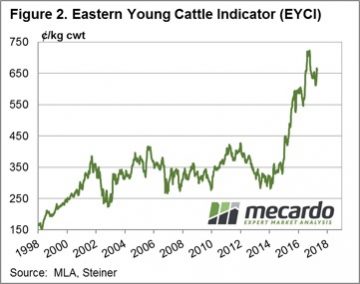 February. The increased yardings resulting in a slightly softer EYCI this week – figure 2.
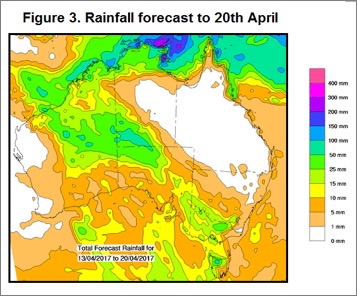
 The 2016 season was without doubt the wettest for the nation since the 2010/11 deluge and has been the underlying cause of optimism among restockers, encouraging a rebuild of the herd and supporting young cattle prices to record highs. The recent rains have provided a boost to cattle prices over March – but could the prospect of a dry second quarter in 2017 and 50/50 chance of El Nino developing later in the season signal the beginning of the end for further increasing cattle prices?
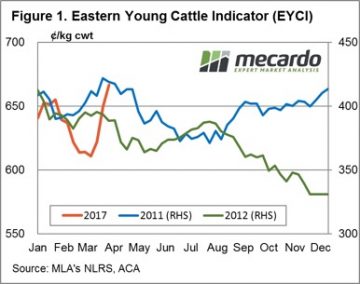
 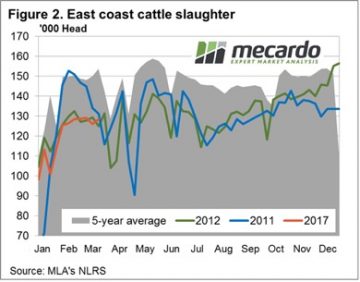 Figures 1 and 2 highlight the price and slaughter patterns comparing the current season to the 2011 and 2012 years. Interestingly, all three seasons have seen price increases for the Eastern Young Cattle Indicator (EYCI) over February/March. While the 2017 rally looks impressive, in percentage terms it is not too dissimilar to the gains recorded during 2011. The EYCI rose 8.2% over February/March 2011 compared to the 8.6% gain seen this year, albeit over a shorter timeframe. In terms of the weekly slaughter pattern there was a bit more volatility in the series during the first half of the year in 2011, although the 2012 pattern has been a reasonably good template for the current season, so far.
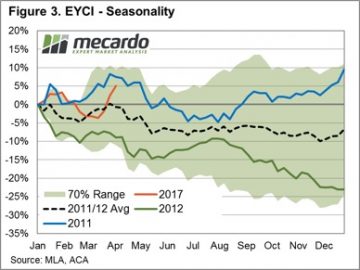 Figure 3 focuses on data from the last two transitions from a wet to dry period and how the percentage price movement of the EYCI responded over the season. Overlaid on the chart is the percentage price patterns for 2017, 2011, 2012, an average of the 2011 and 2012 pattern and a potential seasonal range (calculated from the most recent five seasons that experienced a shift from wet to dry conditions).
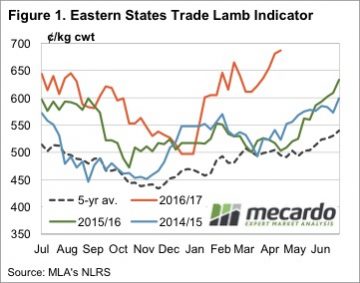 The pace of the rally in the Eastern States Trade Lamb Indicator (ESTLI) slowed this week, but it still went up. The ESTLI finished Wednesday at 687¢/kg cwt (figure 1). While the stronger prices of the last month might have something to do with a demand spike, it’s more likely to be underlying tight supply supporting values.
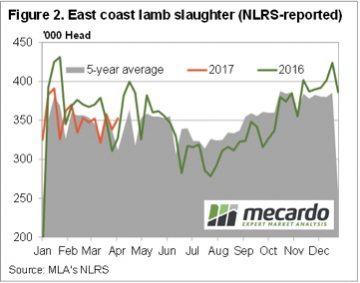 Driving MLA’s figures were results from the February MLA/AWI survey with the key figures being 34% of producers intending to increase flocks, and 59% intending to maintain. Of those intending to increase the flock, 56% are going to retain more replacement ewes. This basically means that of the fewer lambs born in 2016 and 2017, fewer are going to be available for slaughter.
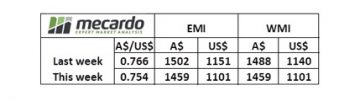 The EMI closed up a whopping 53 cents in A$ terms at 1512¢ while in Fremantle, the strong finish to the last week continued with a A$0.73 rise, the west closing at 1532 – Fig 1.
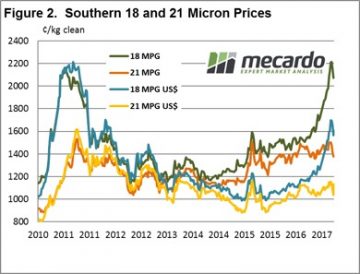 While the market in general benefited, it was the 21 MPG that was the stand out, with the market in Melbourne actually closing at a higher level than before the correction. This is quite remarkable given the increased supply of medium wool coming forward post the drought conditions of the past couple of years. Fig 2.
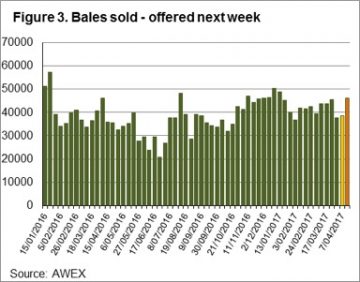 Growers are in the driving seat (not often this is the case!!), as the shortage of any buffer stocks means sellers can confidently withdraw wool from the market and have little risk that better prices won’t appear later. When combined with record income from any sheep or lamb sales (