Month: January 2019

Cattle on the slippery slope

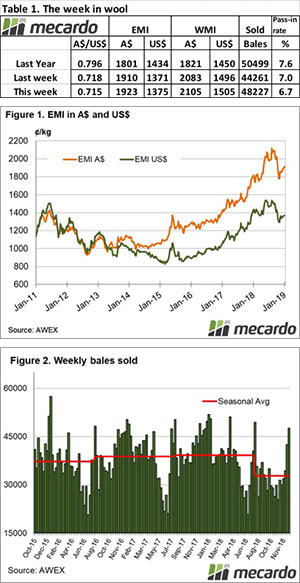
Cattle prices continued to slide this week, but managed to show some positive signs on Thursday. There were falls across the board on the east coast, as supply continued to overwhelm demand.

Even the Western Young Cattle Indicator (WYCI) has started to weaken, losing 11¢ this week to fall below 500¢ for just the second time in four years.  The WYCI of 496¢/kg cwt is the lowest price in four years.  It’s not unusual for things to be dry in WA at this time of year, but demand for young cattle seems to struggling.  High grain prices will no doubt have something to do with it.

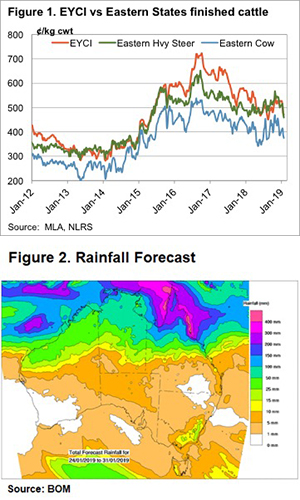
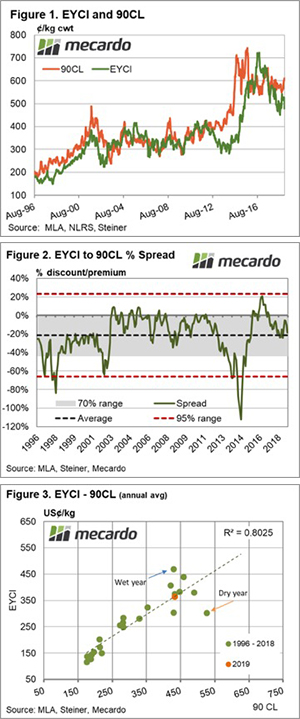
On the east coast the early year price decline continued for much of the week.  The Eastern Young Cattle Indicator (EYCI) hit a low of 468¢ on Tuesday, before regaining some ground later in the week to finish at 471.75¢/kg cwt.  Cattle prices are well short of this time last year, and pre-Christmas, but as figure 1 shows, they are very good compared to anything pre 2015.

The historically strong price may be why cattle continue to be drawn to the market.  If we write off this wet season in the north, cattle producers in northern NSW and Queensland will be waiting on unseasonal dry season rain for feed.  It could be some way off.

It’s interesting to see that even finished cattle prices have tanked early in 2019. The eastern states Heavy Steer at 248¢/kg lwt is the lowest price since mid-2015.  Perhaps the strong supplies in feedlots is adding to supply pressure.

What does it mean/next week?:

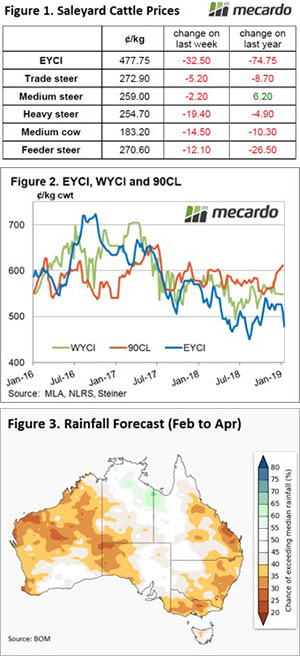
Figure 2 shows there isn’t much rain on the forecast for southern cattle areas over the next week.  The best we can expect for prices under this scenario is steady, although an argument can be made for tightening supply of finished cattle.

For southern buyers who are looking for cattle, the decline in prices should be seen as a buying opportunity.  We are two months from an early break, if you are an optimist, and the more cattle that are killed now, means less cattle later on.

Lower saleyard numbers help prices find a foothold

The Eastern States Trade Lamb Indicator (ESTLI) managed to climb 3.8% this week and East coast mutton wasn’t far behind, registering a 3.6% gain, as lighter throughput compared to this time last season lent some support to prices.

East coast Restocker lamb was one of the few categories to register a price drop, easing 2.3% as heatwave conditions sapped the buying enthusiasm out of restockers to see it close the week at 649¢/kg cwt. Merino lamb was the only other NLRS reported category along the East coast to suffer a price fall, albeit marginal at 5¢, to end the week at 620¢ (Figure 1).

Late last year we mentioned the prospect of a supply gap surfacing early into the new year and going by the price behaviour of heavy lamb this week, the star performer gaining 4.3% to 673¢, we could see the beginnings of a supply squeeze for heavy lamb.

Early throughput data for NSW Heavy lambs shows saleyard volumes for the first few weeks of January are trekking 40% below the 2018 pattern and 25% below the five-year average level (Figure 2). It would be interesting to see if this is being replicated across other states and probably worthy of a look in one of our sheep market analysis pieces for next week – keep your eyes peeled for that one.

Lower than average volumes also seemed to help give the ESTLI a leg up this week with a 26¢ boost to close at 677¢/kg cwt. East coast lamb throughput levels are running 28% lower than for the same period in 2018 and 17% under the five-year seasonal average since the start of 2019 (Figure 3).

What does it mean/next week?:

There is some very light rain forecast for southern parts of the country next week, but not enough to really get a rocket up lamb and sheep prices. A more likely scenario will see prices respond to supply volumes, with continued weak supplies helping to support gradual price gains.

Goldilocks zone for the EYCI

In the Friday cattle market comment from last week we mentioned that the Eastern Young Cattle Indicator (EYCI) was likely to find some support in the coming weeks from a firmer 90CL price. In this analysis we take a deeper look at the historic relationship between the EYCI and the imported 90CL into the USA, and what this may mean for the EYCI in the short term.

A quick recap on exactly what the 90CL is can be found here.

Historic price fluctuations of the EYCI and 90CL are outlined in Figure 1 and demonstrate that, for the most part, both price series follow a similar trend with the EYCI spending much of the time at a slight discount to the 90CL. As of last week, the 90CL imported frozen cow indicator closed at 602.8¢/kg CIF, compared to an EYCI close of 477.8¢/kg – representing nearly a 21% discount of the EYCI to the 90CL.

Analysis of the long-term percentage spread pattern between the EYCI and the 90CL shows that the average spread since 1996 has been a discount of 22% (black dotted line on Figure 2). Furthermore, the spread has spent 70% of the time fluctuating between a 1% premium to a 44% discount as identified by the grey shaded zone. Movement in the spread beyond a discount of 66% or a premium of 22% would be considered extreme, as shown by the 95% range boundaries (red dotted lines).

Comparison of annual average EYCI and 90CL prices (expressed in US$ terms to reflect a global beef price) demonstrates that there is a strong correlation between the price series with an R2 correlation score of 0.8025 – Figure 3. The correlation measure can only range between 0 to 1 and the strong correlation score suggests that over the long term the EYCI value is heavily influenced by offshore beef market movements.

Dry seasons can see the EYCI more discounted to the 90CL than normal, as was the case in 2014/2015. While more favourable years with adequate rainfall can see the EYCI sometimes move to a premium to the 90CL, like in 2016.

What does it mean?

Opening EYCI levels for 2019 compared to the 90CL show that young cattle prices are sitting right on the line of best fit (green dotted line on figure 3) neither too high nor too low, which quite remarkable given how dry the second half of 2018 has been. This suggests offshore markets like the 90CL are unlikely to exert too much pressure on the EYCI to the topside, nor the downside.

The fact that the current EYCI to 90CL spread is quite close to the long-term average level also reinforces this view, so perhaps we were a little hasty on Friday suggesting that the EYCI would find immediate support from the rising 90CL price. Indeed, from a historic perspective the EYCI is just about right (compared to the 90CL), sitting comfortably in the Goldilocks zone – so perhaps consolidation at current levels is more likely for the moment.

Key points:

  • The EYCI to 90CL spread is sitting just below a 21% discount, based off last week’s closing prices.
  • The long-term average spread from 1996 to 2018 has been a discount of 22%.
  • Based off the long-term price relationship between the EYCI and 90CL, the EYCI is sitting right where you would expect compared to the 90CL level.

Weekly Wool Forwards for week ending 25 January 2019

All of the action this week was in the 21 micron category, where the fine prices set on grower orders are lower than the current auction prices, but on par with fine trades to mid-2019 over the last few months, signaling confidence in a stable market.

One trade was dealt for May 2019 at 2,165¢/kg and three trades were dealt for June, all between the 2150 and 2160¢/kg marks. This confirms that buyers and sellers are relatively comfortable in that price range for the first half of the year.

Last week we saw some interesting developments in coarse wools with bids close to auction levels. This is still the case and it might be worthwhile for growers to lock in prices for mid-year. We are keen to see some action in other fiber lengths in the coming weeks.

Victorian supplies keeping a lid on prices.

There are still plenty of lambs coming for slaughter in Victoria, but NSW supply is waning. As such, lamb prices have been on the wane early in the year, and mutton has also been dragged lower.  It seems the destocking of sheep isn’t over yet.

In recent years the first few weeks of January have been marked by a lamb slaughter peak as lamb is stockpiled for Australia Day.  This year we are headed the same way on an east coast level, but Victoria has jumped to an early peak (Figure 1).

It appears there are still plenty of finished lambs flowing to Victorian processors, and this means bids at saleyards haven’t had to lift to fill kills.  The Eastern States Trade Lamb Indicator (ESTLI) this week dipped to its lowest level since June.  At 651¢/kg cwt, the ESTLI is still better than this time last year, but a long way off the contracts offered for January back in the spring.

Sheep supply has also been strong early in the year.  This has made our prediction of mutton being the star performer of early 2019 look a bit ambitious.  East coast sheep slaughter started the year well below the end of 2018, but at a higher level than any seen in the first half of 2018.

Mutton prices have tanked in response, Figure 3 shows Mutton hitting 374¢/kg cwt, a three month low.  Figure 3 also shows mutton can be very volatile and is just as likely to bounce back if supply tightens.

What does it mean/next week?:

There is little rain on the forecast, and as such prices will be relying on weakening finished lamb supplies to see any price rallies.  The same goes for mutton, and it’s hard to see sheep continuing to flow at current lower price levels. We have seen lamb prices rally during dry times, but not this early in the year.

Strength despite size.

The last 3 weeks of sales have seen big volumes of wool on the market. Now the normal story would be a hit on prices, but results have been curiously stable.  

The Eastern Market Indicator (EMI) rose 13 cents on the week, ending at 1,923 cents. The Au$ compared to the last week was slightly weaker at 0.715 US cents. That put the EMI in US$ terms at 1,375 cents, a rise of 4 cents (Table 1).

In the west, the Western Market Indicator (WMI) also rose over the week to end at 2,105 cents, up 22 cents on last weeks close. WA saw prices up in all MPG’s.

This week saw the largest offering of the season to date and even since April last year, with 51,703 bales on offer. Growers passed in just 6.7% of bales offered, resulting in a clearance to the trade of 48,227 bales. Over the last 3 sales, we’ve seen 135,017 bales sold and while that might seem significant, in comparison to the same 3 weeks the year prior it’s down 11.24% or 17,102 bales fewer.

The dollar value for the week was $101.26 million, for a combined value of $1.748 billion so far this season.

Prices were fairly mixed between Melbourne and Sydney. Fine wool struggled to find it’s feet in the north while it was the mid fibres and superfines that saw corrections in the south. Cardings also participated in the mixed market with 20 to 30 cent gains in Sydney and Fremantle, but a 5 cent drop back in Melbourne on the week. Crossbreds were the best performers for the second week in a row, with gains of 50 to 80 cents for 26 & 28 MPG.

The week ahead

The large offering and stabilising market over the last few sales points to positive times ahead.

We are due for a reduced national offering in the coming sales. Next week there are 41,503 bales rostered, with all centres selling. The following weeks have 37,995, then 37,005 bales rostered.

Not the greatest start to 2019.

The first full week of cattle sales for 2019 provides limited cheer after the festive break with all key reported categories along the east coast registering price falls. There was a glimmer of hope in offshore markets, but the Bureau of Meteorology (BOM) compounded the sad start by giving us a below average rainfall forecast for much of the summer.

Medium Cow led the decline, posting a 7.9% drop to trade at 183.2¢/kg lwt. The Eastern Young Cattle Indicator (EYCI) and Heavy Steers were not far behind Medium Cow, with 6.8% and 6.7% falls, respectively. The EYCI peeled off 32.5¢ on the week to close at 477.75¢/kg cwt (Figure 1).

In the West, young cattle prices managed to hold their ground with the Western Young Cattle Indicator (WYCI) continuing to stabilise near the 550¢/kg cwt area. There was more favourable news from North America though. Light beef volumes from Australia and New Zealand and limited insight into beef volumes coming into the US (due to the federal shutdown) has encouraged the 90CL Frozen Cow indicator higher. The 90CL has climbed 3% since the 2018 close to see it back above 600¢ for the first time since March 2018 (Figure 2).

Unfortunately, this season’s first look at the BOM rainfall outlook for the February to April period paints a gloomy picture for cattle producers across much of the country. There’s a low chance of exceeding median rainfall levels for much of WA, western SA, eastern Queensland and NSW, and most of Victoria (Figure 3). Ironically the lack of rain forecast managed to put a dampener on cattle prices this week.

Next week

As of last Fridays’ close, the 90CL was trading at 611.5¢/kg CIF putting it at nearly a 28% premium to the EYCI. Historically, the 90CL usually trades at a premium to the EYCI but the near 134¢ premium that currently exists is a bit outside the normal range. This should lend some support to the EYCI in the coming weeks if it can remain above 600¢.

My shutdowns are the greatest shutdowns.

The market trades based on information. The largest source of publicly available information is currently on a record-breaking holiday thanks to the US government shutdown. What impact does this have?


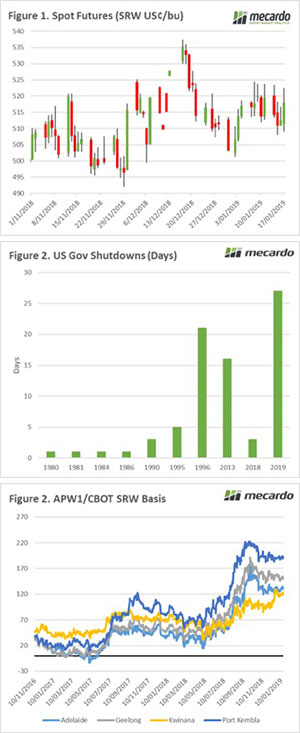
January is typically a quiet month for overseas markets. This month has been no exception to the rule. Chicago wheat futures are unchanged week on week in both US$ and A$ terms (Figure 1). The US will receive snow cover during the weekend, which will benefit the development of the crop. It provides protection against forecast cold snaps.

According to Trump, he is the best at a number of tasks. His ability is generally self-assessed; however, he is currently the record holder for presiding over the longest government shutdown in US history at 27 days.  The president is currently unable to get his budget approved due to his insistence on US$8bn to build a wall between Mexico and the US.

The shutdown has resulted in 100’s of thousands of government employees being furloughed. The biggest impact to agriculture at present is that the USDA is no longer releasing any new data including export, production and the WASDE report. Although there are many private forecasts available, the USDA data is usually a starting point for the trade.

The longer a shutdown continues the bigger the impact on the US economy. The US government estimates that quarterly growth will reduce by 0.13% per week. This is due to the impact of government workers having less income to spend/invest. The slow down in growth will likely slow down the pace of any US interest rate rises, which are now not expected until Q3 at the earliest.

At a local level, the Australian crop is largely complete. The only area continuing to harvest is Tasmania, which has experienced a fantastic growing season with conditions almost perfect. This has necessitated the construction of additional storage (see here) by Tasmania’s main storage and handling company.

This season has seen very little harvest pressure, as demand on the east coast has stripped supply. The basis levels have largely remained flat since the start of harvest (Figure 3), with the exception of WA. These basis levels remain at post-deregulation record levels and are liable to remain strong through until at least the middle of the year.

What does it mean/next week?:

As the government shutdown continues, there will be less and less current data available for the trade. However, most of the market uses USDA data alongside privately held data. At present, there seems to be no end in sight to the shutdown, with Trump holding his ground.

The real driver in coming weeks will be whether Russia can maintain its export pace and weather conditions in the northern hemisphere.

Weekly Wool Forwards for week ending 18 January 2019

A bit of action was seen in the 19 and 21 micron categories to kick off 2019 for the wool forward market and some interesting developments in the coarse wool forwards gave growers a chance with crossbreds to get some cover at great levels.

In the 19 mpg trades two trades were dealt for March 2019 at 2240¢/kg and October 2019 at 2140¢/kg.

The 21 micron class saw orders filled between 2150-2160¢ for a June 2019 maturity.

In the 28 and 30 micron bids have come in to the market that are quite competitive and providing growers a chance to look in at levels very close to the auction market all the way to June 2019 – something for growers to consider.

Cash in your grain and still retain exposure to the market.

There will be many of our readers who use swaps as an instrument in their grain marketing toolbox. The swap is a simple tool to use, and in general, is used pre-harvest but are there opportunities to turn the swap on its head and use post-harvest?

The traditional method of utilizing a swap is to sell a swap prior to harvest in order to lock in a futures price, then unwind the swap by buying it back from the bank at or near harvest. The main point of using swaps as a marketing tool is to create a hedge to protect against downside in physical prices, not as a speculative tool. At its most basic, if physical market rallies you will lose on the swap and gain on the physical and vice versa (Figure 1).

A detailed explanation of swaps and a video on how to use them is available on the below link:

Grain Swaps – farmers’ friend or hazard to be avoided?

The above explanation briefly outlines the traditional use of swaps, with the grower as the seller in advance of harvest. In our previous analysis article ‘3 elements you must consider when pricing grain’, we have explained the importance of thinking of your grain price as three distinct components. It is important to always keep in mind basis and futures.

During a year with low harvest prices, many growers will elect to hold onto grain with the hope of prices increasing in the post-harvest period. The holding of grain has a cost attached (interest lost, storage costs), and alternatives, where you can cash your grain and still have exposure to the market, are an attractive proposition.

With a number of banks, it is possible to turn it around and instead of selling a wheat swap, buy a wheat swap. Let’s say for instance the current basis levels were high (currently the case) and futures were low. It would be possible to sell your physical grain and lock in the basis, at the same time as buying a wheat swap.

The buying of the swap would give exposure to the futures market. Therefore, if the futures market rallied, you would participate in any upside. In an ideal world, you would then close out your swap position when you had reached your target price, and with the addition of the basis already captured, would be your overall price.

It has to be noted that there is also the potential for downside risk, and for many, it may be more beneficial to use a cash and call strategy which has a known ‘worst case scenario’.

The use of derivatives as an alternative to holding onto grain either on farm or in the system storage has a number of advantages:

  • You are able to gain cash flow from the physical sale of your grain.
  • You no longer have to pay storage costs
  • If the basis levels are attractive they are locked in, leaving no exposure to falls.

 What does it mean?:

It is important to understand a number of different ways of marketing your grain, as the tools available will work better in different marketing environments.

The opportunity for growers to buy a swap is best utilized when basis levels are high and upside is limited. This provides exposure to the futures market through the northern hemisphere growing period.