 The US Climate Prediction Centre, is currently on La Niña watch with an increased likelihood of the little sister to El Niño occurring before the end of the year, and into 2018. This can have very positive results for Australian grain growers, in this analysis we look at how we may benefit.
According to the BOM, ‘El Niño’s often lead to drier conditions over large parts of Australia, while La Niña’s tend to enhance rainfall over much of the continent’. However, it must be noted that not every drought is associated with El Niño nor every wet year with La Niña.
A visualisation of the impact can be viewed here.
In this analysis we have examined the El Niño and La Niña events which have been considered moderate to strong from 1960 to 2015 in order to determine what impact these events have on grain crops by analysing the year on year change in wheat production.
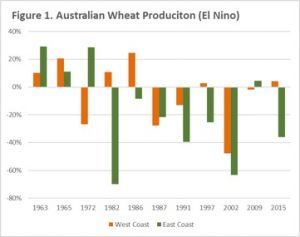
 In figure 1, we see the year-on-year impact of El Niño split into east coast and west coast. In the period 1960-2015, 7 of 11 El Niño years have recorded a reduction in wheat production, with 6 of these years recording a > 20% reduction. In Western Australia the impact of El Niño has been less negative, with 6 out 11 event years recording an increase. However, only two of these years record > 20% increase. In addition, during the years of production decline, 3 of these years recorded large production falls of > 20%.
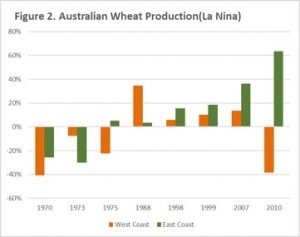
The year-on-year impact of La Niña is displayed on both the east and west coasts as highlighted in figure 2. In the period 1960-2015, there have been 8 La Niña events. The east coast during these La Niña events experienced 6 years where production has been higher, with 4 being >15% and 2 events where production reduced by >20%. The impact of La Niña in WA has caused 4 out of 8 years to have a production contraction, with 3 of those years having a >20% decline. The La Niña years with an increase in production in WA have resulted in smaller increases than the east coast with the exception of 1988.
In both figure 1 & 2, it is evident that since the mid 1980’s in Australia El Niño events have overall been negative for crop production and La Niña events have been positive, with the exception of 2010 in WA.
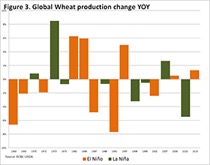
In figure 3, the year-on-year impact of La Niña & El Niño is detailed at a global level. During an El Niño year we can determine that production was reduced in 6 years out of 11, and increased in 5 years with no changes of more than 10% on a global level. During La Niña years, global production has increased in 3 out of 8 years, whilst production has decreased in 5 years.
 At present, the market is not yet overly concerned with La Niña. However, it does have the potential to impact greatly on the US crop through drier weather and eastern Australia through wetter than average conditions. If La Niña starts to impact on the US crop production, then we are likely to see risk premiums emerge in US futures markets, which will flow on to our own prices.
Key points:
- El Niño events tend to have a larger negative impact on east coast Australian production, with 6 out of 11 moderate to strong El Niño years recording >20% decrease.
- La Niña events tend to result in increased production on the east coast, especially in events since the mid 1970’s which may be due to more efficient water use.
- La Niña years in Western Australia tend to be more subdued with lower production gains, and a higher chance of reduced production.
What does this mean?
The market is looking for information to provide direction. The anxiety resulting from the potential for a La Niña can result in the formation of a risk premium in Chicago futures, as buyers seek to reduce risk from US related supply issues.
Australian growers would therefore benefit from a rise in futures prices.


 The US Department of Agriculture released their World Agricultural Supply and Demand Estimates overnight. In this week’s comment, we will take a look at the impact on wheat, and report on new import barriers being erected in India.
 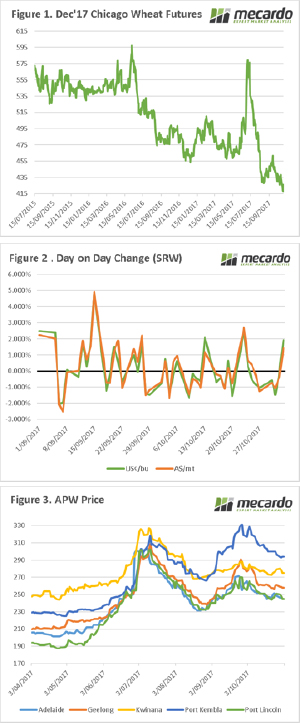 Australian is on the cusp of being full blown harvest, with all states (ex Tasmania) showing some activity. In the coming weeks, harvest proper will be upon us, and we will start to see how accurate the crop forecasts have been.
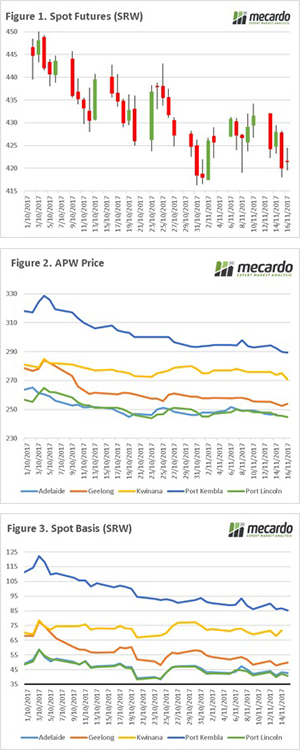
 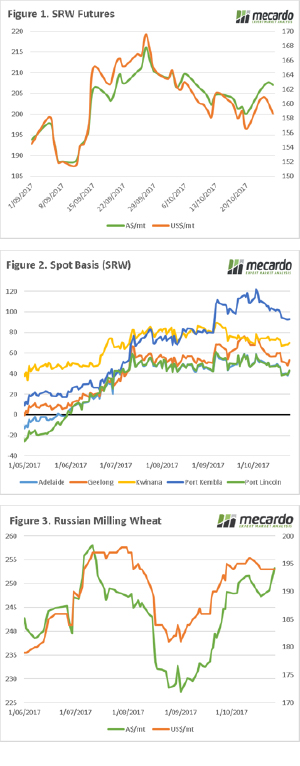 The market continues to follow a similar pattern to recent weeks. In this week’s comment, we look at futures & basis levels. In addition, we look at where our main competitor (Russia) is pricing its wheat.
 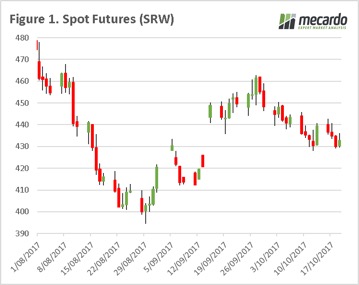 The futures markets are largely quiet, as the northern hemisphere is largely complete for 2017 and seeding progresses for next year. At a local level, it is important to start considering local premiums and how to take advantage of them.
 At a local level, harvest has begun in the north and it won’t be long until the bulk of farms around the country will be ‘reaping what they have sown’. During October, rainfall has been strong through much of northern NSW and QLD, although not adding much in the way of benefits to the winter crop has added confidence in the summer crop. This has resulted in consumers reducing some of their buying appetite, as they reassess the situation for the coming 6 months.
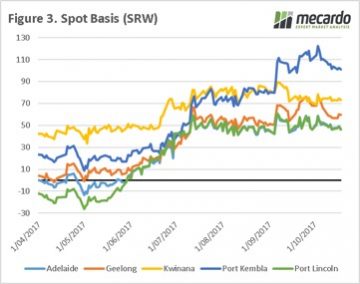 At present there are considerable premiums available for growers. As growers start to sell the crop, the logic would be for basis to fall.
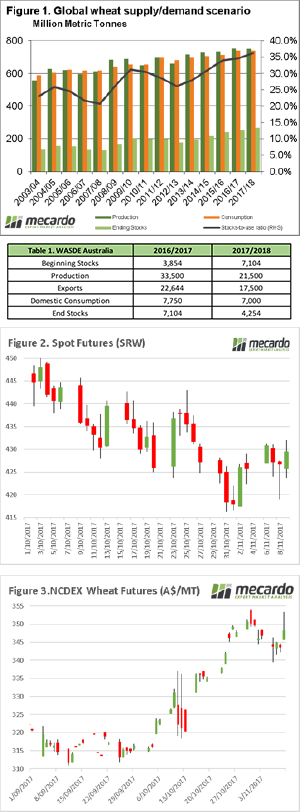
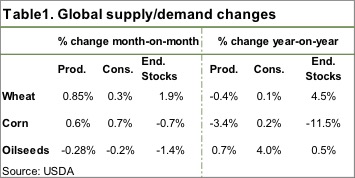 The Australian Bureau of Agricultural Resource Economics and Sciences (ABARES) made an interesting move this week, warning of crop downgrades. Meanwhile the United States Department of Agriculture (USDA) made their monthly predictions.
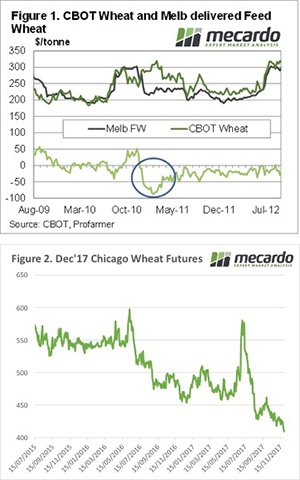
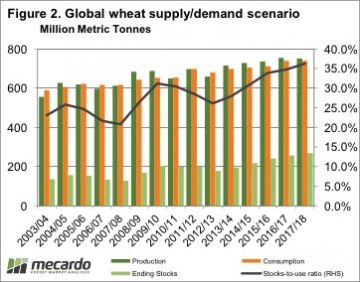 Global wheat production was lifted 5.3mmt thanks to improving production in the EU and India. The USDA did downgrade the Australian crop by 1mmt to 21.5mmt. Figure 2 shows we are still well and truly on track for a record carryout for 17/18.
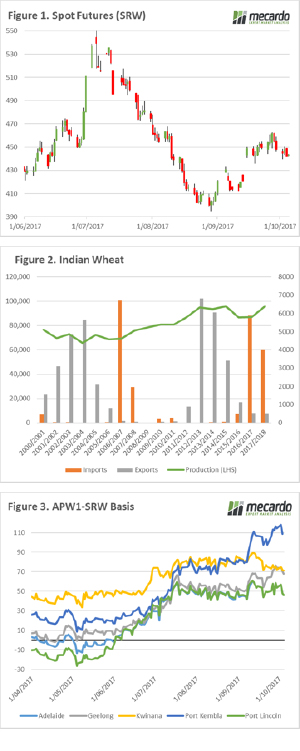 Futures markets edged lower this week, but were balanced by a fall in the Aussie dollar. In this week’s comment, we look at rumours of increased import duties in India, and local premiums over Chicago futures.