
Another relatively quiet week in the grain trade both locally and globally. In the past week, there have been further crop forecasts released, weather woes and political posturing from the Trump administration.
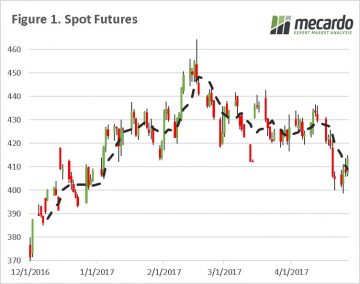
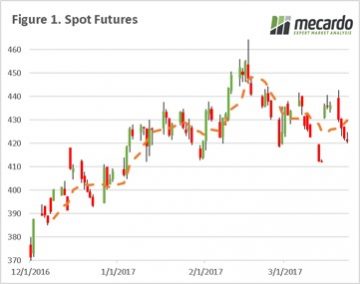
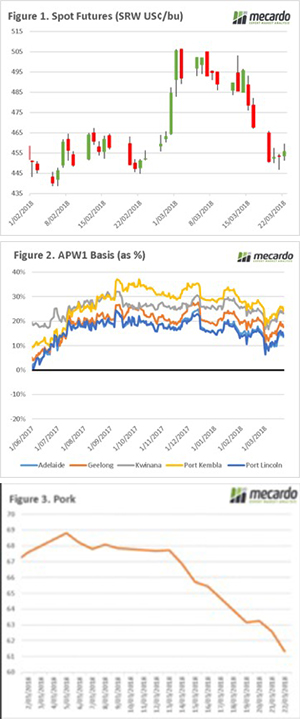
The wheat futures market has been on a downward trend since the start of the month (figure 1), and fell to as low as 398.5¢/bu. Overnight, futures rose around 5.75¢/bu (or A$2.8), it’s not enough to get overly excited about but any rise is better than a fall. The rise can be attributed to a recovery from falls in previous nights over concerns of posturing by Trump (more below), and concerns relating to cold weather. Although there will likely be issues with yield and quality in the US, it is still too early to get a realistic picture of any damage.
The International grain council (IGC) released updates to their projections, there were few surprises. Overall grain supplies are projected at their historic high 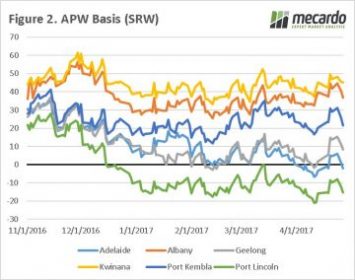 (2.6bn mt) for 2016/17, and old crop end stocks will largely cancel out lower production in the 2017/18 season. Our view still remains the same that a large supply shock is required to put fire under wheat prices to an excitable level.
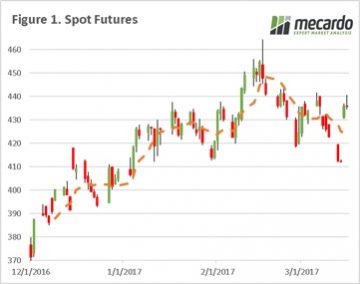
At a local level this week has been a short one due to the ANZAC day commemorations, which also traditionally has been a trigger for widespread crop planting around the country. Where it is not too wet to get machinery into the paddocks the country is for the most part in full swing. However, we have seen a sudden dip in basis levels across all port zones (figure 2), with Adelaide now following Port Lincoln into negative basis territory.
This week there were concerns that Trump was 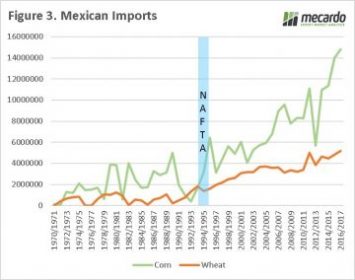 ready to scrap the North America free trade agreement (NAFTA), however it was later announced that there would a ‘renegotiation’. Free trade agreements were at the centre of Trumps campaign, with fears that they negatively impacted on American jobs. The removal of NAFTA would be a worry for American grain growers, as trade with Mexico has drastically increased since 1994 when it was enacted (figure 3). The overwhelming majority of imports are from the US but in recent months it is speculated that Mexican buyers have been examining options from the South (Argentina & Brazil).
What does this mean?
The grain trade will be keeping an eye on the weather in Europe and North America, in order to determine whether there are any major concerns.
At a local level, most farmers will be concentrating on getting a crop into the ground and marketing for old and new crop will largely be put to the back of the mind.
On a separate note growers holding old crop grain in silo bags in areas where mice are starting to become a ‘plague’ concern are advised to double check any bags for infestation.

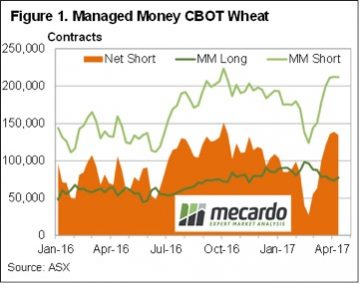 Earlier this week we took a look at some of the production data US wheat markets take note of, and there is also some data which shows how traders react. The CFTC Traders Summary tells us what type of trader holds long or short positions in CBOT wheat.
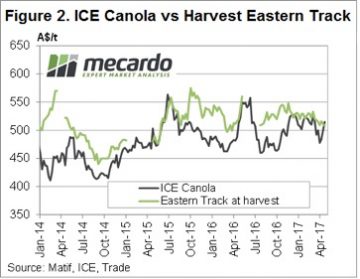 Canola has found some strength in Canada this week as wet weather delays sowing. The spot ICE contract rallied over $30 to $520/t, while Jan-18 gained $15 to sit at $497/t today. With the weather forecast not looking favourable for sowing, there could be some more upside for Canola.
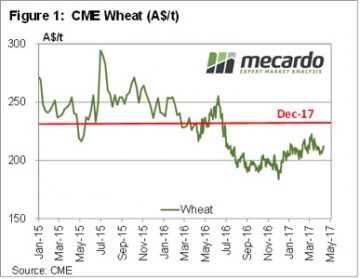 In reality, price movements were small in international markets this week. But after months of tracking sideways at low levels, commentators need something to talk about. CBOT wheat gained 9¢ over a few sessions, to hit a two week high of 432¢/bu. In our terms this puts spot wheat at $212/t (figure 1), and December 17 at $235.
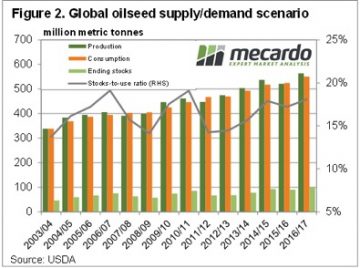 The coming month sees the USDA release their first estimate for the 2017/18 growing season, and this can often bring volatility to the market. There is no doubt US wheat production is going to be lower, but whether this can move the market remains to be seen.
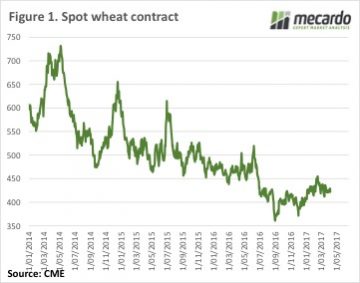 Figure 1 shows a rather boring CBOT wheat chart. Recent swings in prices have been small on an historical scale. As the volume of supplies dampens any attempts at a real price rally.
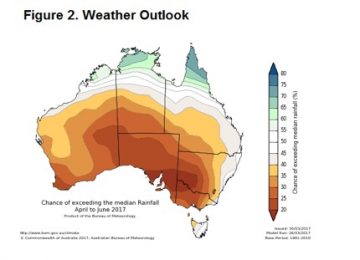 There has been intermittent interest in Canola, ASW and Feed Barley in recent weeks, with some growers managing $10-20 premium on published bids when buyers are trying to fill ships. If you’ve got wheat in store it’s worth looking at the shipping stem to see when boats are going and trying your luck with offers on Clear, or by talking to buyers or brokers.
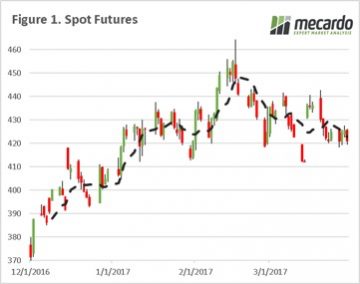 In nautical terms, dead calm is the absence of wind or waves. It feels that way at the moment in the grain trade. The market has largely drifting with little in the way of wind or waves to give momentum in any direction. Will the USDA & IGC report provide some wind behind our sails?
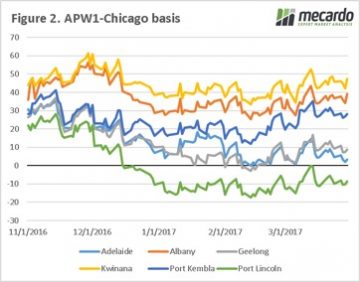 Yesterday the International Grain Council (IGC) released their global crop forecasts, and although not particularly positive for prices, does provide some hope for the future. The report indicates that in 2017/18 global wheat production would fall from 745mmt to 735mmt, with end stocks to be around 484mmt versus 513 this year. It has to be tempered that this would still remain the 2nd highest stocks in history. However, it does start to show a depletion in global stocks.
 The futures market has subsided (figure 1) in the past week, as areas of dry concern receive forecasts of substantial rain in the US, and minimal bad news coming out of Europe. The reality is that the trade is concerned about USDA stock reports due next week. This asks the question, what if exports have not been high enough to deplete stocks?
 However at a local level, we have seen basis increase across all port zones (figure 3) at an average increase week on week of $3.50/mt. This is using the public bid, and there are further opportunities out there for non-public sales.
 We will get an insight into inventory levels with next week’s USDA quarterly stock report.


 Early this week wheat futures fell on the back of lack of fresh data, and encouraging crop conditions in eastern Europe. The generally benign conditions and the large global surplus is keeping a dampener on large upside potential. The market fell around 15¢/bu ($5.7USD/mt), before regaining strength to hold currently 8¢/bu ($2.3USD/mt) above last Friday (figure 1).
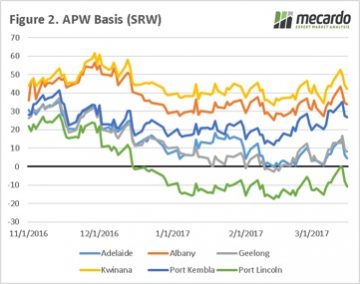 This week the US fed jacked up their interest rates by 25 points, typically this would put pressure on the Australian dollar however this was not the case. The Australian dollar rose to above 77¢ (figure 3), and the AUD trade weighted index rose dramatically.
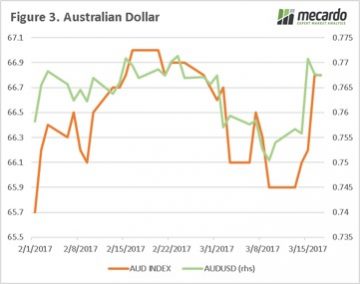 There are some concerns in the US related to dry weather, and eyes will be on weather forecasts pointing toward a deluge in the coming weeks. If this eventuates it will lead to an improvement in US crop potential.
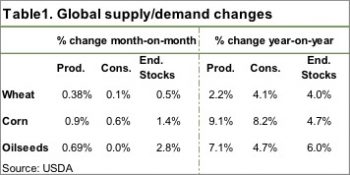 It’s a bit unusual to get large shifts in supply or demand in the WASDE report at this end of the growing season. Most world crops are all but in the bin, with just South American summer crops, corn and soybeans still to be harvested.
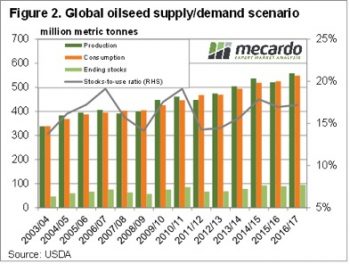 The USDA also lifted Brazilian corn production, increasing 5mmt, and Argentina by 1mmt. This increased world ending stocks by 1.4% thanks to some increases in consumption. This sees the global stocks to use ratio still marginally lower than last year, which should provide some price support.
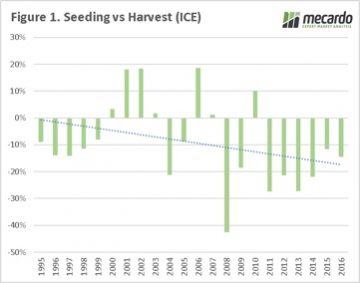 All going well, and with the rain landing in the right places at the right time, Australia can be expected to have a bumper canola crop. This is a story likely to be repeated across the rest of the world with the fall in cereal prices.
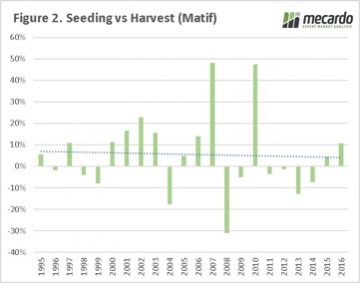 When the Matif contract is examined a different picture emerges. The price during the Australian harvest has been lower only 10 times out of the past 22 seasons, with an average positive change of 5%. However, if we preclude the large changes in 2007 and 2010 the average drops to a meagre 1%.