Category: Market Analysis

US turmoil creates a headwind for Aussie cattle

Key points:

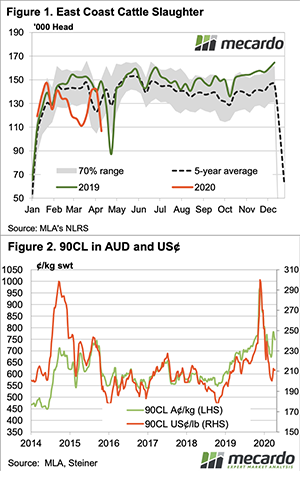
  • Since the start of the year, US Live Cattle futures have declined by 30% to trade below 200US¢/kg on a live weight basis this week.
  • The spread discount between Australian Heavy Steer prices and US Live Cattle futures has narrowed from a 28% discount in January to a 2% discount this month.
  • A recovering AUD has placed further pressure on domestic Heavy Steer prices and continued weakness in US cattle markets could see local prices ease toward 275¢/kg lwt in the coming months.

The Australian cattle market can march to its own drumbeat from time to time, particularly when local climatic factors and the domestic supply situation override offshore influences. However, there is only so far they can deviate and usually the aberrations from the global situation are short-lived.

Since January US Live Cattle futures have been sold off aggressively falling nearly 30% from 275US¢/kg to trade just under 195US¢/kg this week, on a live weight basis. During the early phase of the price collapse in US Live Cattle futures, the Australian dollar was also being sold off which acted as an insulator for Australian cattle producers.

The lower value of the Australian dollar meant that domestic cattle prices didn’t have to come under pressure to remain competitive. However, in the last month the AUD has regained some strength moving from the mid 50US¢ level to the mid 60US¢ level, placing pressure on domestic cattle prices as the US Live Futures market continues to head south.

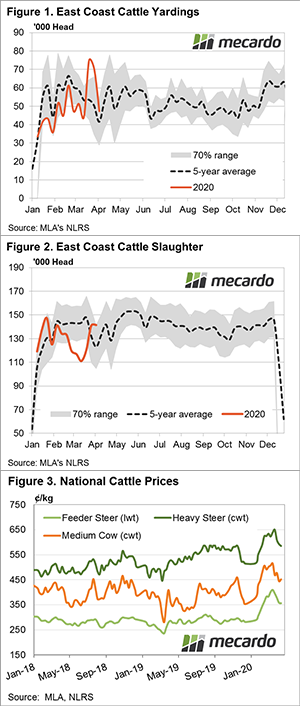
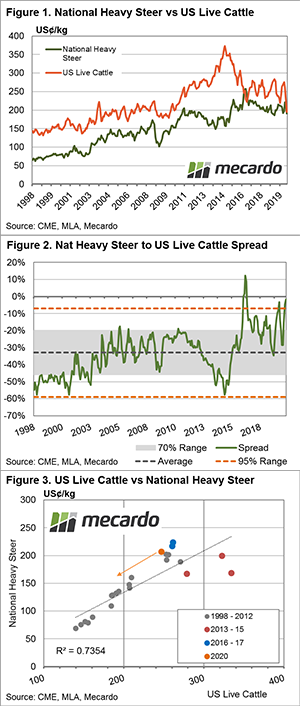
Figure 1 highlights the relationship between US Live Cattle futures and the National Heavy Steer Indicator in US¢/kg terms and it shows that with the ongoing weakness in US cattle markets and a recovery in the A$ the normal discount that Australian cattle markets have to the US has come under significant pressure.

Indeed, on a monthly basis, the National Heavy Steer to US Live Cattle futures price spread has narrowed from a 28% discount in January to a 2% discount this month (Figure 2). Analysis of the historic spread behaviour shows that since 1998 the monthly average spread has been a 33% discount, with the spread trading between a 20% to 46% discount for 70% of the time. Furthermore, movements beyond a 7% to 59% discount range would be considered extreme.

Figure 3 demonstrates the annual average price correlation between US Live Cattle futures and the National Heavy Steer in US¢/kg terms. Dry climatic conditions in Australia can see local prices deviate from the normal relationship (as indicated by the line of best fit between the annual data points) such as that which occurred during the 2013-15 seasons.

Similarly, wetter conditions or times of tight supply in Australia can see the local prices move towards a narrow discount spread or sometimes even to a premium spread to the US prices for a short period of time. This occurred most recently during the 2016/17 seasons and is also present during the current season.

What does it mean?  

As of this week, US Live Cattle futures are trading below 200US¢/kg. However, as an annual average they are sitting at 245US¢/kg. If US Live Cattle futures remain sub 200US¢/kg for an extended period this will begin to see the annual average drift leftward (as per the path of the orange arrow (Figure 3).

Furthermore, if the AUD continues to probe higher this will add further pressure to domestic heavy steer prices. In USD terms the Australian National Heavy Steer is sitting at 192US¢/kg lwt. US Live Cattle futures remaining under 200US¢ could see it move closer to 175US¢, which equates to around 275¢/kg lwt in Aussie dollar terms based on an A$ at 64US¢.


Volatility and uncertainty but supply remains the driver.

Easter usually leads to plenty of variation in saleyard indicators. With some sales not running due to the break and processors closing for some extra days, it is hard to get a handle on pricing. This week we saw some falls for slaughter cattle, but feeders found some support.

Figure 1 shows cattle slaughter took a dive last week and is likely to have spent this week at similar levels. Cattle slaughter is not as low as Easter last year but did see its lowest week for 2020.  It is probably not bad timing for processors, who are likely still seeing some pretty significant demand swings.

This week the improving Aussie dollar saw export prices in our terms weaken. The 90CL Frozen Cow Indicator was steady in US terms, but 16¢ lower in our terms at 748¢/kg swt.  Figure 2 shows the 90CL is still well above the lows hit back in March and apart from the spike late last year, it has never been better.

There are positive signs for export beef demand from the US.  According to The Steiner Consulting Group, cattle slaughter in the US has fallen heavily with a COVID-19 outbreak at two plants putting production on hold.  Closures are expected to be short term, but they will put pressure on beef supplies while seeing cattle prices fall.

Locally, feeder cattle prices rallied this week, with the National Indicator up 12¢ to 368¢/kg lwt.  Tight supply remains the driver of the store cattle market.

Heavy Steers and Cows were down, according to National Indicators, but this might have been due to intermittent sales. We will know more next week.

Next Week

There are plenty of reasons for cattle prices to fall, with shifting demand, a volatile currency and rising wheat prices all applying pressure. However, the main driver, for the time being, remains supply, which is unlikely to improve until the spring.


Smallest offering since 2009

Originally this week was scheduled as the Easter recess, however, a decision was made to provide an additional selling opportunity for growers on the back of the malware attack earlier. After brokers encouraged clients only to offer if they were genuine sellers, 15.5% of the original roster was withdrawn resulting in just 18,097 bales making it to the auction.

While the early sales of the one day auction (Wednesday) were solid, by the end of the day the market had retreated, with Fremantle, as the last to sell, most affected. This resulted in just 3,113 bales of the 4,508 offered in W.A. selling, with a pass-in rate of 30.9%

The pass-in rate of 23% nationally meant that of the bales offered, just 13,917 bales cleared to the trade. This was the lowest offering since June 2009. Season to date there have been 228,000 bales fewer sold, down on average 6,340 per selling week compared to last season.

The Eastern Market Indicator (EMI) lost 9 cents for the week to close at 1,292 cents. The Australian dollar was strong, lifting almost 3 cents to US$0.641, which pushed the EMI in US$ terms up 31 cents to 828 cents. The Western Market Indicator also eased losing 14 cents to close at 1,370 cents. Turnover this week was $19.67 million at $1,413 per bale, taking the year to date value to $1,728 million.

Melbourne finer Merino types all posted rises, however, the EMI was dragged down by falls in the X Bred sections where falls of between 20 – 40 cents were observed. Cardings eased slightly except in Melbourne where a 30 cent fall gave back the improvement of last week.

The week ahead

Next week all centres are selling on Tuesday & Wednesday with 31,517 bales on offer. A stronger US/Aus$ rate is not helpful, but exporters appear to have sufficient orders to cope with the reduced offerings.

Easter supply lull unable to inspire price lift

Lamb and sheep yarding and slaughter volumes entered into their Easter lull but the reduced supply was unable to provide support to prices. All MLA reported CV19 lamb and sheep indicators softened slightly, with the processor lamb category recording the biggest drop.

A reduced trading week either side of the Easter break has seen east coast sheep and lamb yarding levels decline to their usual seasonal trough dipping to 86,395 head – Figure 1. During the Easter lull in 2019 the combined lamb and sheep yarding levels were only marginally softer at 85,517 head but the distribution of lamb to sheep is quite different. Compared to last Easter the lamb yarding level this season is 8% softer while sheep yarding is 30% higher.

It is a similar picture of low supply for combined lamb and sheep slaughter too, which is unsurprising given the reduced shifts meat works are operating over the Easter holidays – Figure 2. Slaughter levels recorded 314,904 processed as a 2020 Easter trough compared to 314,242 in 2019.

However, slaughter volumes are well below the five-year average Easter pattern at around 420,000 head. Indeed, current levels are 25% below the mid-winter period when slaughter usually reaches its lowest point in the season, according to the five-year trend pattern. Given the subdued processor activity it is unsurprising to see that the CV19 processor lamb indicator eased the most this week falling 4% to close at $208 per head – Figure 3.

In some good news for producers this week the BOM released its three month climate outlook yesterday showing they are expecting a 60-75% chance of a wetter than average winter period for most of the country. Furthermore, some positive signs that the global sheepmeat export demand is recovering surfaced this week as news of an emergency shipment of 135 tonnes of sheepmeat from Victoria to the Middle East was reported.

What does it mean/next week?:

Covid19’s uncertain impact on global economic growth remains a threat to sheepmeat demand and will likely create ongoing headwinds for prices this season. However, on the plus side for producers the climate forecast is shaping up nicely for Winter and supply remains at record lows.

We probably won’t see the $9-10 per kilo carcass weight prices for trade lamb we had originally forecast for this season during Winter, but equally we are unlikely to see a price crash sub $5-6/kg cwt.

A lot can happen in one month.

Key Points

A month is a long time in markets. A lot can happen, and opportunities can be lost or gained if you wait a month before making a decision. In this weekly update, we take a look at what has happened over the past month.

As discussed in yesterday’s analysis article volatility has increased in recent months to higher than average levels for this time of year (See: More months of uncertainty).

Chicago wheat futures have been in a steady decline since last Thursday, in US terms the market has fallen from US$209/mt to A$200/mt for the December contract. During the same period, the A$ has advanced to trading at a range of 63-64¢. This has resulted in December wheat futures falling from A$329/mt to A$316/mt in the same timeframe.

In the past month, we have seen a large fall in wheat futures levels in part due to a rising Aussie dollar and a depreciating CBOT. During the week commencing the 16th March, wheat futures rose from A$310 to A$348, and continued through the next week to reach a high of A$355 (figure 1).

The market has given back most of the gains since that point. There are many farmers who benefitted from this rally in pricing levels by taking out wheat swaps for next harvest.

It is important to develop a marketing strategy which will take the emotion out of selling decisions, this will help gain a higher overall price.

Remember to listen to the  Commodity Conversation podcast by Mecardo

What does it mean/next week?:

Parts of Europe and the black sea nations have been dry. However, the next fortnight is expected to see improved rainfall.

Seeding has started in Australia, and will likely ramp up towards the traditional ANZAC day start. The majority of farmers are quietly confident of the conditions.

Easter bear?

Key Points

The USDA released their April world supply and demand estimates report overnight. Although a bearish report, the market largely ignored the data and moved higher.

The USDA report was bearish, and normally that would have led to a fall in pricing however we live in different times. The headline numbers of the report show that global wheat production is set to hit record high levels at 764mmt, a rise of 33mt on last year. To put this in perspective, this is more than Australia’s record crop in 2016.

In addition, global consumption is reduced by 5mmt, leading to end stocks being increased to a record-breaking 293mmt. As discussed in previous updates on the USDA end stocks information greater than 50% of stocks are held in China and likely inaccessible to the wider market.

After two days of deteriorating CBOT values, the market gained US$2. In Australian dollar terms however, the market has lost ground, down A$11 since the end of last week. This is as a result of the Australian dollar regaining a lot of ground and currently trading at 63¢.

These next four weeks will provide some more clarity on the northern hemisphere crop, whether it will stay large or fall back. The one thing to be certain of is that historically the period late April to July has plenty of excitement.

Yesterday the Mecardo analysts produced a podcast discussing what is happening in the agricultural markets at present.

Remember to listen to the  Commodity Conversation podcast by Mecardo

What does it mean/next week?:

Volatility will prevail. There is a high degree of uncertainty in the marketplace caused by COVID-19, however, the fundamentals always prevail.

At present Australia is on track to produce a good crop, the rest of the world is likely to follow. It is time to consider your risk management strategies.

Offshore cattle rollercoaster causes concern

Key Points

Key supply metrics in the domestic cattle markets appear to be returning to more normal levels and this helped cattle prices stabilize somewhat this week. However, the volatile nature of global cattle markets, particularly in the USA is some cause for concern over the longer term.

East coast cattle market yarding levels have continued to pull back toward the seasonal average pattern with throughput reported at 47,298 head, down from over 70,000 head the week prior. Yardings are now trending just 14% above the five-year average for early April – Figure 1.

East coast slaughter has returned to above-average levels, demonstrating that processors responded to retailer’s demand for product to cover off on the panic buying that was evident in supermarkets during March. Weekly slaughter has stabilized just above 140,000 head into early April, although the shorter trading weeks heading into the Easter break could see these figures drop in the near term – Figure 2.

The more normalized supply has seen cattle market prices stabilize this week. National Feeder Steers easing just 2¢ to close at 356¢/kg lwt. National Heavy Steer dipped 7¢ to 585¢/kg cwt while Medium Cow managed an 8¢ gain to 452¢/kg cwt – Figure 3.

While domestic markets showed more stability the same cannot be said of offshore markets. A key long-term lead indicator for Australian cattle prices is what is transpiring in the USA. The US Live Cattle Futures have been sold aggressively over the last fortnight to see them hit lows unseen in over a decade with the June 2020 contract hitting 76.60US¢/lb midweek. At the middle of January, it was trading at 120.00US¢/lb so the fall from grace on Covid19 concerns has been significant.

What does it mean/next week?

US beef prices have been downgraded on the back of growing concerns that Covid19 will impact heavily upon the US economy and flow through to significant declines in global economic growth.

While the tight season for supply domestically, improved climatic conditions and lower Australian dollar will provide a buffer for Australian beef producers in the short term a significantly reduced global beef price will act as a significant headwind into the medium to longer-term horizon.


It will start with mutton

With no saleyard indicators available tracking lamb and mutton markets becomes a bit difficult.  Meat and Livestock Australia are reporting a Processors Lamb (CV-19) Indicator, and the trend is believable if the actual pricing is not.  Other evidence is supporting the idea we may have seen the bottom for a little while.

The indicators being produced in the CV-19 era lack available historical data, but you can find the pricing and charts here.  To the week ending Tuesday, the Processor Lamb (CV-19) was quoted at 943¢/kg cwt.  Anecdotal evidence and over-the-hooks prices suggest this is a great price.

The quote is very high due to the calculation of the indicator.  It is an average of the dollar per head value of all lambs sold in MLA saleyards to processors, divided by the five year average weight for the month.   The national average carcase weight for April is a bit over 19kgs.  This appears to be a bit light for lambs currently being sold to processors.  It is probably closer to 21 or 22kgs, giving an average price of 820-850¢/kg cwt.

The trend of prices is supported by moves in over the hooks prices this week.  Anecdotally we hear export processors have lifted rates from 750-780¢ up to 800¢, while supermarkets are in the mid-800¢ range.

Price movements this week could be due to markets closing for the Easter break, and processors chasing lambs for next week’s kill.  However, the panic sell may have also washed through the market, leaving supplies to drift back towards winter lows, but earlier than normal

Next Week.

If anything is going to benefit from China emerging from a COVID19 shutdown it will be mutton.  You can’t panic sell something you don’t have, and figure 1 shows how little the rush to sell lamb has translated into mutton. In fact, for the last couple of weeks sheep slaughter has been half last year’s levels.

Mutton exports to China also rallied in March (figure 2), and we can expect demand to continue to grow, although there simply won’t be enough to satisfy demand, and this is good for all ovine pricing.

Industry working together produces confidence

The wool market is showing similar resilience to the stock market; despite the obvious unprecedented challenges it keeps going. Like the ASX, it has bad weeks and good weeks, in the context of the global uncertainty this was a good week.

The positive response by all in the industry to reducing the size of the offering, and the openness to review the selling system was a sign of all things good for wool, at times of adversity the industry can rise up.

Of the original roster of about 44,000 bales, 24.7% was withdrawn prior to sale by growers, this produced a reduced offering of 29,495 bales. The pass-in rate fell to 13.3% nationally leaving just 25,581 bales cleared to the trade. This was almost 5,000 more than last week.

The efforts by brokers was significant in ensuring that only genuine sellers put wool to market. This had the double whammy effect of reducing the offering and therefore increasing the demand on the lots in sale, as well as increasing buyer confidence as they realised that the wool on sale was more likely to be sold.

The other significant event was the inaugural Online Open-Cry (OOC) auction. In an initiative of the industry CV-19 working group to have in place contingency options, Zoom video conferencing was trialled with great success. This will provide an industry accepted option should CV-19 restrictions escalate to the point where auctions are cancelled.

The Eastern Market Indicator (EMI) improved 14 cents for the week to close at 1,301 cents. The Australian dollar remained stable at US$0.613, with the EMI in US terms was up 8 cents to 797 cents. The Western Market Indicator also had a positive week rising 31 cents to close at 1,384 cents.

The lift was across all Merino types with rises of 4 to 70 cents, with Cardings generally unchanged except in Melbourne where a 33 cent lift was observed.

Crossbred types failed to follow the general uplift losing 12 – 26 cents across the 26 – 30 MPGs on Melbourne, while a small offering in Sydney reported as slightly dearer.

The week ahead

The sale next week is the additional sale rostered in what is normally the Easter recess. This was scheduled to assist processors get wool into their pipelines and to provide another opportunity for growers to sell.

There is only 21,523 bales offered nationally with selling in all centres on Wednesday only.

We have an offal lot to talk about

Key Points

  • Tallow and Meat & Bone meal (MBM) are by products of the slaughtering process.
  • MBM follows a similar pattern to Soybean meal, and tallow with palm and soy oil.
  • The correlations have been reducing in recent years, especially with MBM.
  • There may be a lag effect between MBM and soymeal.

Without sounding like the stereotypical Scotsman, I am a big fan of offal. It’s nutritious and is a good form of recycling. In this analysis, I examine two offal products from the livestock industry – tallow and meat & bone meal. This will provide some insights for livestock producers and those intensive livestock industries.

Let’s start with some definitions.

Tallow is rendered beef/sheep fat, which is solid at room temperature and can be stored for lengthy timeframes without decomposing. Tallow has a wide range of purposes including shop, candles and deep-frying.

Meat and bone meal (MBM) is produced from abattoir waste products which are not suitable for human consumption. The MBM is extensively used in animal feed, with around 650kmt of rendered meal produced in Australia.

Why are we talking about offal? Well, two reasons.

  1. The livestock price within Australia is part of a complex of different components which all add up to buyers capacity to pay. Offal is one of the many components.
  2. Many Mecardo subscribers are users of MBM or tallow.

There is a high degree of interchangeability between agricultural products, as in many cases they are replaceable with one another. For instance, I can buy a beef sausage or if unavailable I can replace with pork.

It is, therefore, a valuable exercise to examine which products are potential replacements for MBM or tallow, as they may provide opportunities to hedge price risk.

MBM and soymeal make an obvious bedfellow, as both are used as protein meals in animal feed. In figure 1 the monthly average price for MBM and soymeal is displayed in A$/mt. The two commodities tend to follow a similar pattern.

Tallow is rendered fat, and plant-based oils are a possible replacement. In figure 2, the monthly average price for tallow, soy oil and palm oil are displayed in A$/mt. All three commodities tend to follow a very similar trend. The closest relationship however seems to be between palm oil and tallow.

In my initial analysis, one of the first things that I noticed was that the correlations seem to be reducing over time.  During the period 2005-2010 the correlations between MBM/soymeal and tallow/palm-soy were extremely high (table 1).

Whilst tallow still correlates at a reasonable level, MBM has lost its correlation. An initial inspection of the data points towards a potential lag between a movement in soymeal flowing through to local MBM pricing.

It may be that further data analysis may yield promising results to improve the ability to use alternate products for price risk management purposes.

Remember to listen to the  Commodity Conversation podcast by Mecardo

What does it mean/next week?:

MBM and Tallow are important co-products in the livestock industry, and equally so to intensive livestock producers.

It must be noted that the data used for MBM was monthly data supplied by MLA. If analysis daily pricing data, it may yield a different response.

For those users of Tallow/MBM, there may be options for hedging price risk using alternate futures contracts such as Soymeal or Palm/soyoil.

The main takeaway however is that both tallow and MBM tend to follow what is happening overseas with their respective ‘partner’ commodities.