Category: Sheep

Strong recovery highlights underlying tight supply

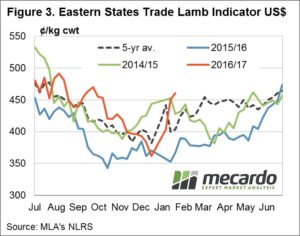
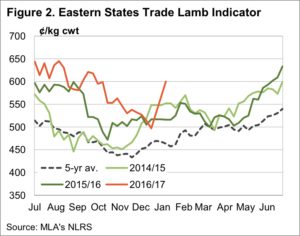
A firm recovery in price across all east coast categories of lamb and mutton reflecting the underlying tight supply anticipated this season to see the Eastern States Trade Lamb Indicator (ESTLI) surge to fresh highs, closing at 664¢/kg cwt yesterday – a gain on the week of 7.4%.

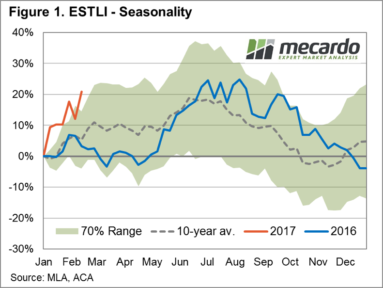
The stellar performance of the ESTLI so far this year reflected in the seasonality percentage price gain chart displayed in figure 1, showing the gains since the start of the season extending beyond the “normal” range (as represented by the green band showing where seasonal price gains have fluctuated 70% of the time over the last decade). Strong weekly gains not limited to trade lambs with the east coast heavy lamb up 7.3% to 671¢, Merino lamb up 5.6% to 596¢ and restocker lamb up 13.4% to 754¢/kg cwt.

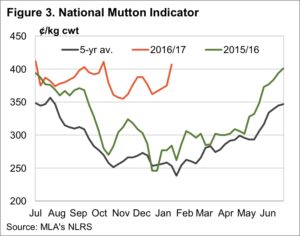
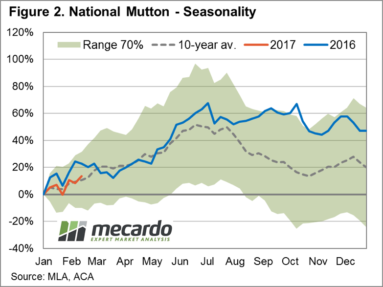
East coast mutton also enjoying some upward momentum on the week, reflective of the trade and heavy lamb gains, to see it rise 7.5% to 441¢/kg cwt. Figure 2 showing the seasonal percentage gains for mutton so far this year respectably tracking along the ten-year average pattern. Although the price pattern for mutton not as robust when compared to the ESTLI performance and the pattern set by mutton during the 2016 season.

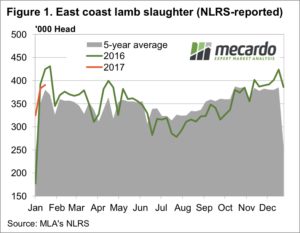
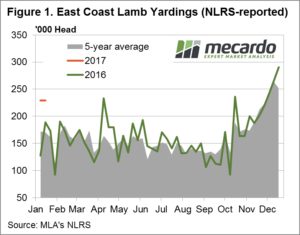
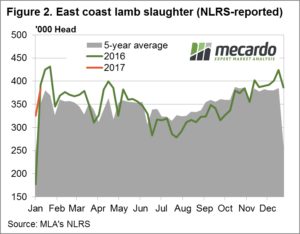
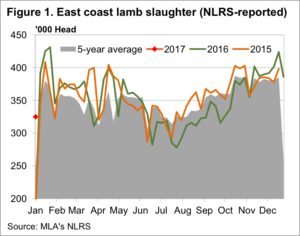
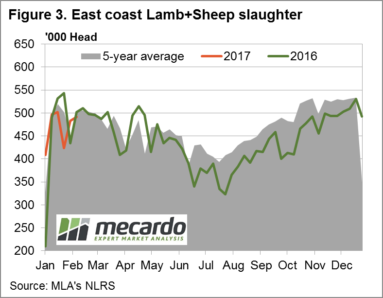
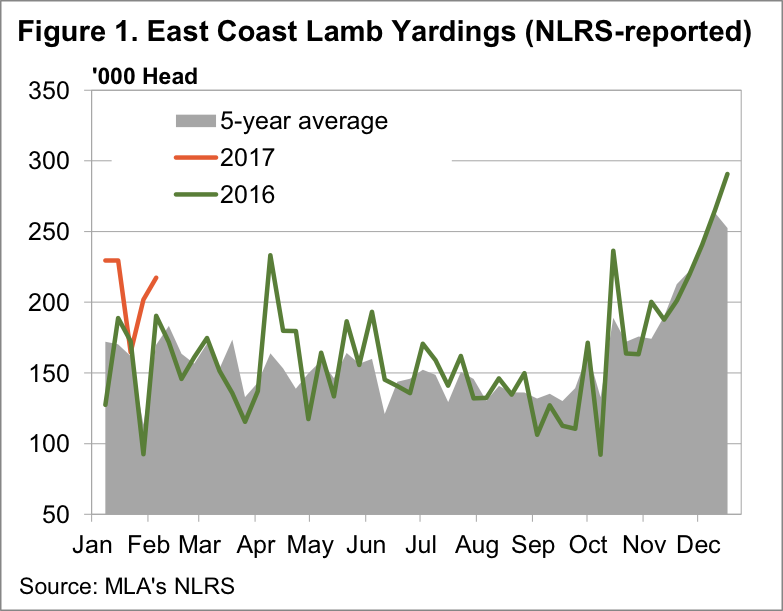
Figure 3 highlighting the underlying tighter supplies of lamb and sheep this season with the combined east coast lamb and mutton slaughter levels continuing to trend below the 2016 pattern and under the five-year average for this time of the year.

To read more about the expected tight supply during 2017 and our ESTLI forecast released in December 2016 click here.

The week ahead
Autumn generally heralds a period of price consolidation for the ESTLI as shown by the sideways movement of the ten-year average seasonal percentage price gain pattern – figure 1. This would suggest that the ESTLI will find it difficult to continue to post the impressive gains recorded since the start of the season and will likely trend along the top of the green band until the next price surge as we head into the usual winter peak.

Interestingly, projecting a percentage price gain mirroring the top of the green band during winter 2017 of around 35% on the starting price this season of 549¢ would place the winter peak for the ESTLI at around 740¢ – not far off our ESTLI forecast released in mid-December 2016 calling for a winter peak of 750-755¢ (see link above).

Simple economics – Lamb supply up price down

Picture1The very high prices seen last week had the desired effect for processors, drawing out very large lamb numbers, and sending prices lower. Sheep are a bit of a different story, especially in Victoria, where yardings waned, and as such prices have largely held their ground.

Figure 1 shows East Coast lamb yardings increased by 15,529 head this week or 7.6% to record their highest February weekly yarding in at least 11 years. No doubt the extra high prices of last week led producers to send anything which was ready to market.

The result of the influx of lambs was lamb prices not quite returning to the prices of a fortnight ago. The Eastern States Trade Lamb Indicator (ESTLI) fell 28¢ this week to sit at 618¢/kg cwt, still a very solid level. Picture2
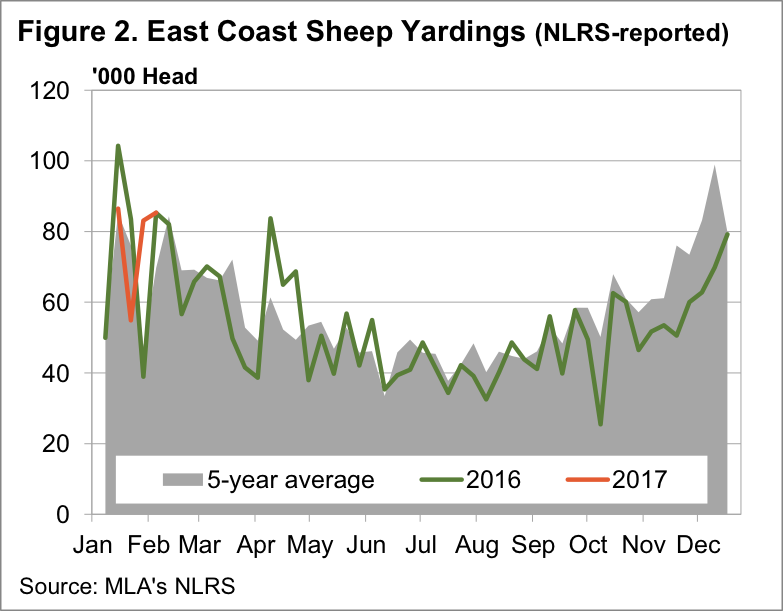
The fall was strongest in Victoria, where trade lambs lost 45¢, or 7%, and moved back into line with NSW and SA.
Mutton yardings only managed a marginal rally, increasing 4.8% to sit at almost exactly the same level as last year. Mutton prices reacted to an extent, falling less than 10¢ in NSW (404¢) and Victoria (444¢), but increasing 13¢ in SA to 402¢/kg cwt.

Picture3
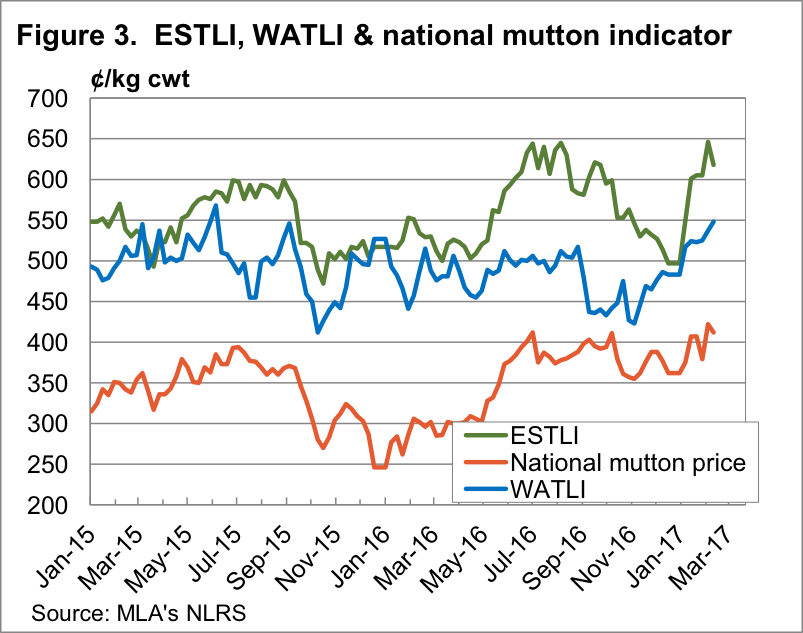
In WA lamb prices continued to play catch up to the east coast, with the WA Trade Lamb Indicator (WATLI) hitting a 19 month high of 548¢/kg cwt (figure 3).
Lamb yardings in the West were up by 62%, with rising prices an indication that export demand is possibly increasing. This improves the prospects for sustaining current strong prices over the coming months.

The week ahead
The south west of WA is set for some very strong rainfall in the coming week, which could see the continuation of rallying prices there. In the east the question is whether this week was the start of a run of lambs, or whether the strong prices pulled out all that is ready. If it is the former prices will continue to ease, if it’s the latter we might see another spike, or at least prices tracking sideways.

Long term mutton prices

Key points:

  • The most recent peak in NSW mutton prices Picture1
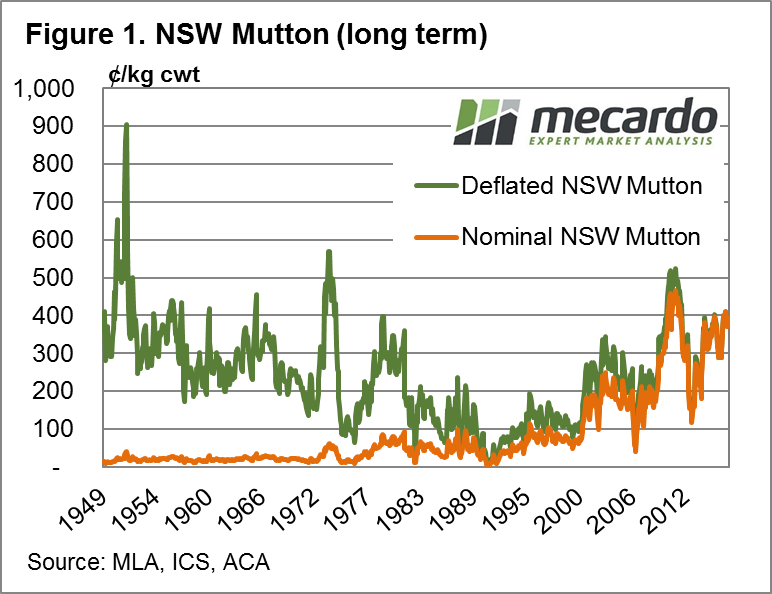
in deflated terms (current day dollars) occurred during April 2011 at 523¢/kg cwt
  • The long term average deflated NSW mutton price is 239¢ based on data going as far back as 1949
  • Since 1949, NSW mutton prices have spent 70% of the time between 115¢-362¢ and 95% of the time between 0¢-485¢

Last week Mecardo released an article on long term deflated prices for the Eastern States Trade Lamb indicator (ESTLI) and this week we have published a similar analysis focusing on long term mutton prices, looking at NSW mutton prices since 1949.

Click here to read the deflated ESTLI article.Picture2

Figure 1 shows the price pattern for both nominal and deflated average monthly NSW mutton prices going back to 1949. Clearly, the 2016 season was a good one for mutton prices and the 2017 season bodes well with the NSW mutton January average of 394¢/kg cwt just sitting 15.4% shy of the nominal average monthly peak that occurred during April 2011 at 466¢. In deflated terms the current mutton prices are holding up well too with a deflated peak in 2011 at 523¢, not too far away from the current level.

Indeed, figure 2 highlights just how well mutton prices have been in current day dollars with the market sitting well above the long term deflated monthly average of 239¢/kg cwt – (blue dotted line). The green 70% range between 115¢ – 362¢ shows were deflated mutton prices have traded for 70% of the time since 1949 and the red lines show the range that encompasses 95% of the variation in price (0¢-485¢/kg cwt) over the same time frame.

Figure 3 displays the same deflated mutton Picture3
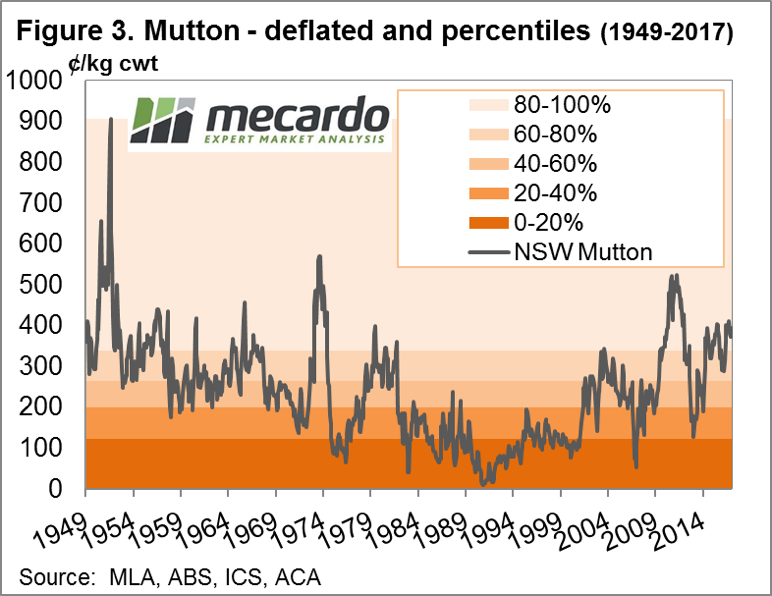
price series overlaid with percentile ranges which shows that the current average monthly NSW mutton price has remained in the 80-100th percentile range since April 2016. Unquestionably, mutton prices are holding firm with the January average of 394¢ sitting at the 90th percentile when compared to the deflated price data series since 1949.

What does this mean?

As outlined in the “Mutton hitting the ceiling” article from last week (see link above) there is a case for mutton prices continuing to firm into the 2017 season. While the deflated data suggest we are at reasonably high historic levels there have been times in the past when mutton prices were higher in real terms.

NSW mutton prices wouldn’t be considered to be at extremely high levels until above 485¢ and have reached as high as 523¢ (in current dollar terms) within the last five years, so mutton prices near or slightly above 500¢ this season aren’t out of the question.


Tight supply maintains the strong prices

Meat and Livestock Australia (MLA) slaughter figures
confirmed that January lamb supply has been tighter
than usual. The result has been very strong summer
lamb prices, at a time when the market has tracked
sideways in recent years.

Figure 1 shows east coast lamb slaughter for the week
ending the 20th of January was well below last year.
The 18% reduction in numbers seems to have been due
to the good spring, which saw many lambs finish early
and hit the market in December, leaving a dearth of
numbers in January.

The result has been the best January lamb prices since
2011, with the Eastern States Trade Lamb Indicator
(ESTLI) managing to spend its third week above 600¢.

The ESTLI did ease slightly this week, but only 2¢ to
finish at 602¢/kg cwt. Mutton values took more of a hit,
losing 12¢ to hit 395¢/kg cwt as supply improved.

The question now for lamb markets is whether they can
maintain the strong levels. The five year average would
suggest they can, but figure 2 shows that in the last two
years February has seen the ESTLI ease. Lower prices in
February are likely due to domestic demand waning after
Australia Day and supply improving as shorn lambs start
to come back to the market.

As always the price trend will depend on how many lambs
are actually out there, and as indicated by survey results,
it could be fewer this year, so lamb prices could find some
solid support in the 560-580¢/kg cwt range.

The Week Ahead

We expect prices to ease over the coming weeks, but not
by much. Lamb producers not likely to be forced to sell in
the short terms, so may hold out for stronger prices if we
see any correction.

Mutton values should recover from this week’s correction,
it’s hard to see more supply coming forward given the feed
situation and the wool price.


Input update: Fertilizer and Fuel (Jan 2017)

Key Points

  • The August-November average diesel price at port was $106/l
    versus $116 for the past month.
  • There is a global glut of fertilizers on the market which is unlikely to rectify anytime soon.

The harvest is all but done, now is the time to start looking towards next year. There will be changes in planting, a little more of this and a little less of that. However, regardless of what you plant you will be burning diesel and spreading fertilizer. In this report, we look at these two important inputs.

In the last two months’ millions of litres of diesel
will have been burnt across the grain growing regions
of Australia, and in reality, we are only a few months
away from starting all over again with seeding and
the diesel bills will start flowing in. In figure 1,
the average port diesel price for Australia is
displayed since the start of 2015. Assuming that
most farmers purchased their fuel well in advance
of harvest as recommended by Mecardo early in 2016,
the input costs for fuel for the 2016/17 harvest
will be considerably lower than current levels.

The average diesel price for Aug/Nov was A$106/l,
versus A$116/l for the past month. Although diesel is
creeping back up diesel prices have spent a lot of the
last ten years above current levels (figure 2). In late
December OPEC agreed for the first time in eight
years to cut oil production, which alongside improving
economic conditions has led to an increase in crude
oil prices and therefore diesel. The market for oil is
hard to predict and in coming months it is important
to keep a close eye on the market with a view to
locking in fuel for the coming season either through
swaps or fuel contracts.

The picture is rosier when it comes to fertilizer. In
figure 3, we can see that both DAP and Urea are both
pricing at good levels since the start of the decade.
Although Urea has seen an uptick in past months, the
outlook for fertilizer supply still points to a surplus for
at least the next two to three years. The supply issue
aside the real risk is a fall in the A$ increasing the
cost of imports.

What does it mean?

The fertilizer market remains at low levels; however,
the market outlook remains bearish to neutral reducing
the impetus to go out straight away and stock up.

In terms of fuel the outlook is less certain, and looking in
a proportion of fuel requirements in advance could be an
advisable risk management strategy.


ESTLI holds firm despite strong throughput and currency

The Eastern States Trade Lamb Indicator (ESTLI)
held onto the strong gains since the start of the
year remaining above 600¢/kg cwt this week
in the face of solid lamb throughput figures,
particularly from NSW, and a resurgent A$ –
boosted by a Trump impacted weaker US$.

Figure 1 shows the east coast lamb yarding
figures for this week opening the year at
229,495 head, some 21.6% above the yarding
figures for this time last season and 34.7%
higher than the five-year average. Overall east
coast lamb yardings given a boost from NSW
throughput, which came in 26.4% above figures
recorded for this week in 2016 and 58.9% higher
than the five-year average for this time of year.

After a stronger start to the season slaughter figures
have returned to levels consistent with the 2016
pattern – figure 2. East coast lamb slaughter for the
week ending 13th January reported at 382,865 head,
a mere 2.3% below the slaughter figures for the same
week in 2016 and 8.9% above the five-year average
for this time in the season.

The ESTLI closing yesterday at 609¢/kg cwt, a
10¢ gain on last week. Not as impressive as the
previous week’s rally but a gain nevertheless.
Combined with an A$ 5% higher than where is
finished 2016 this places the ESTLI in US$
terms the highest it has been since September
2016 – figure 3. Despite the recent A$ strength
the currency currently trading at 75.5US¢ is still
below the two-decade average of 76.25US¢.

The Week Ahead

The A$ recovery over the last month has been on
the back of broad US$ weakness with financial
market nervousness setting in as we draw closer
to a President Trump inauguration. Expect regular
currency volatility as the new leader settles in and
his unpredictable style of communication via Twitter
running of the country continues to unnerve the
market. Any significant impact on export demand
for Australian sheep and lamb product unlikely
unless a prolonged period of US$ weakness pushes
the A$ above 85-90US¢.


Call it the Kekovich effect

It’s been an extraordinary week in lamb markets. Lamb markets have Figure 1
reached high which are usually seen in winter in the second week of
January, a time when supplies are usually good. When prices rise it’s
due to falling supply or rising demand, we suspect it’s a combination,
helped by the ‘Kekovich Effect’.

Figure 1 shows that in the second and third week of January in the last
two years, and on average over the last five years, we have seen the
largest slaughter of the first half of the year. Normally heavy slaughter
equates to lower prices.

However, figure 2 shows that despite high slaughter rates, prices in Figure 2
January have been steady or higher. How do we explain higher supply
and steady or higher price? Call it the ‘Kekovich Effect’, driven by Meat
and Livestock Australia’s (MLA) Australia Day lamb marketing campaign.

Demand for lamb obviously increases before Australia Day, lamb processors need more lambs, and supply is usually compliant in early January.

This year it seems some processors have been caught short. This week’s
Wednesday and Thursday sales gave a taste of what processors are willing to pay, with many lambs selling for well over 600¢, and the Eastern Figure 3
States Trade Lamb Indicator finishing at 599¢/kg cwt.

Light lambs are doing even better, with restockers paying 661¢, and
light lambs selling for 607¢ on the east coast.

Mutton has also joined the party, with the National Mutton Indicator (figure 3)
rising 32¢ to hit a three month high of 407¢/kg cwt. Mutton demand is not
likely to have increased like lamb, but rising prices suggest small stock
processors can’t find enough lamb, and are turning to mutton.

The Week Ahead

As outlined earlier in the week, the heavy supply of December is
coming home to roost, with few shorn lambs ready, and sucker
lamb supply basically done. The Kekovich Effect has at least a
week to run, which suggests lamb prices might stay strong for
another week or so.

After that, don’t be surprised to see lamb prices ease back, as supply
improves, and demand weakens post the Australia Day demand peak.