Tag: Analysis

Supply low, AUD strong & market positive

While the Wednesday opening to the market was positive, Thursday saw a retracement to produce an overall cheaper market.

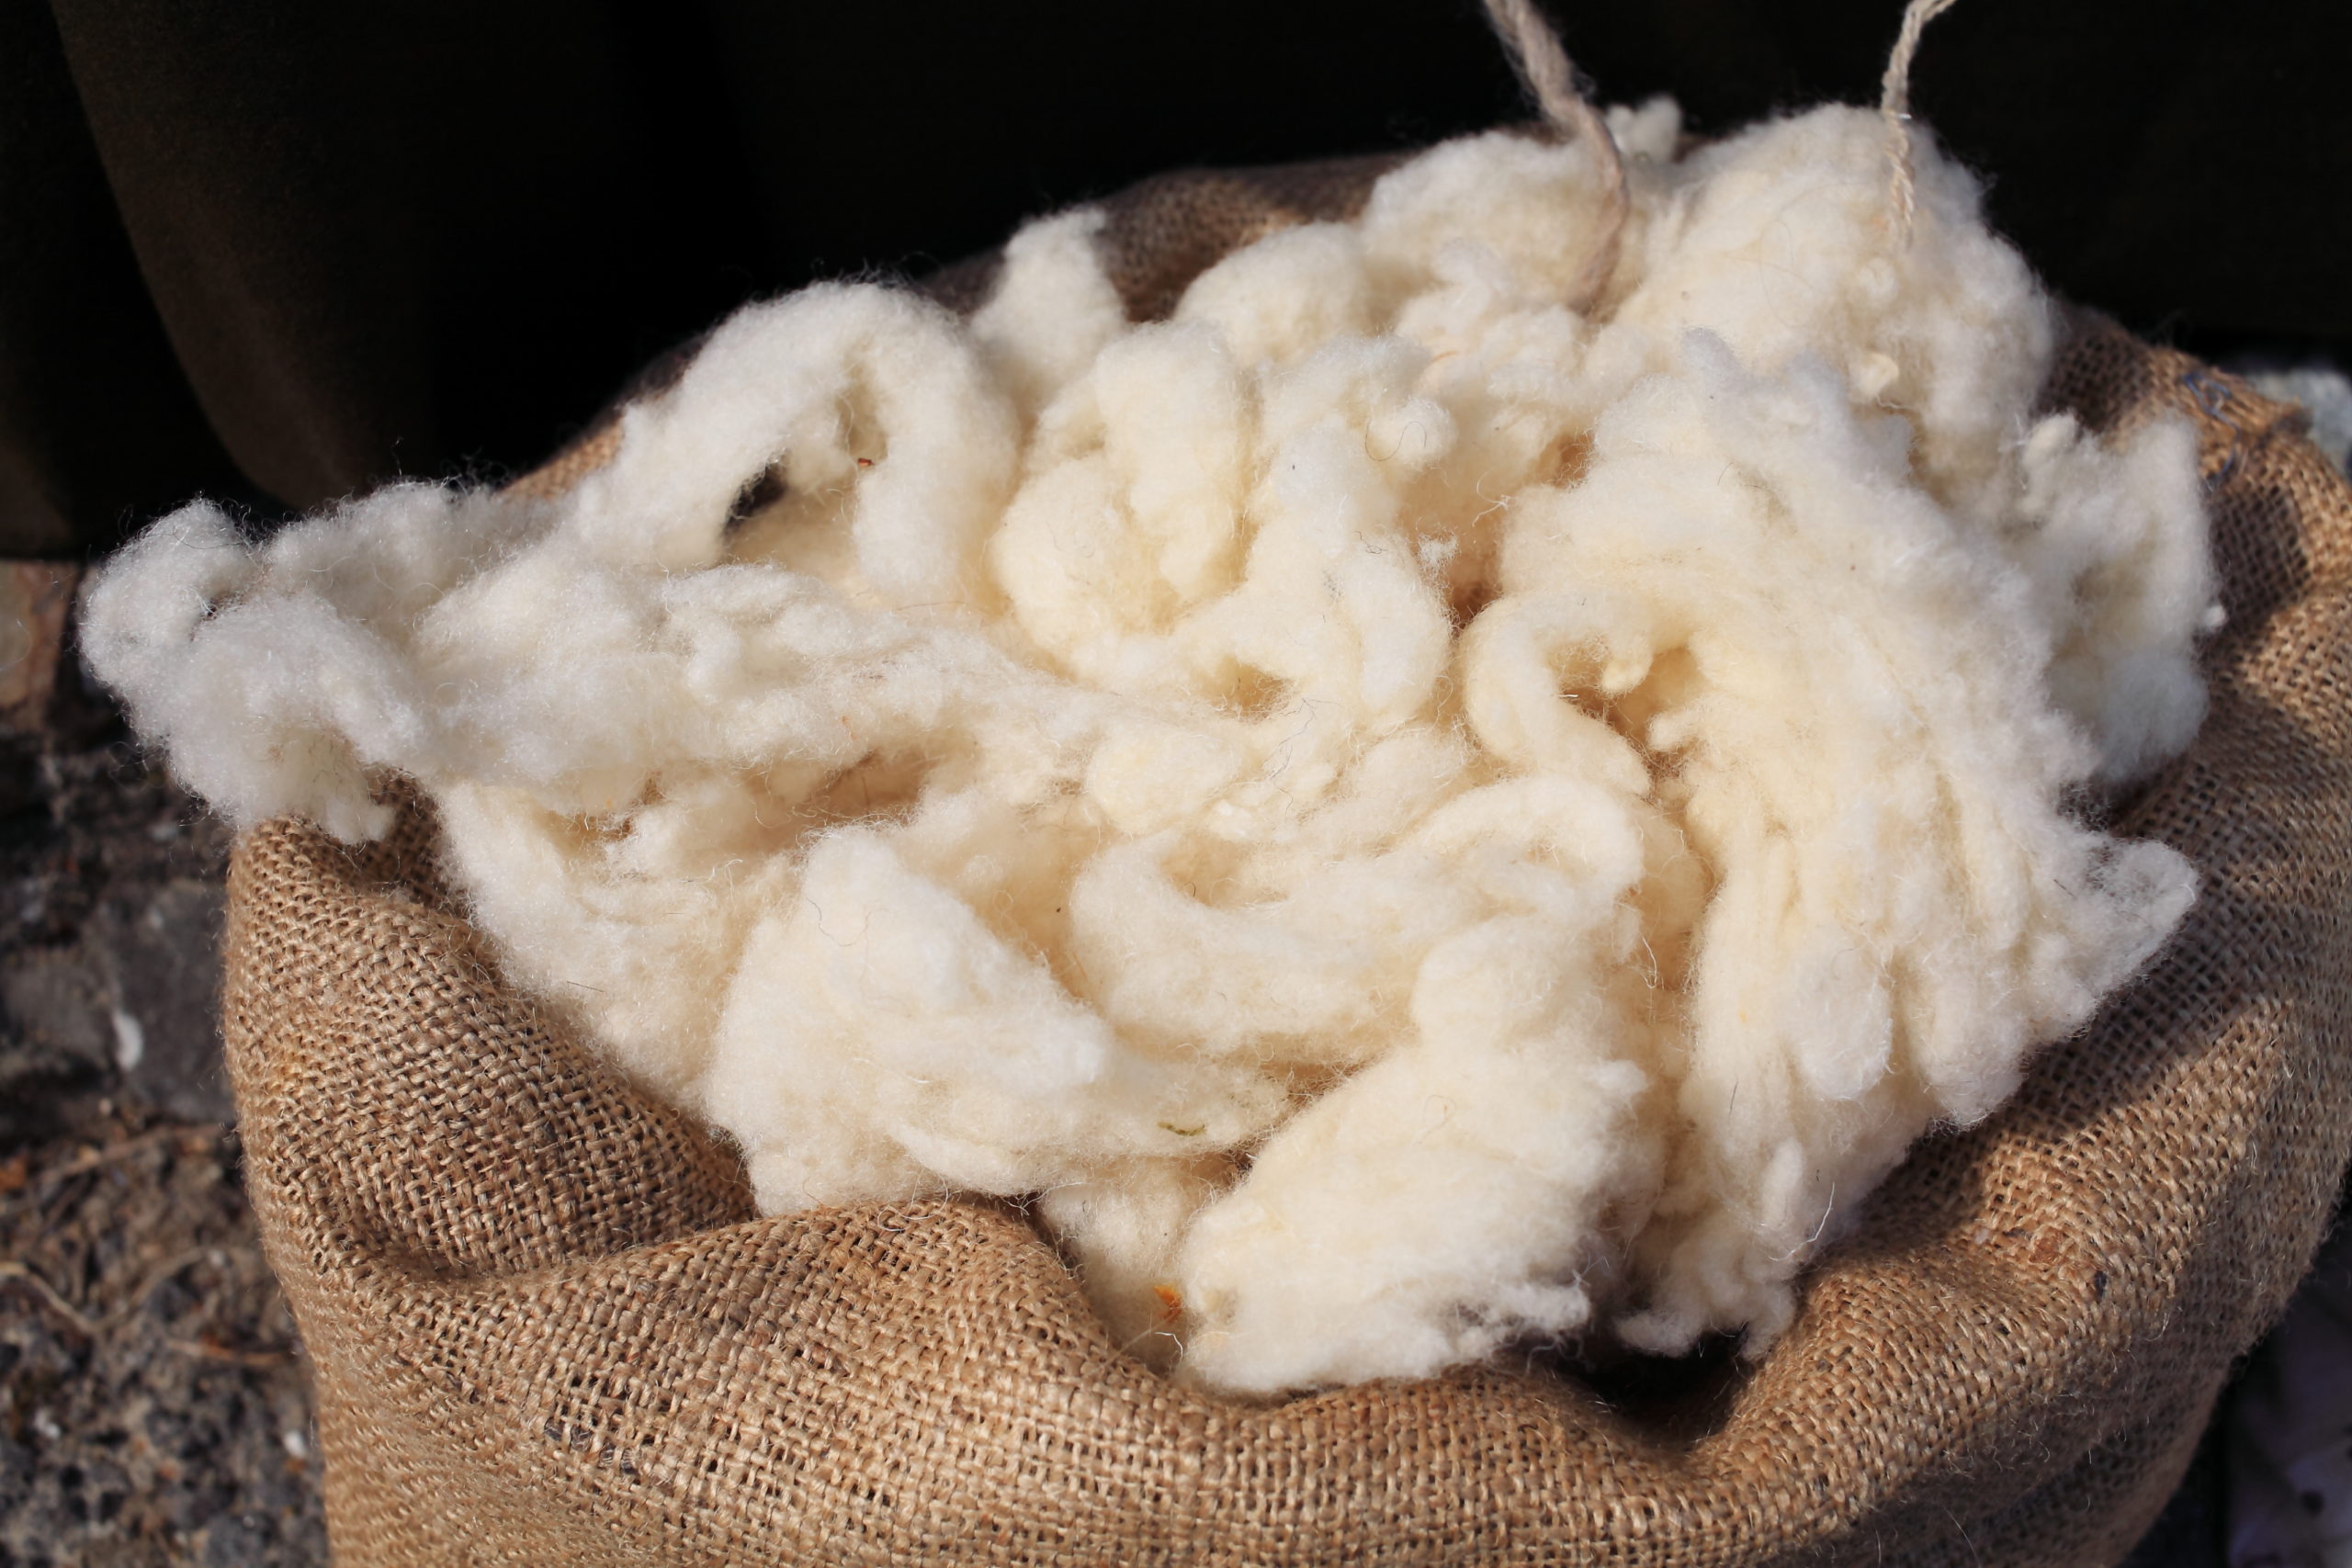
The AUD was strong, hurting buyers buying capacity, while a concerning report was that there was insufficient supply of good yielding wool to fill orders. The flip side to this was that the large offering of low yielding wool weighed on the market with buyers struggling to fit it into orders.

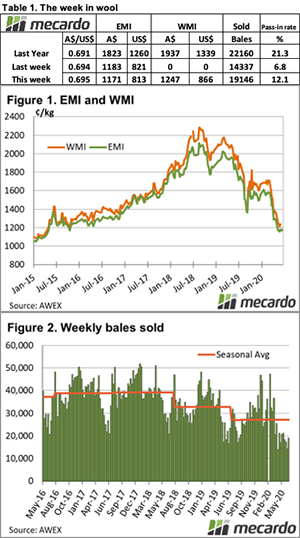
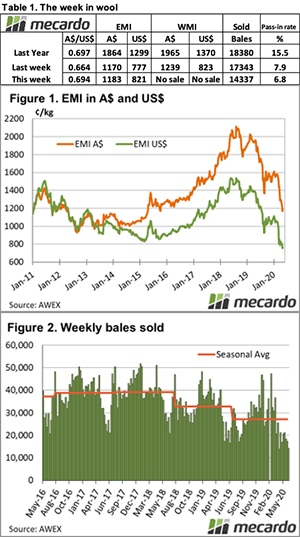
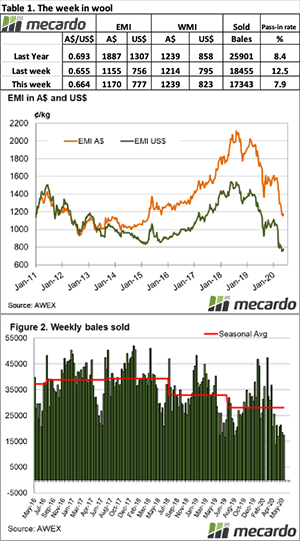
The Eastern Market Indicator (EMI) gave back 12¢ this week to close at 1,171¢. The Australian dollar was quite strong hovering around US$0.70, with the EMI in USD terms falling by 8¢ to 813¢. With Fremantle back selling this week, the Western Market Indicator played a bit of “catch-up” finding an 8 cent lift to settle at 1,247¢.

Turnover increased to $25.02 million this week with all centres involved, however, the average bale value of $1,150 was $200 per bale back on last week, taking the season to date value to $1,922 million.

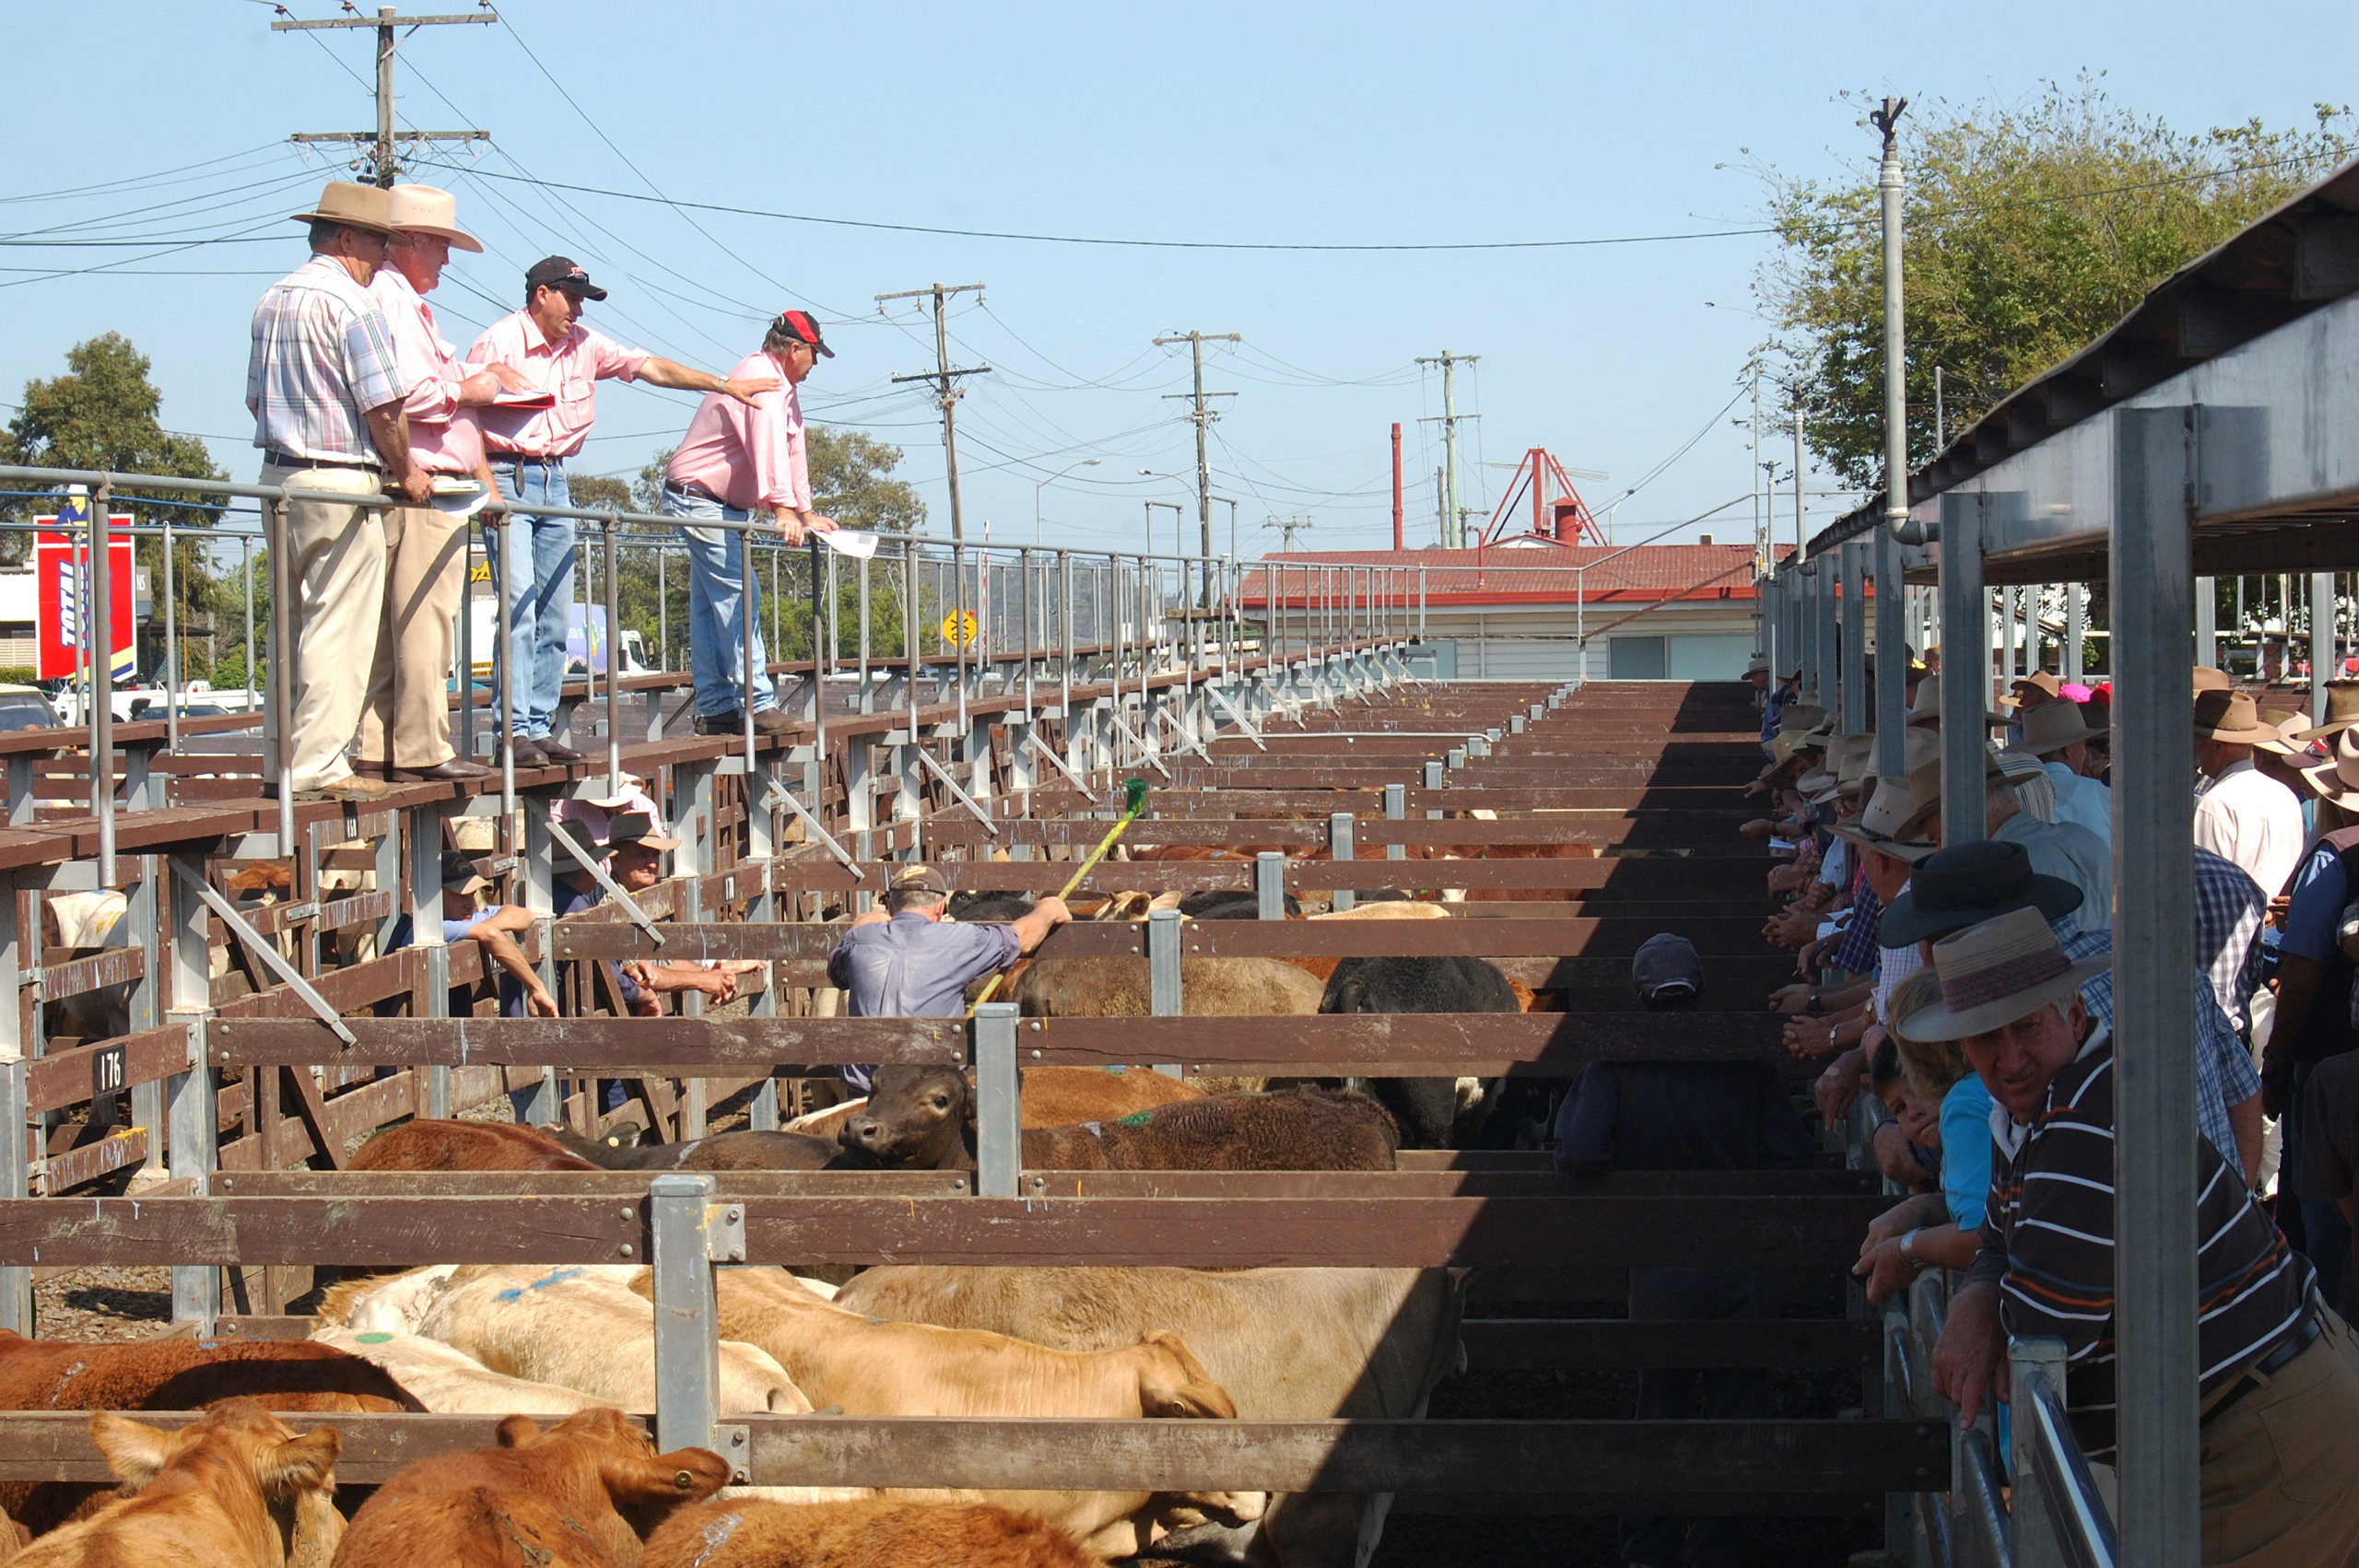
The softer market influenced a lift in the pass-in rate to 12.1% nationally, 5.4% higher than last week’s level. This resulted in 19,146 bales clearing, almost 5,000 more than last week.

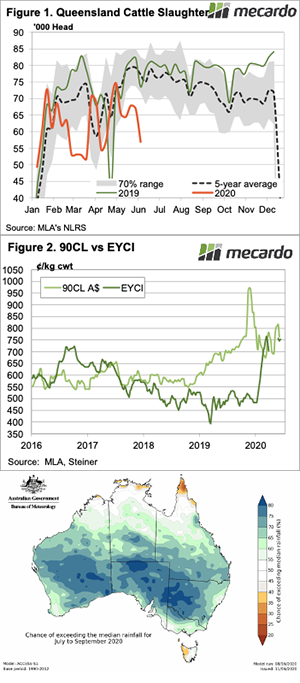
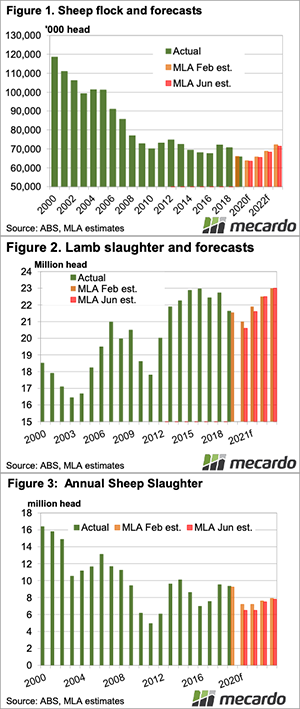
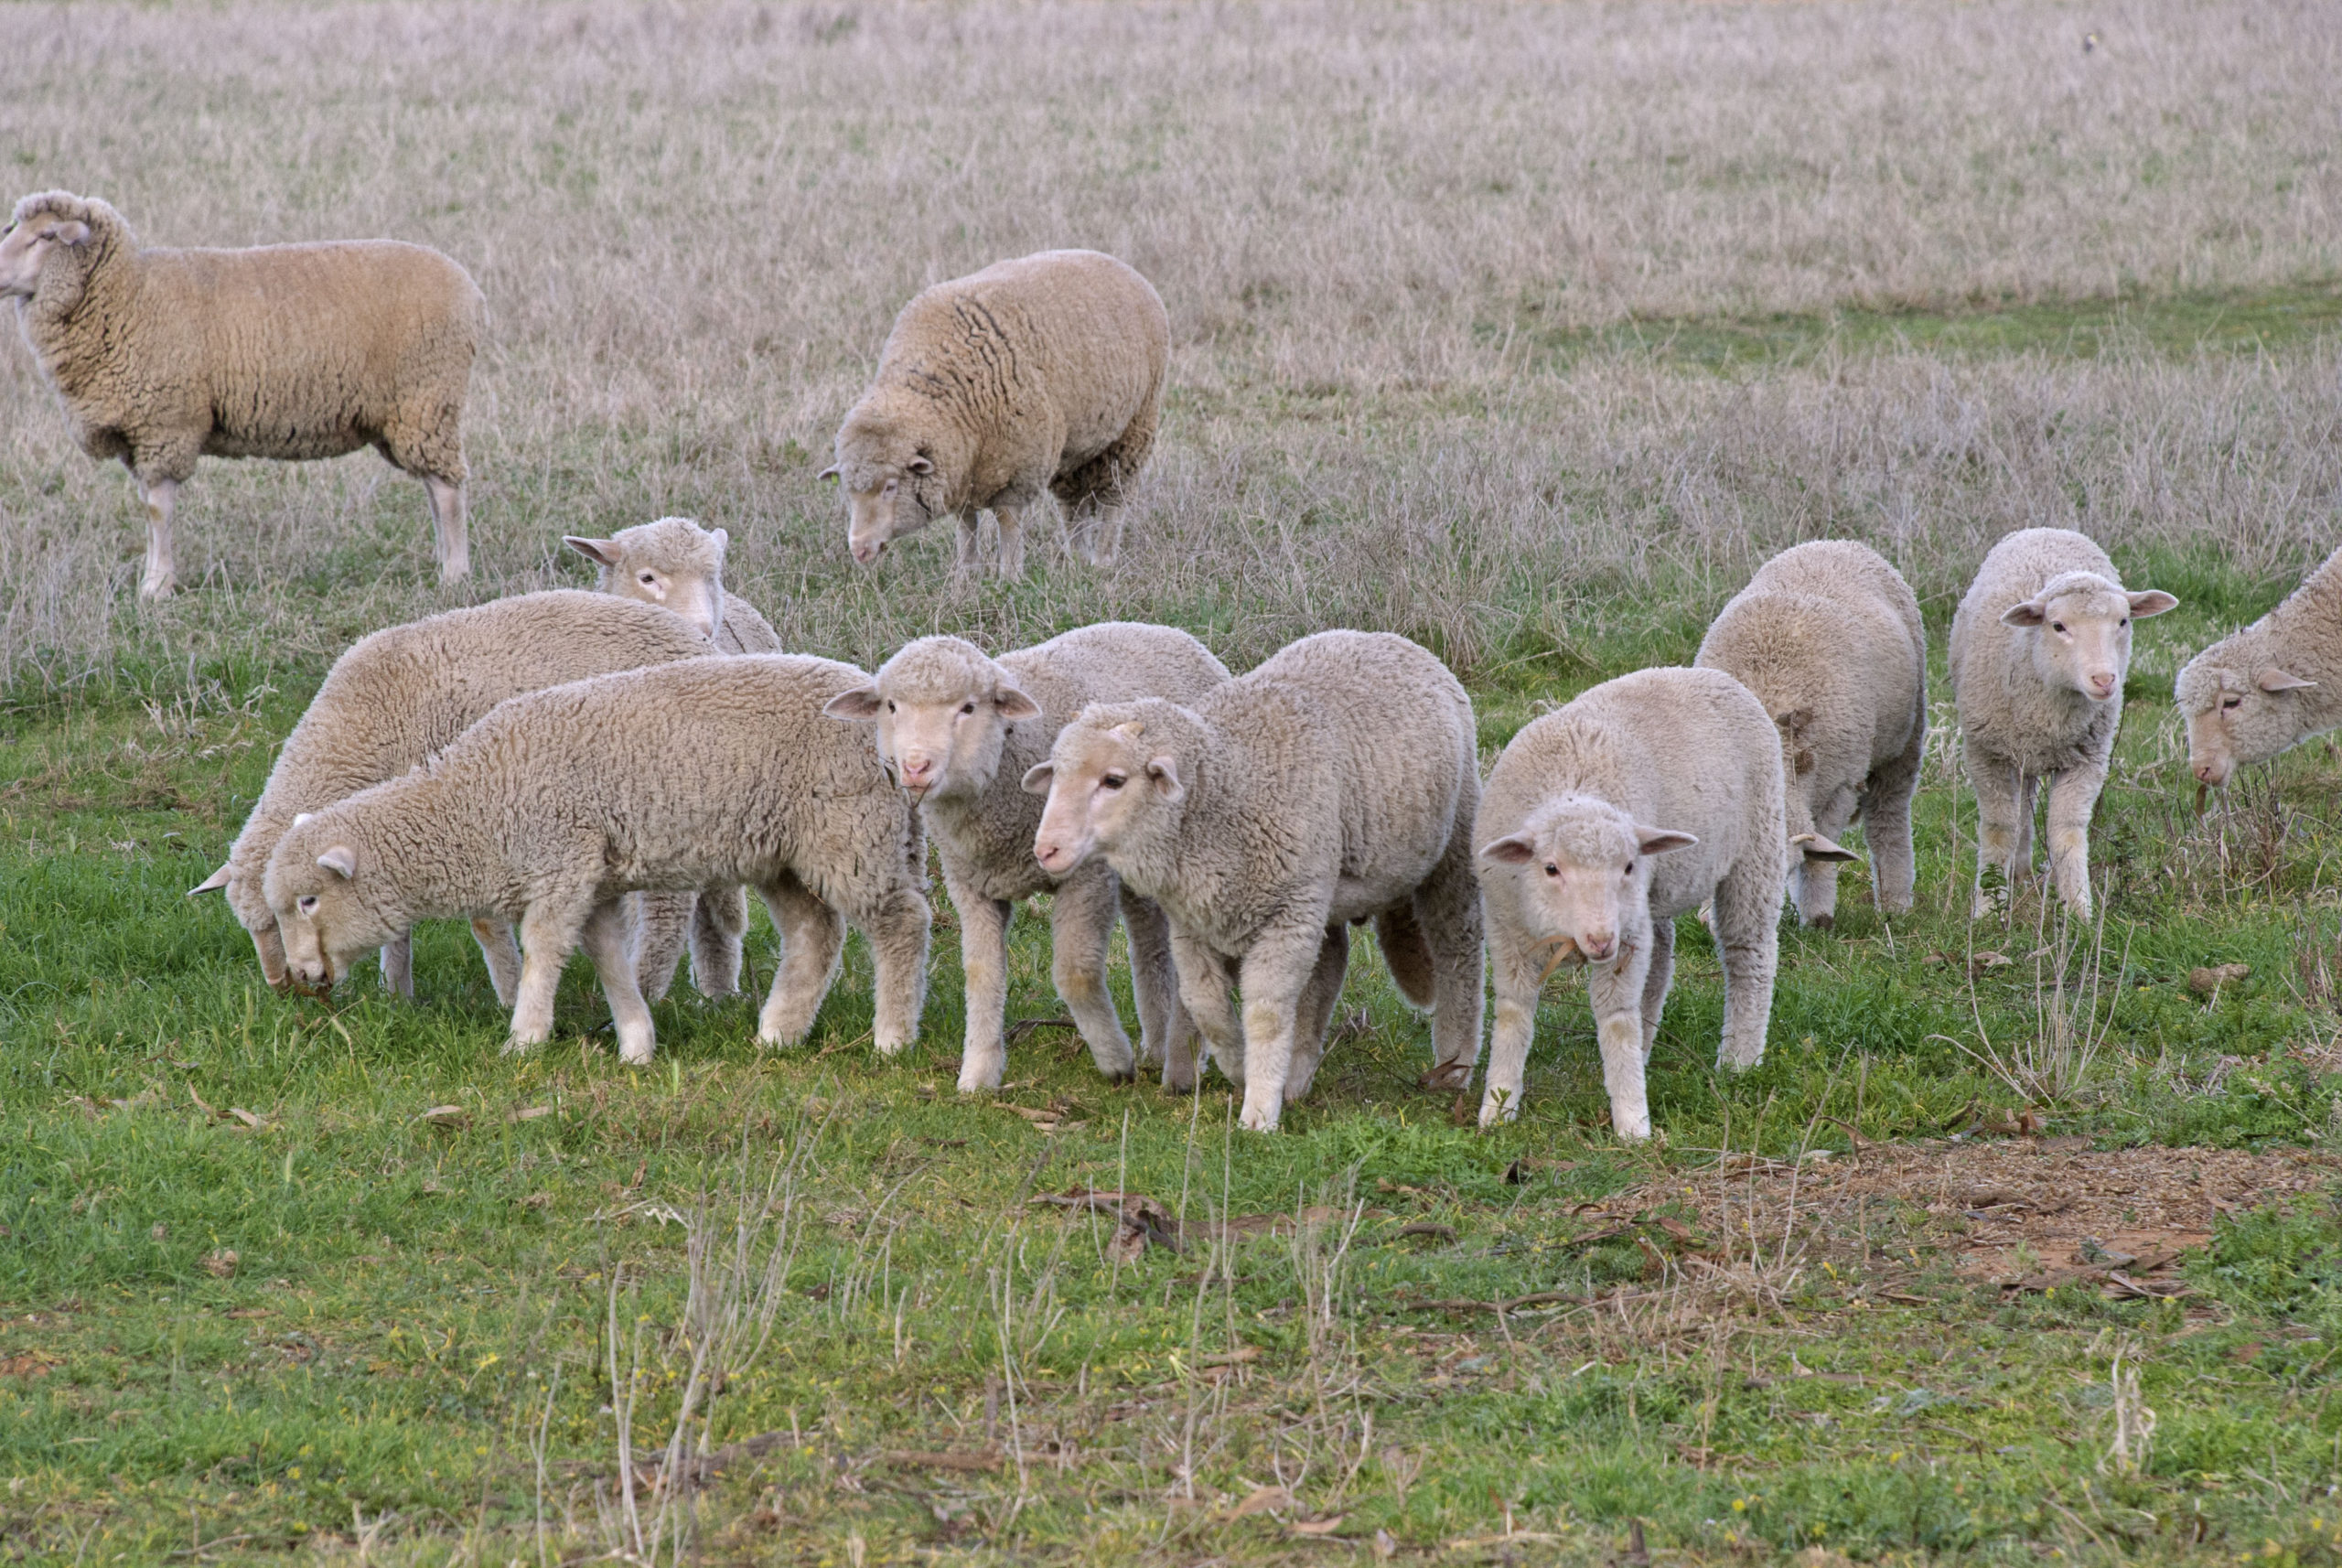
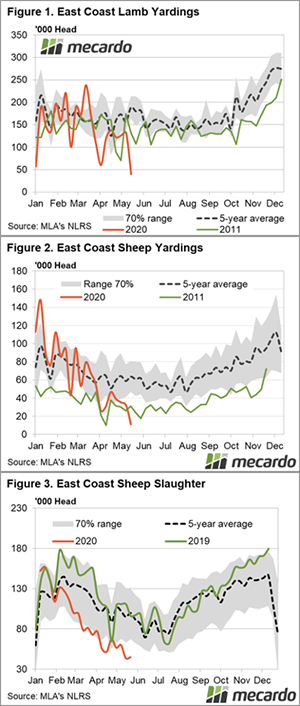
This week on Mecardo, Andrew Woods looked at the sheep flock and noted “The Australian sheep flock has moved into an expansionary phase, based on early 2020 rainfall.” Of course, any continued expansion from here (and consequently changes on the sheep flock) will depend on winter/spring rainfall in the key sheep regions.

While Fremantle played catchup on last week’s sales, overall the market was cheaper, ending its two-week positive run. The Crossbred sector was the shining light rising against the general trend and supporting the EMI to some degree.

Cardings continued to improve also and posted on average a 14¢ lift average across the all centres.

The week ahead

Next week’s national offering declines to just 16,800 bales with Fremantle not offering. Sydney & Melbourne will sell on Tuesday & Wednesday only.

Export price correction but restockers don’t care

Cattle supplies have continued to tighten in June, with Queensland slaughter moving sharply lower last week.  While prices are running hot, there were some worrying signs in export markets and with currency movements.

In the week ending the 5th of June, it looks like Queensland cattle slaughter fell off a cliff.  Figure 1 shows that Queensland posted its lowest full week slaughter level since March.  The closure of Dinmore for a couple of weeks was likely responsible. Lower slaughter driven by plant closure, is less likely to impact price on the positive side, it could actually see prices fall.

Prices didn’t fall, which suggests the supply of available slaughter stock eased in line with the demand reduction. In Queensland over the hooks indicators all gained ground, with only Cows (512¢/kg cwt) remaining under 600¢/kg cwt.

The rally in export beef prices, as indicated by the 90CL came to a halt last week. Figure 2 shows the 90CL Frozen Cow in our terms losing 53¢ to head back to 763¢/kg swt (Figure 2).  The fall was partly driven by the Aussie dollar heading back towards 70¢ but was largely due to a 2.6% fall in US prices.

With US cattle slaughter reportedly back at 95% of the levels of this time last year, all beef prices are on the wane at wholesale. Obviously, this means weaker demand for imported beef and lower prices.

Restockers with grass tend to take little notice of export beef prices, and they, along with domestic processors and feeders helped lift the EYCI a few cents above 750¢/kg cwt.

Next week.

There is some rain forecast for South East Queensland next week, which will help support young cattle prices. The question is how far export prices can drift before processors start to hurt and cut slaughter rates and over the hooks quotes.

On the weather front over the medium term, things are looking rosy again.  Figure 3 shows the Bureau of Meteorology (BOM) three month outlook, and after looking decidedly drier last week, has reverted to previous positive projection.

Trimming a bit more off sheep and lamb supply

Key Points

  • MLA’s sheep industry projections have wiped more supply from the coming years.
  • Lamb slaughter and the flock is expected to recover in 2021, but sheep slaughter will take longer.
  • Supply driven price rises for lamb are likely to ease, but sheep supply will support the complex.

Meat & Livestock Australia’s (MLA) industry projections were released this week, and there was no improvement to supply outlooks. In fact, slaughter rates and flock numbers that have come to light so far this year, will see supply stripped back further for the next couple of years.

The National Sheep flock was already forecast to hit a low not seen in over 100 years. With the Australian Bureau of Statistic (ABS) official number for June 30 2019 coming in at 259,000 head, or 0.4% lower than earlier estimates, MLA stripped another 200,000 head out of the 2020 forecast it made in February.

MLA now expect the flock to hit 63.5 million head on June 30, down 3.5% on 2019.  Last year was the lowest flock in over 100 years, but 2020 is going to better it, so to speak.

MLA’s flock estimates were decreased by similar amounts out to the 2023 flock. By 2023 the flock is expected to have recovered back to 2017-18 levels. We can see in figure 1 that the flock can rebound sharply. From 2016 to 2017 the flock gained 4.6 million head or nearly 7%.  The forecasts are putting flock growth at 3 to 5%.

The lower flock and the very tight lamb slaughter rates for the year to date, saw slaughter estimates also adjusted down for the June projections. Figure 2 shows lamb slaughter is still set for an 8 year low in 2020, but it is 2% lower than the previous forecast.

After close to a 5% fall in 2020, lamb slaughter is expected to bounce back to 2019 levels in 2021 and reach record levels in 2023 of 23 million head.

With the rain and subsequent lower sheep supply for the year to date, it is sheep slaughter forecasts which have taken the biggest hit. Sheep slaughter for 2020 and 2021 was decreased by 10%, both to eight year lows of 6.5 million head. An extra million head is expected to go over the hooks in 2022 and 2023, but it is hard to see sheep slaughter getting back to the highs of 2018 and 2019.

What does this mean?

Much of the decrease in lamb supply this year has already been accounted for, and MLA expects strong growth in 2021.  This suggests we might be seeing the last of lower year on year lamb slaughter, and as such, the growth in prices.

On the other side of the coin, we have sheep slaughter which is expected to be very low for two years, and won’t recover to the levels of recent years for at least four years.  This will no doubt support sheep prices in general, as will the flock rebuild.

And we have prices!

While MLA’s COVID indicators have been a good substitute for our normal price data over the last few months, we’re happy to see the full suite of price indicators again. Now on the other side of the worst of the uncertainty (we hope), the before and after confirming prices have gained ground.

The last time we saw an official Eastern States Trade Lamb Indicator (ESTLI) was on the 25th of March where it was sitting at 873 ¢/kg cwt. Tracking the CV indicators over the last two months, and looking at Mecardo’s theoretical ESTLI in Matt Dalgleish’s recent article (view here) we know tight supply has provided price support during demand uncertainty. Fast forward over two months and Figure 1 shows the ESTLI closing this week at 934 ¢/kg cwt, 7% higher than last reported. This is just 35 cents shy of where the theoretical model pinned the ESTLI the week prior.

Mutton has also come back with a bang. The National Mutton Indicator ended the week at 715 ¢/kg cwt, an impressive 128 ¢/kg higher than the same time last year (Figure 2).

Checking back in on the CV19 indicators for week on week comparison, the CV19 Mutton indicator rose 5% to $189/head. The restocker and processor lamb indicators didn’t perform as strongly, with both largely tracking sideways to end the week at $164/head and $222/head respectively.

Mutton prices at current levels have no doubt swayed some producers to sell. East coast sheep slaughter continued to lift last week, up 35% on the week prior. It’s now verging close to the lower end of the 70% normal range for this time of the season which is still 38% below last years levels (Figure 3). East coast lamb slaughter on the other hand has continued to hold stable with just a 3% decline on last week.

Next week:

We aren’t too far from the record mutton prices recorded in mid March and we’re likely to get closer still. Looking at the rainfall forecast for the next few days is promising for those watching grass grow. Strong prices will continue to tempt sheep to slaughter, but we can’t see any big lift in volumes any time soon.

Supply low, AUD strong & market positive

The market opened with a positive result on Tuesday as Sydney played catch-up to the strong finish of last weeks market, while Melbourne was quoted as ‘firm’.

This trend continued to the close on Wednesday with solid competition and a good clearance rate despite the headwind of a surging AUD.

The Eastern Market Indicator (EMI) lifted another 15¢ or 1% this week to close at 1,183¢. The Australian dollar was quite strong up 3 cents to US$0.694, which elevated the EMI in USD terms by 44¢ to 821¢. This caused a 5.3% lift in US$ terms. With Fremantle not selling, the Western Market Indicator remained at 1,239¢.

Turnover this week tipped below $20 mill for the first time in memory to $19.62 million as a result of the smaller offering. This moved the average bale value to $1,368 per bale, a lift of $80 per bale, taking the season to date value to $1,897 million.

With the solid market, the pass-in rate was lower at 6.8%, 1.1% below last weeks level. This resulted in 14,337 bales clearing, 3,000 fewer than last week.

AWTA volumes fell heavily in May (down 28.5% in farm bales). The season to May, volumes are down a milder 8.7%.

This week on Mecardo, Andrew Woods looked at the relationship of AWTA test volumes compared to Auction sales in order to get a view on the build-up of grower stocks (view here).

Auction sales for the season are well below the standard 85% of AWTA volumes, tracking at 72% of AWTA volumes in 2019-2020. This implies that farmer stocks have increased by around 13% of annual production in 2019-2020. Given the fall in demand, this outcome is not surprising.

While Sydney played catchup on last weeks closing sale day, the market was fully firm, an impressive result given the rampaging AUD. Less than 2,000 bales of Crossbred wool came forward and met solid demand, with 26 – 28 MPG indicators posting 12 – 41¢ gains.

Cardings joined in the spirit and posted on average a 24¢ lift across the two centres.

The week ahead

Next week’s national offering increases to 24,140 bales with Fremantle joining in with a 4,800 bale offering. Sydney & Melbourne will sell on Wednesday & Thursday while Fremantle will offer on Wednesday only.

The increased demand this week despite a higher Au$ should support the market next week.

It will be nice to see you EYCI

It has been a week since Meat & Livestock Australia’s (MLA) Officer’s returned to saleyards, and now have and Eastern Young Cattle Indicator (EYCI) for the first time in 9 weeks. It remains volatile, however, opening high and losing 10¢ in a couple of days.

The EYCI opened up at 756¢ earlier in the week, easing a little by yesterday to close its first week back at 746¢/kg cwt.  There should be no complaints from sellers, with the EYCI currently 50% higher than this time last year.

Buyers on the other hand, are paying through the nose. Over the hooks quotes for finished cattle were higher this week, around 600¢/kg cwt. The EYCI/finished spread only gets this wide when restockers are on a rampage.

Strong prices are drawing some more cattle out.  East Coast slaughter has rallied for the second week in a row. Last week cattle slaughter was up 3% (Figure 2), but it is down 18.5% on the same week last year.

On average, cattle slaughter peaks at this time of year, and processors would be concerned if we are in for a gradual decline in slaughter supplies from here.

The rising Australian dollar is not great for cattle prices, but for last week at least, increasing US 90CL export prices outstripped the currency increase. Figure 3 shows the bounce in the 90CL continues, pushing up to 816¢ in our terms.

Next Week

This week’s pause in the price rise might signal a peak for now.  Supply will be tight, but there remains some risk of lower prices for those carrying cattle through the winter. If the rain continues to come, it is hard to see prices falling too far until finished cattle start flowing off grass.

34 micron prices low against polyester staple fibres

Key points:

  • 34 micron prices are trading at 25 year lows in Australian dollar terms.
  • In US dollar terms, 34 micron prices are trading near the low levels reached in the last 1990s and early 2009.
  • In US dollar terms the 34 micron price has returned to low levels of basis to polyester staple fibre prices, similar to that seen in the late 1990s and the middle of the last decade.

Broad crossbred prices continue to plumb new lows, a mere five years after they had spent five years (2010 to 2015) trading at stratospheric levels. This article takes a look at an Australian 34 micron prices series and its relationship to polyester staple fibre prices.

In Figure 1 a 34 micron price series from Australian auctions is shown running from mid-1995 onwards, along with a polyester staple fibre (PSF) price series. In Australian dollar terms, the 34 micron price series is at 25 year lows, close to 200 cents which is well below previous periods of low prices such as the late 1990s and the middle of the last decade. The PSF price series bubbles along at appreciably low levels.

Figure 2 shows the same series as Figure 1, but in US dollar terms as the supply chain would generally view them. The high prices from 2002 in Figure 1 disappear (a function of exchange rates), as do a lot of the boom price levels of 2015, again a function of exchange rates rather than demand. The current low price for 34 micron also changes, as in US dollar terms it is on par with the lows of the late 1990s when apparel fibre prices were generally depressed for an extended period (fine Merino wool was one notable exception at the time).

Note that the 34 micron and PSF price series follow similar trends and cycles, except for 2012-2015 when 34 microns buck the trend and trade at high levels. During that period most apparel fibre prices trended lower.

In Figure 3 the relationship between the 34 micron and PSF prices series is shown in US cents per kg (left hand axis) and as a simple price ratio (right hand axis). In terms of the price ratio, the low point of the past 25 years has been around 1.5-1.6. This is the ratio the 34 micron has fallen to, well down from the ratio of 3.5-4 reached in 2015-2016. In terms of the premium in US cents per kg terms, 50-70 cents has been the low reached in the late 1990s and again briefly in early 2009. The premium has shrunk to the low range again.

Energy prices have fallen this year, which will put some downward pressure on PSF prices. The PSF price is approaching the low levels reached in the depressed late 1990s, so the scope for further downward movement in the PSF is hopefully limited. Stabilisation in PSF prices looks to be required to help the 34 micron price steady.

What does this mean?

In proportional terms, farmers have been building stocks of broad crossbred wool on par with other micron categories this season. While that has not been a successful strategy, it may start to be worthwhile, given the low price level in US dollar terms, the low basis to polyester staple fibre price, and the (hopefully) limited downside for polyester staple fibre prices. Time will be the key to a recovery and that will require two components which are, firstly a pickup in economic terms and secondly a pickup in demand for broad crossbred wool in relation to other fibre prices.

Market has a positive bounce

While last week the MPG indicators across the board were showing negative, this week it was a “sea of green”. The market performed strongly on a small offering. From the open in Sydney & Melbourne, through to the final sales in Fremantle on Wednesday, it was obvious that buyer sentiment had improved.

The Eastern Market Indicator (EMI) lifted 15¢ or just over 1% this week to close at 1,170¢. The Australian dollar was also up almost a full cent to US$0.664, which elevated the EMI in USD terms by 21¢ to 777¢. The Western Market Indicator also posted a good gain, up by 25¢, fully regaining last weeks fall to close at 1,239¢.

Turnover this week was lower at $22.24 million as a result of the smaller offering. This moved the average bale value to $1,282 per bale, taking the season to date value to $1,878 million.

The pass-in rate was lower at 7.9%, 4.7% below last weeks level after growers withdrew 11.2% of the offered bales pre-sale. This resulted in 17,343 bales clearing, just over 1,000 fewer than last week.

Apparel fibre prices peaked in mid-2018 and then began a cyclical downturn. By late 2019 the average Merino micron price was down by 29-30% in both AUD and USD terms, a modest down cycle over 18 months. Then came the pandemic.

As Andrew Woods wrote on Mecardo, “Since January the price of Merino wool has fallen by 27% in US dollar terms and 23% in Australian dollar terms (monthly averages). The pandemic downturn is a separate and additional downturn to the already existing down cycle from 2018.”

The gains this week in the market were “across the board” with all MPG’s rising, however, notable rises were in the 18 to 21 MPG range with 20 to 30 cent gains. Fremantle followed the eastern states lead on Tuesday with 29 – 38 cent gains across its micron range, as well as a 37-cent lift in the Cardings.

A small offering of Crossbred wool came forward and met solid competition, with the strongest rises coming in the 26.0 to 28.0 MPG range. Cardings followed the combing wool lead, with 20, 16 & 37 rises in Sydney, Melbourne & Fremantle respectively.

The week ahead

Next week’s national offering is reduced again to 17,136 bales with only Sydney & Melbourne selling on Tuesday & Wednesday.

Better buyer sentiment and a reduced offering should provide support to the market.

Look at them go

A good winter outlook, moisture in the soil and the lowest yarding levels all season have seen cattle prices hold ground this week for most categories. Although over the longer term it has been a good run for prices all year with average monthly price gains since January between 18%-35% across the CV19 reported categories.

The Bureau of Meteorology released their end of May three-month climate outlook yesterday and it shows a 60-80% chance of a wetter than average winter is expected for much of Australia. Furthermore, the very much above average root zone soil moisture seen during May across large areas of eastern NSW is giving some confidence back to producers impacted by the dry conditions seen in 2019 (Figure 1).

East coast cattle yarding levels have eased to the lowest weekly point this season with only 15,558 head presented for the week ending 22nd May, which represents a 73% reduction from the five-year average trend for this time in the year (Figure 2).

A breakdown of the three key east coast states shows cattle yarding in Queensland is running 63% under the five-year trend, while Victoria is at 73% below average levels. However, the state really dragging down the total east coast yarding numbers is NSW with a mere 3,841 head presented last week, 83% below the seasonal trend for this time in the year.

The combination of a favourable climatic situation and tight supply lent support to some cattle categories this week. The MLA CV19 for National Vealer Steer indicator showing the best result with a weekly gain of 4.4% to close at 420¢/kg lwt. National Medium Steer was up 2.4% and Medium Cow managed a 1.2% lift.

The National Heavy Steer softened 1% on the week to close at 351¢/kg lwt and Yearling Steers were off by 4.5%. However, a look at price gains since the start of the season highlights how 2020 has turned to favour producers with gains from 18%-35% across all reported categories (Figure 3).

What does it mean/next week?’

As outlined in last week’s market comment the improving picture in US Live Cattle Futures markets (up nearly 4% this week and closing at 101.6US¢/lb overnight) along with the combination of tight local supply and a good rainfall forecast all bodes well for cattle producers as we head into winter. Expect domestic cattle prices to continue to be supported over the short term.

Sheep and lambs “stay home”

One could be forgiven for thinking that sheep and lambs were on paddock lockdown last week based on the saleyard throughput figures. Weekly east coast lamb yardings were already tight for this time in the season, but last week reached a low that pre-dates Mecardo’s records.

East coast lamb yardings were 79% below the five year average trend at just 39,798 head (Figure 1). We’ve been looking at the 2011 season as a reference point of how supply played out during a rebuild. However, last weeks throughput suggests that we might be reaching into new territory. The low in 2011 still saw 70,000 lambs pass through east coast yards and this was during a week of Easter disruption.

The story was much the same for sheep yardings. East coast sheep throughput fell 66% from the week prior and was 83% below the five year average trend (Figure 2). Zoning in on the various states and it was clear who drove the dramatic fall in yardings. New South Wales combined sheep and lamb yardings were 89% below the five year average, while Victoria wasn’t far behind at 69% below the average trend for this time of the season. Recent rain in these regions appears to be adding more optimism to the outlook and incentivizing producers to hold onto stock.

Sheep and lamb slaughter volumes saw little change from the week prior. Weekly east coast sheep slaughter remains at 53% below the same period last year (Figure 3). For the calendar year 2020 to April, sheep slaughter was down 25%, so the trend is increasing which is positive for the Australian flock.

All CV indicators responded to the lower supply with gains. The Mutton CV19 indicator lifted 5.3% on the week to $180/head and the Processor lamb indicator picked up an impressive 10% to $220/head. The Restocker lamb CV19 indicator also had a modest rise over the week of 3.8% to sit at $164/head on Thursday.

Next week:

The winter rainfall outlook released by the Bureau of Meteorology this week looks promising for much of the country. Tight supply is certainly here to stay. Whether last week’s slaughter and yardings figures hint at just how tight we can expect the next few months to be, is something we’ll be watching closely.