Tag: Analysis

End of quarter surge in live sheep exports

Key points:

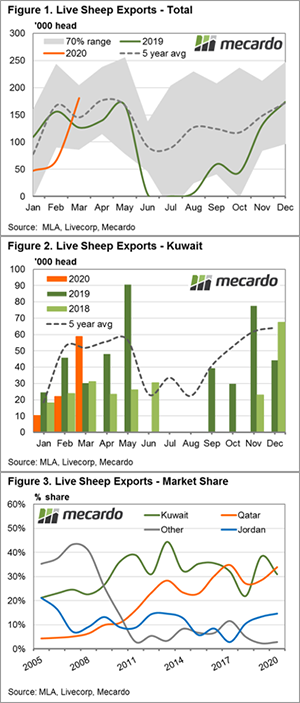
  • During January and February flows to Qatar and Kuwait were 31% and 54% below trend.
  • Australian live sheep export flows to Kuwait for March increased to 58,864 head to see it 14% above the five-year average trend.
  • Jordan and the UAE also saw increased flows in March, but Qatar remained below the five-year average seasonal trend.

It has been a while since we took a look at the status of live sheep exports so we thought a summary of the first quarter of 2020 was in order. After a slow start to trade volumes the quarter finished with a bang as Kuwait, Jordan and the UAE ramped up demand.

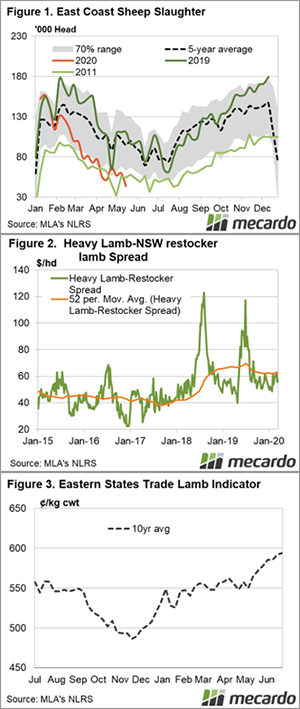
Figure 1 highlights the 2020 trend in Australian live sheep export volumes showing a January/February period trending 54% below the five-year seasonal average.  The three top export destinations for Aussie live sheep exports are Qatar, Kuwait and Jordan. During January and February flows to Qatar and Kuwait were 31% and 54% below trend, respectively. While no Australian sheep were shipped to Jordan.

However, March saw a big turnaround. While Qatar remained 15% below the five-year trend for March, there were significant lifts for Kuwait, Jordan and the UAE. Figure 2 displays the Kuwaiti trade in Australian live sheep with flows for March increasing to 58,864 head to see it sit 14% ahead of the five-year average pattern for the month. Jordan saw 43,004 head transported in March, the second highest monthly volume in four years. Meanwhile, the UAE recorded 22,000 head shipped during March to see it 117% above the five-year average monthly trend.

Although Kuwait saw a significant jump in live sheep imported from Australia in March it wasn’t enough to unseat Qatar from the top export destination for the 2020 season. Qatar has received a total of 100,000 head for the first quarter of the year, accounting for 34% of all live sheep exports from Australia. The tally so far this season to Kuwait sits at just over 91,000 head, or 31% of the total flows (Figure 3).

What does it mean?:

After the slow start to 2020, it is pleasing to see live sheep export volumes lift above the average trend in March given there will be another moratorium in the trade over the northern hemisphere summer this season.

COVID-19 lockdown regulations have given employees in retail, tourism and hospitality sectors a taste of what it is like to have your industry ground to a halt for 3-4 months of the year. However, this is a scenario that has impacted employees across the live sheep export supply chain since 2018. Hopefully we see a few more months of above average volumes during April and May to compensate for the live sheep export lockdown when it comes in June.

Positive note short-lived

The modest gains posted last week proved short-lived. The opening day in Melbourne provided some optimism but the market was unable to maintain the early price improvement to eventually end on a disappointing note.

The Eastern Market Indicator (EMI) fell by 24¢ this week to close at 1,155¢. The Australian dollar was up 0.73¢ to US$0.655, which cushioned the EMI in US$ terms, only falling by 7 cents to 756¢. The Western Market Indicator also fell, losing 23¢ to close at 1,214¢.

Turnover this week was down marginally at $23.76 million or $1,287 per bale, taking the season to date value to $1,856 million.

The pass-in rate was up marginally on last week to sit at 12.5%, after growers withdrew 8.6% of the offered bales pre-sale. This resulted in 18,455 bales clearing, just on 3,000 fewer than last week.

While the season to date weekly average sale clearance is at 27,595 bales (34,400 same period last year), the past 10 weeks has seen the clearance volume slip to an average of 22,600.

Supply is remaining constrained as growers wait and hold wool, with the expectation (hope?) that prices will recover soon. Many are supported by recent high price sales of clips over the past 2-3 years, as well as strong sheepmeat sales. However, this can only last for so long. We are now seeing growers increasingly concerned about the short and medium-term outlook for prices.

The falls were spread mainly across the Merino MPG’s with 8 to 64 cents falls reported, in fact, the EMI would have reported a larger fall if not for the fact that the Crossbred section remained unchanged.

Nationally just 2,342 bales of Crossbred designated wool was offered with 2,070 selling, with the Cardings section also clearing a modest 2,100 bales. This reduced offering pushed the Cardings indicators up in all centres, with an average 28¢ lift.

The week ahead

Next week’s national offering is a slightly smaller offering of 20,359 bales with Sydney & Melbourne selling on Tuesday, while Melbourne & Fremantle will offer on Wednesday.

To say we are in unchartered waters is an understatement, with a buying trade operating under severe limitations.

Waning supply keeping prices steady

It seems to be steady as she goes for lamb and mutton prices at the moment, with declining supplies translating into solid support for prices. This week mutton and restocker indicators received a lift with the flock rebuild intensifying.

It was way back in 2011 when a full week of sheep slaughter fell below 44,000 head, and that was only for two weeks at the end of July (Figure 1).  The 2011 trend in figure 1 does give an indication of what we can export in terms of sheep slaughter this year.

Sheep slaughter in late spring more than doubles that of autumn and winter, but we all know there are fewer sheep in the flock now. If, and it’s a big IF, we get a good spring, weekly sheep slaughter could stall around 80,000 head from October to November, but it remains to be seen if restockers will still be there to bolster prices.

This week the CV-19 Mutton Indicator gained $7 to $171/head, only $15 off the peaks of March, but 80% more sheep were being killed then.  COVID-19 has impacted demand for sheep as well as lambs.

Processor lambs were basically steady, at just above $200/head, while restocker lambs were up $10 to $158/head. A $40-50 spread between store and finished lambs is a pretty reasonable margin if grass is abundant. The spread was around $55-60 in March (Figure 2) when grain was still the main feed to finish lambs.

Next Week.

Tight supply is here for the next two months at least, but we might see NSW supply coming at more of a ‘normal’ time this year. Traditionally NSW suckers have started to hit the market in earnest in July, as growers try to catch winter premiums. There might be fewer lambs this year than historically, but we expect supply to ramp up quickly in mid-winter, then again in spring which could see a return to the average price trend shown in figure 3.

Offshore markets and supply provide support

Some good weekly price gains were noted for the MLA CV-19 cattle indicators this week as a continued situation of tight domestic supply and improved offshore markets underpin local sales.

East coast cattle throughput levels have been rising from the seasonal low registered in April. However, compared to the five-year average trend and the 2019 pattern, yarding levels remain well below the normal situation (Figure 1).

During May, weekly east coast cattle yardings averaged 30% below the five-year pattern. Compared to 2019 the picture is even tighter, running 38% under levels seen this time last year.

Similarly, east coast cattle slaughter volumes show a tight result too. Since early May, weekly slaughter figures have continued to ease, drifting outside the lower end of the normal seasonal range. Indeed, the average weekly slaughter volume for May now sits 13% below the five-year average trend (Figure 2).

Across in the USA, the supply picture remains tight as well, albeit for slightly different reasons. Steiner report that the US Fed Cattle slaughter levels remain nearly 30% below this time last season, as processing plants still grapple with the supply chain impacts of the COVID-19 pandemic.

The tight conditions in the US providing some good support for the imported 90CL frozen cow indicator to see a strong increase on the previous week, up 4% to reach 804.2 AU¢/kg CIF – the highest it has been this year (Figure 3).

In further good news for global cattle market sentiment, the US Live Cattle Futures price has rebounded 22% from the seasonal lows seen in late April to trade just a fraction under 100US¢/lb this week. For those subscribers that managed to see the COVID-19 webinar (still available on MLA’s Youtube Channel) I participated in last month, they would recall that getting back above the 100US¢/lb level is crucial for longer term support into the Australian market. So, it is good to see some price improvement returning.

Local CV-19 cattle indicators are all benefiting from the tight supply and improved offshore situation with the National Yearling Steer leading the charge, up 11% on the week to 393¢/kg lwt. Medium Steer, Feeder Steer and Finished Steers are all putting in a good show too, up 7% (331¢/kg), 5% (377¢/kg) and 3.5% (349¢/kg), respectively.

Next week?

Tight supply, improving offshore prices and a good rainfall outlook heading into winter all play into the hands of cattle producers currently. This should continue to provide support to domestic cattle prices into the short term.

Continue to keep an eye on the US Live Cattle Futures price as the ability for it to gain a strong foothold above 100US¢/lb into the medium to longer term is key to keeping local prices underpinned.

Who let the dogs out?

Key Points

  • There are 5.1 million dogs in Australia. One for every 4.9 people.
  • The theoretical dog food demand is 451kmt.
  • This comprises 135kmt meat, 142kmt cereals and 142kmt animal byproducts.

I was pawndering the value our canine friends had on the grain market.  So now is a good oppawtunity to do some ruff calculations on the impact of dogs, and put a new leash of life on supply and demand. Let’s get into the ultimutt review of man’s best friends dinner.

Animal Medicines Australia is the peak body representing the leading animal health companies in Australia. They produced a national survey of pets in Australia (2019) which highlighted that there were a whopping 5,104,700 dogs in the country. That represents 1 hound for every 4.9 humans.

There are many different breeds ranging in size from the diminutive chihuahua to the gargantuan great dane. Therefore, its necessary to work what is the average size of an Australian dog. This is where the Australian National Kennel Council helped. They produce an annual report on the number of animal registrations for their membership on a per breed basis, which represents 67,900 dogs.

The Australian National Kennel Council is the administrative body for pure breed canines in Australia. It would be logical that their registrations would be representative of the overall population.

However, this dataset does not include the weights of each breed. So to provide a robust analysis for our readers I spent my night finding the average weight for each of the  220 breeds of dog listed. I was then able to produce a weighted average of dogs to determine what is the average dog weight. Through an analysis of the 2010-2018 year average, the weight is 22kg per dog.

The feed requirements for dogs are based on a conversion of grams of food per kg of bodyweight. There are numerous levels quoted by different manufacturers, however I have opted to go with 11g per kg of bodyweight.

On our average dog size of 22kg, this amounts to 242g of food per day. Across our average population of dogs this is a whopping 1235mt of food fed to dogs every day or 451,000mt per year (figure 1).

A highly esteemed pet food expert informed me that pet food sold in Australia is roughly on a 70% dry to 30% wet (canned meat) basis. Additionally, the composition of dried products is approx. 45% cereals and 45% animal by products.

We can then refine this further into three main dog food elements:

  • 135,300mt of meat in the form of canned products
  • 142,000mt of meat byproducts
  • 142,000mt of cereals*

It must be noted that this is a theoretical feed demand for dogs in Australia. There are a few caveats to this analysis:

  • Not all dogs eat store bought food. This analysis does not consider the feeding of food scraps etc.
  • Although the local demand is theoretically >450kmt, there are volumes of pet food imported into Australia.

*Cereal incorporates wheat, sorghum, corn, rice, barley and byproducts (soymeal etc).

What does it mean/next week?:

Pet food is an oft-forgotten industry in Australia. However, this analysis shows that they are an important part of a diversified agricultural supply chain.

As we potentially move into a future with more home-based working, we could see an increase in the dog population as workers look for company at home.

If we want to decrease our reliance on agricultural exports, we should consider supporting great dane breeders. As a move to a 100% great dane population would increase demand to approx. 1.5mmt per year.

Some positive signs amid the turmoil

The last week has seen some good news on the export front, with increasing volume to China, and some bad news, with the suspension of some plants. The news from the US was more positive this week, and while it’s not responsible for local price rises, it helps.

Despite the suspension of four beef processors from exporting to China this week, prices managed to gain ground. The Heavy Steer was the star performer, with the CV-19 National Indicator gaining 15¢/kg lwt, to get back to 335¢/kg. This week’s move puts the Heavy Steer back within 10¢ of the all-time record set back in March.

Cows and Feeders also gained ground, although they weren’t quite as strong (Figure 1). Tightening supply is no doubt helping prices higher, both at saleyard and over the hooks level, but improving export prices are playing a part.

Figure 2 shows the 90CL Indicator has lifted in both US and AUD terms (Figure 2).  Steiner report that many US users are short stock, as they took a wait and see approach in April, and now need to stock up.  Additionally, US Cow slaughter has been down, as with all cattle, and lean beef in general is in short supply.

The backlog of overfed cattle in the US might see continued lower Cow slaughter and provide some support for our exports over the medium term.

Despite the cattle backlog, US Live Cattle Futures bounced higher this week, moving back its highest level since mid-March.  More positive signs of some resilience of beef and cattle demand.

Next Week.

It is hard to see cattle supply improving as we move toward winter.  In fact, it should get tighter.  Stronger export prices will be required to see prices keep rising in a similar trend to the last couple of weeks.


Market takes a breather

After four weeks of losses and continuing uncertainty as to the full impact of the COVID-19 effect on the wool supply chain, this week the market settled posting modest gains. The market has a range of differing circumstances; Merino wool with good measurements is sought after, while lower style types and crossbred wools are not receiving anywhere near the same interest.

The Eastern Market Indicator (EMI) lifted by 9¢ for this week to close at 1,179¢, while the Australian dollar was up 0.44¢ to US$0.676, which contributed to the EMI in US$ terms also rising by 11 cents to 764¢. The Western Market Indicator didn’t fare as well, falling 9¢ to close at 1,237¢.

Turnover this week was up slightly at $27.79 million or $1,303 per bale, taking the year to date value to $1,831 million.

The response to the stronger buyer interest in the market was the halving of the pass-in rate, this week down to 8.8%, resulting in 21,315 bales clearing, 654 more than last week. Contributing again was a large withdrawal prior to sale of 12% of the original offering. AWEX noted that the national offering is 10.9% lower when compared year-on-year.

The rises were across the board for Merino types, with stand-out rises of 40 cents plus for 16.5 MPG in Sydney, as well as the 18 MPG in Melbourne & Fremantle along with the 19 MPG in Melbourne. Crossbred types were generally 20 cents off the pace, while Cardings held steady in all centres.

The week ahead

Next week’s national offering is just 21,690 bales with Sydney & Fremantle only selling on one day while Melbourne will offer on Tuesday & Wednesday.

Unfortunately, the early strength this week did not continue to the close of selling, with Melbourne and Fremantle reporting an easier trend on the final day.

Supply dearth provides support

Key supply metrics remain below their normal seasonal range for lamb and sheep markets. The tight supply has provided a lift in prices for all Covid19 reported indicators from Meat and Livestock Australia this week.

Weekly east coast lamb slaughter volumes have gained slightly on the previous week but remain well below normal levels for this time in the year – Figure 1. Compared to the five-year average pattern lamb slaughter is 26% below the seasonal trend and 28% under the volumes processed this time last year.

It is a similar picture of tight supply for sheep slaughter volumes too – Figure 2. Weekly east coast sheep slaughter is sitting 41% under the five-year average and 46% below levels recorded for the same week in 2019.

Sale yard throughput is following the same story. East coast lamb yarding levels are 27% under the five-year average trend and 34% softer than this time last season. Sheep yarding levels are even tighter with figures reported 45% under the seasonal average and 54% below the 2019 trend – Figure 3.

The dearth of supply is providing a boost for prices this week, particularly for the Covid19 Mutton Indicator which posted an 8% gain to close at $167/head. The Processor Lamb Indicator put in a respectable 3% lift to $203/head, while Restocker Lambs managed a 1% rise to $154/head. While the price rise is a welcome positive for producers the shortage of supply came a little late for this analyst as I could have used it last week for a May the Fourth Star Wars pun – maybe next year.

What does it mean/next week?:

Next week shows enough rainfall in sheep rearing regions across the east coast to keep prices supported, particularly in Victoria with falls between 10-15mm anticipated across much of the state.

Most of NSW and the southern regions of SA are only likely to receive between 1-5mm but that should be enough to keep the marking holding firm given the tight supply situation is likely to continue throughout autumn/winter.

A sharper rebuild at cost of supply

Key Points

  • MLA’s Cattle Industry Projections update shows even tighter supply in the coming years.
  • The herd rebuild is expected to be a bit quicker with better seasonal conditions.
  • Tight supply should support prices, but demand is highly uncertain.

Meat & Livestock Australia (MLA) have updated their cattle industry projections for April, with the key factor being going from hoping for a break in the drought, to actually receiving some rain. The updated outlook suggests a faster herd rebuild, but it’s going to cost in terms of cattle supply for the next.

The cattle herd is still expected to set an unwanted record on the 30th of June, but now the forecast is set to be slightly higher than previously thought. The updated Cattle Industry projections peg the herd mid-year at 24.8 million head.

Figure 1 shows the herd projection for this year is 100,000 head higher than the January projections. While this is minuscule in the scheme of things, it is a reflection of tighter slaughter in the first quarter of 2020.

Out to 2023, the improved seasonal conditions have seen herd levels revised from 1.8 to 2.5% higher. Despite the higher herd projections, we are still set for a 27 year low for the herd this year. It is also expected to take until 2022 to get back to herd levels of last year, and even in 2023 it won’t quite be back to 27 million head.

To achieve a faster rebuild of the herd, there have to be fewer cattle going to slaughter.  MLA’s have adjusted cattle slaughter down in all projection years except 2023. The biggest declines are expected this year and next, with projected slaughter down 4.2% (Figure 2).  This year cattle slaughter is expected to be 6.9 million head, a 24 year low. A new low water mark is forecast for 2023, with 6.8 million head the lowest since 1989.

Cattle slaughter is expected to remain relatively tight in 2022, still under 7.5 million head, and only returning to the ‘normal’ levels of most of the 2000-2010 period in 2023. Figure 2 clearly shows the boom and bust cycles for the last 10 years, with droughts and strong slaughter followed by wetter periods and very tight supply.

What does this mean?

It should be relatively comforting for cattle producers that while we are entering a period of uncertainty in regards to demand, tight supply will at least offer some support for cattle prices.  At what level is something we’ll look at next week.

There is even some time for demand to recover, and help values rise before supply will be back near what could be considered ‘average’ levels.


The trend (down) continues

It is difficult reporting weekly on the continuing demise of the wool market, with price decline now seemingly a weekly occurrence. AWEX noted that at least the market has been able to continue “with all industry stakeholders working together to ensure that wool auctions continue”.

While this is certainly a good effort, allowing producers to get wool to market and exporters to buy, it is small consolation. In the ten selling weeks since the beginning of March, the EMI has fallen 390¢.

The Eastern Market Indicator (EMI) fell by 55¢ for this week to close at 1,170¢, its lowest close since 2015. The Australian dollar was down for the week by 1.02¢ to US$0.643, which caused the EMI in US$ terms to come off 48 cents to 753¢. This puts the US$ EMI at its lowest point in almost 10 years. The Western Market Indicator was broadly in line with the east, falling 64¢ to close at 1,246¢.

Turnover this week was $24.83 million at $1,201 per bale, taking the year to date value to $1,804 million. For contrast, in the same week last year the 28,500 bales sold returned $58.3 million at an average of $2,039 per bale. The year on year comparison of sales value is down a massive $1.1 billion impacting not only on growers incomes but on all sectors of the industry.

Despite the weaker market, the pass-in rate was lower this week at 18.5%, resulting in 20,661 bales clearing, 3,643 more than last week. Again a large withdrawal was evident with 11.8% of the original offering withdrawn prior to sale. Season to date there has been on average 27,990 bales sold per selling week. This is well down on the 32,800 average for last season.

Again the falls were across the board, with Merino types losing 30 – 87¢ and Cardings down on average 27 to 44¢. The note from the X bred section was again that poorly prepared clips we difficult to find buyer support.

The week ahead

Next week’s national offering increases slightly to 25,660 bales. AWEX report that due to limited quantities Sydney and Fremantle both will have one-day sales, Sydney selling Tuesday and Fremantle selling Wednesday, this is a move designed to avoid Melbourne selling in isolation.