 Lamb prices have defied the odds to remain relatively steady for the fifth week straight. It’s highly unusual for prices to trade in such a narrow range for so long, and there is no doubt they will break out at some stage. Mutton prices haven’t had the same luxury, continuing to slide this week in spite of weather forecasts.
It’s been a strange week for mutton markets. We must point out that Monday was a public holiday in NSW, which might have thrown indicators out a bit, but shouldn’t have accounted for the Mutton Indicator falling off a cliff.
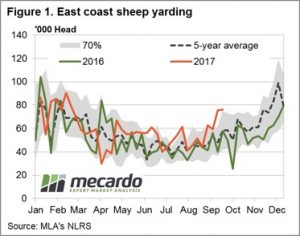
Figure 1 shows NSW Mutton has gone from similar to last year’s levels, to just below the five year average, at 264¢/kg cwt. NSW mutton is now half the price it was in early June.
The decline in mutton prices was not confined to NSW, in SA we saw a 93¢ decline to 265¢/kg cwt. In Victoria mutton values were steady, gaining 3¢ to 373¢/kg cwt. So either NSW and SA prices are way out of whack, or Victoria’s are, and normal trade flows will see prices converge in some way or another.
The Eastern States Trade Lamb Indicator (ESTLI) has defied downward pressure from mutton, and remained steady at 602¢/kg cwt. The ESTLI has traded between 597¢ and 607¢ for five weeks and between 574 and 633¢ since the start of July.
It was the second week in October when the ESTLI fell off the cliff last year, and the weakening mutton values don’t paint a great picture for lamb over the coming weeks.
The week ahead
Figure 3 might see a bounce in mutton prices after this week’s fall. A reasonably large proportion of the NSW sheep population will get pretty wet over the coming 8 days, while things will keep ticking along in Victoria. It’s hard to see lamb values maintaining these values indefinitely, so if lambs are up to trade weight, the time to sell at 600¢ is running out.
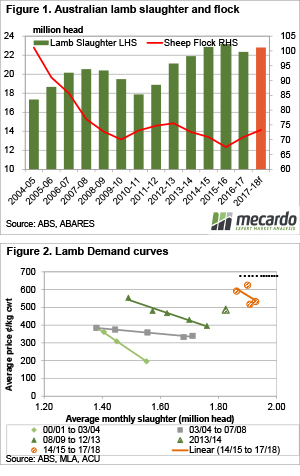 The Australian Bureau of Agricultural and Resource Economics (ABARES) have put out their quarterly Agricultural Commodities Report, and amongst the numbers there were some interesting sheep and lamb forecasts. This week we take a look at whether lamb prices can achieve another year on year increase, as predicted by ABARES.
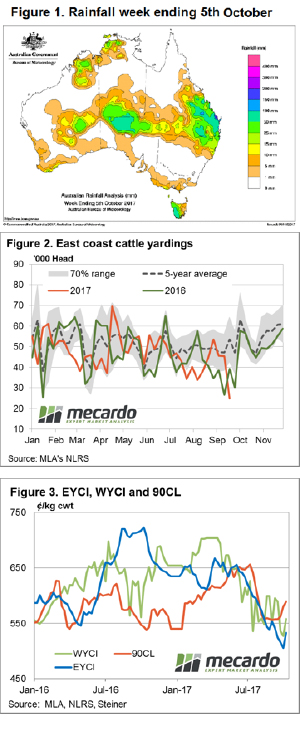 The Mecardo team have been suggesting a price bounce was imminent for the last few weeks given the rainfall forecast, recovery in export prices and falling supply at the saleyards. But as the old trading adage goes, “even a broken clock gets it right twice a day” so we won’t puff out our chests too much on this one.
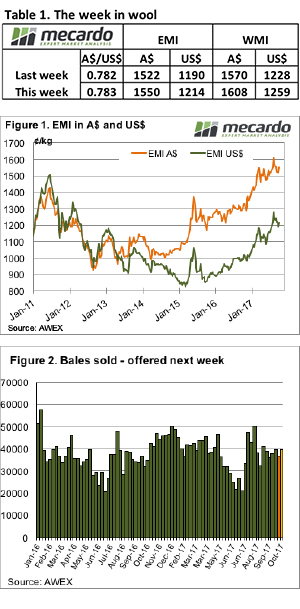 The “steady as she goes” reports on the wool market activity over recent weeks were thrown out the door at this week’s 2 day wool sale, with the market lifting significantly led by the Merino and including Cardings sections.
 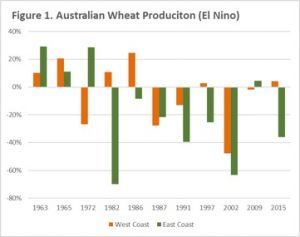 The US Climate Prediction Centre, is currently on La Niña watch with an increased likelihood of the little sister to El Niño occurring before the end of the year, and into 2018. This can have very positive results for Australian grain growers, in this analysis we look at how we may benefit.
 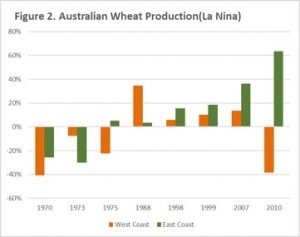 In figure 1, we see the year-on-year impact of El Niño split into east coast and west coast. In the period 1960-2015, 7 of 11 El Niño years have recorded a reduction in wheat production, with 6 of these years recording a > 20% reduction. In Western Australia the impact of El Niño has been less negative, with 6 out 11 event years recording an increase. However, only two of these years record > 20% increase. In addition, during the years of production decline, 3 of these years recorded large production falls of > 20%.
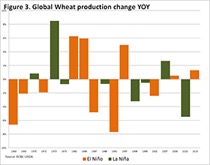 At present, the market is not yet overly concerned with La Niña. However, it does have the potential to impact greatly on the US crop through drier weather and eastern Australia through wetter than average conditions. If La Niña starts to impact on the US crop production, then we are likely to see risk premiums emerge in US futures markets, which will flow on to our own prices.
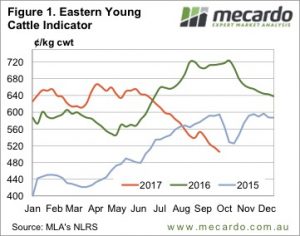 It was only in mid-July that the Eastern Young Cattle Indicator (EYCI) broke through 600¢. The downward spiral now has the EYCI looking down the barrel of a number with a four in the front. There has finally been some positive news on the climatic front, however, which could and should provide some support, if it eventuates.
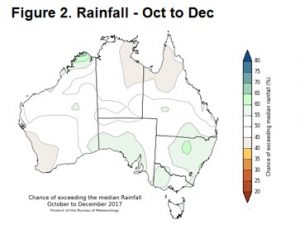 It was feeder steers which managed to defy the trend this week, gaining 8 and 7¢ in NSW and Victoria respectively, to move back to 286 and 283¢/kg lwt. It was trade steers that drove the EYCI lower.
 The country sits on tender hooks, as we come to the end of September. The forecasts for the crop from ABARES and USDA seem to be wholly optimistic, and will see severe downward revisions after a terrible month for much of the growing regions.
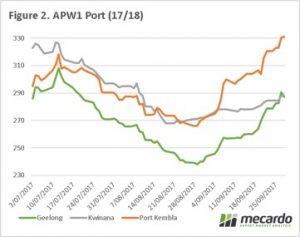 The A$, although still high compared to the last year has dropped back below 79¢, helping the local price. In the past month we have seen iron ore futures (figure 3), start to slip which put pressure on the A$. As China drops demand after an intensive import program over the past few months will we see a further slide back down to 75¢
 Fairly erratic moves to the state mutton prices this week but they all evened each other out to see the National Mutton Indicator just 3¢ softer to 370¢/kg cwt. Marginal prices changes the order of the week it seems with the Eastern States Trade Lamb Indicator continuing to dance around the $6 area, posting a 5¢ gain to close at 603¢/kg cwt.
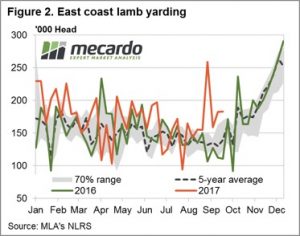 East coast lamb throughput showing a similar story to sheep throughput with yardings remaining above the 70% range and quite elevated for this time of the year – figure 2. The high sheep throughput being held up by above average numbers at saleyards mainly centred in NSW. The lamb throughput supported by NSW and Victorian flows, the only two states with yarding figures trekking above average for this time of the season.
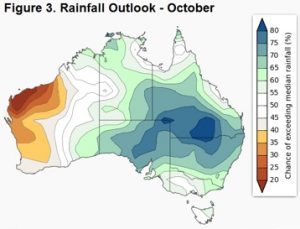 The recent Victorian lamb yarding pattern suggest the beginning of the Spring flush is underway which is likely to start to see some price pressures for the ESTLI in the coming weeks. Although, the updated Bureau of Meteorology rainfall outlook for October (figure 3) signals a move to a much wetter NSW which will provide some welcome relief to producers there and price support on dips.
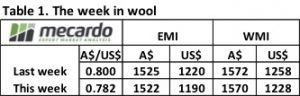 An overall satisfactory wool sale result this week, however we need to acknowledge that the weaker A$ played a part. Last week the A$ touched out at US$0.80, whereas this week it closed at US$0.782. Causes for currency moves are varied and debatable, and we can’t be sure if the weakness in the A$ is anticipating a Tigers/Crows win or loss in the AFL; or perhaps it is due to the struggle NSW NRL fans are having coming to terms with a Cowboys/Storm final?
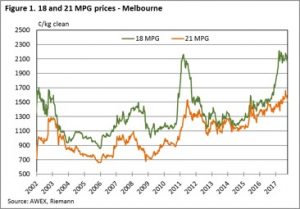 A key point of interest in the wool market is the fine wool price, including the fine wool price relative to medium wool.
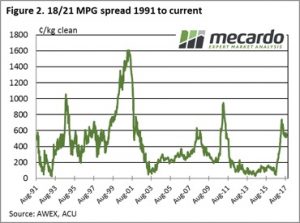 Of course, this leads to comparisons of relative price levels. Figure 2 shows the basis or spread between the 18 & 21 MPG’s for the Southern selling region. Currently the 18 over 21 MPG premium is sitting nicely at 554, having briefly touched the high level of over 700 cents in March this year.
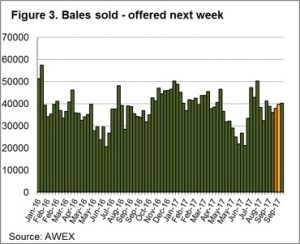 The market looks remarkably stable at present, and providing we don’t see a sudden surge in the A$ this should translate into another good week to be selling (that is providing the footy community can cope with an all Victorian result!!!)
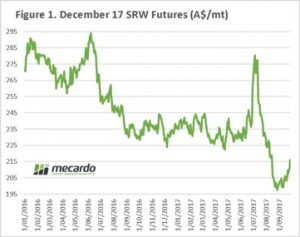
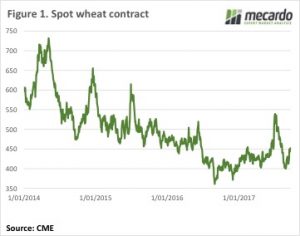 Local and international wheat markets continued to edge higher this week. Local markets are still trying to get a grip on where the crop will end up, as it shrinks by the day. The international market remains awash with wheat, but a rising rouble gave unlikely support.
 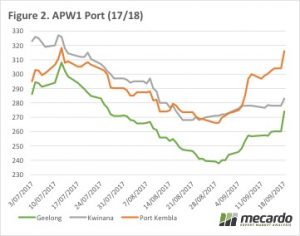 Locally the dry spell in NSW continues to run down the potential crop, with prices responding accordingly. ASX East Coast wheat, which we must remember is now deliverable in Victoria, was quoted at $283/t yesterday, up around $10 for the week. Interestingly Geelong continued to lag a bit, although it was up around $14 for the week to $274/t (figure 2).
 Canola values are also at a premium in the northern cropping zones, but not as much as you would think. Newcastle Canola is priced around $550, with Geelong just $15 behind, at $535/t. It’s hard to see much canola being produced in NSW, but there might have been enough carry over from last year to satisfy local crushers.