Tag: article

Easter slows sheep slaughter but it’s still strong.

Last week was a day short of a full one, thanks to Good Friday. The short week saw a predictable drop in both sheep and lamb slaughter, but supplies remained much stronger than Easter last year.  Prices are starting to fall behind last year levels, so this week we thought it timely to take a look at what price and supply tells us about demand.

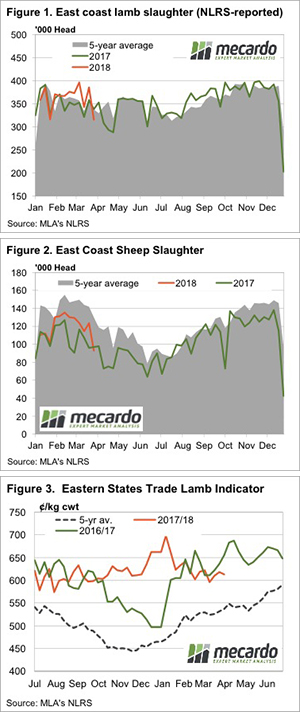
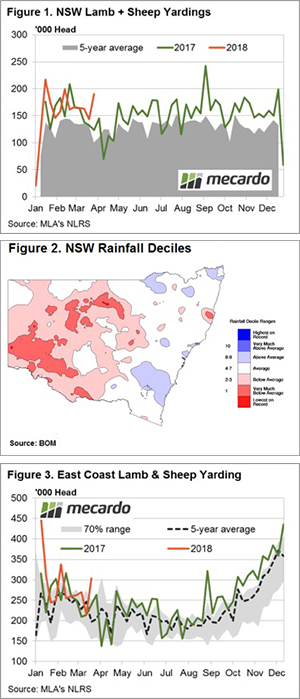
Figure 1 shows Good Friday dragged weekly east coast slaughter back to its lowest level for the year to date.  Easter 2017 is clearly shown, with the added week of Anzac day seeing three weeks of low slaughter. Last week lamb slaughter was 2.5% higher than Good Friday week last year.

Sheep slaughter was much stronger. This year Good Friday week sheep slaughter was an extraordinary 26% stronger than last year. Combined sheep and lamb slaughter was 7% higher than last year.

The last week took total year to date sheep and lamb slaughter to 4.6% higher than last year.  The extra 250,000 sheep and lambs slaughtered for the year so far equates to around 3 days of sheep supplies. It’s interesting that this is the case, even despite 50,000 head of weekly kill space being taken out by the January fire at Thomas Foods.  NSW and Victorian processors have more than picked up the slack, seemingly driven by good demand and margins.

Figure 3 shows it was this time last year that the Eastern States Trade Lamb Indicator (ESTLI) really took off. Not surprisingly, the rally towards 700¢ coincided with a solid autumn break across the Eastern States, which no doubt tightened supply.

We’ve identified that demand for lamb and sheep has been stronger than last year for much of the 2017/18 season to date. This is evidenced by prices being similar or stronger, despite supply being stronger.

Last year’s strong prices from this point may have been driven by stronger demand, as lamb supply remained relatively steady. Restockers would have contributed to increased demand, but this time last year might have been the start of the current strong demand period.

What does it mean/next week?:

While strong lamb and sheep supply does mean weaker prices now, at least weaker than the peaks and this time last year, it does bode well for those looking to sell lambs and sheep over the coming months.

May is usually one of the stronger slaughter months for the year, but with strong numbers coming through to date, it might be the month for the winter price rally.

Key Points

  • Lamb and sheep slaughter was lower for Easter, but still well above last year.
  • Prices are falling behind last year’s levels, but demand remains similar.
  • Continued strong supplies of lamb and sheep should see tighter supply, and stronger prices over the coming months.

1, 2, 3, 4, I declare trade war

Trump. The president who sticks to his promises. Overnight the trade scuffle, turned into a trade war with China increasing the number of imports which would attract tariffs after increased rhetoric from the US president. Although not wholly unexpected, this trade war can have huge ramifications for global trade.

The Chinese government were never going to stand back, whilst Trump continued to sabre rattle and threaten increased tariffs. The new list is extensive and could impact up to $50bn of trade. The products include soybeans, wheat, corn, sorghum & whisky*.

Through reading the list of products likely to be hit by tariffs (here), it could be construed as a savvy political act, as many of the products/commodities will impact the pockets of voters in Trump strongholds.

The impact of the tariff has been quite stark, overnight the Chicago soybean futures contract traded in a 58¢/bu range (figure 1). The introduction of tariffs specifically on US exports has instantly made US soybeans uncompetitive into China and will make it easier for alternate origins to compete i.e. Argentina and Brazil.

The tariffs however, leave a number of questions around the capability of China to continue with trade restrictions. In figure 2, the imports/exports and production of soybeans is displayed. Over the past ten years China has on average imported 62% of the worlds export soybeans, this places a huge strain on China’s ability to find alternate origins, especially in light of the US providing 40% of the worlds exports.

In order to satisfy the demand into China, without paying tariffs, close to 100% of the global trade in soybeans (ex USA) will have to go into China. This will have flow on impacts into other soybean destinations, which will likely change origin to USA.

Interestingly, China has not declared when tariffs will be in place, and there is some speculation around the fact that Chinese purchases tend to be reduced at this point of the year.

*Only real whisky comes from Scotland anyway.

What does it mean/next week?:

It is not wholly surprising that this trade war has commenced. The Trump campaign was largely based on curtailing the advance of China, and regardless of opinions on him, he tends to do as he promises. The real test will be whether there is a further escalation in tariffs.

The good fortune we have seen with barley and sorghum imports into China is likely to continue, as US exports will be uncompetitive.

Key Points

  • China over the past ten years imported on average 62% of the worlds global trade in soybeans
  • The US contributes 40% of the worlds global trade in soybeans on average.

Buy the rumour, sell the pulse.

The agricultural trade is always full of interesting moments. As a staple food product, political decisions around the world can have a big impact. In this week’s market comment, we take a look at the conditions in the US, and rumours emanating out of India with potentially severe impacts on Australian pulse prices.

The weekly market comments are being published a day early, due to the Easter break.

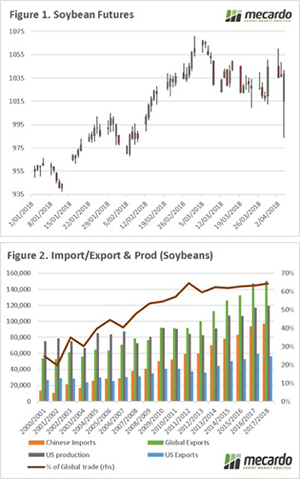
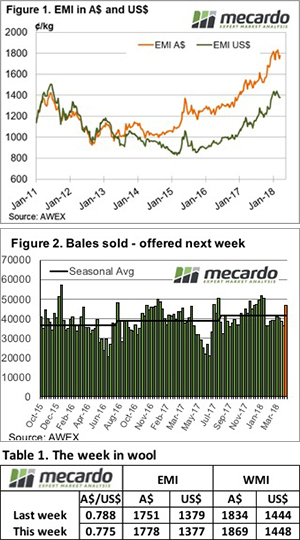
The wheat market has continued to decline, with three sessions in a row the market has accumulated a fall of 3% since the close on Friday last week (figure 1), placing the futures market at 2-month lows. The trade continues to digest the improving weather conditions in the US, and lower than expected exports (leading to higher end stocks).

Conditions are improving in the US, albeit only marginally. In figure 2, we can see that the crop expected to be fair – excellent is at 51% (up 6%). Although it needs to be noted these conditions are considerably worse than any time for the past decade.

In the past weeks, we have been hearing rumours of an additional increase in tariffs for pulses imported into India. The India government have legislated these tariffs to protect the prices offered to farmers. The cynic in me considers that this is interesting timing with the coming election.

It however gets worse, there has even been speculation in recent days that a complete ban on imports would be enacted. In the past two days, chickpea prices in India have performed well (figure 3), is this a case of traders buying the rumour?

What does it mean/next week?:

Overnight the USDA will release the US planting intentions & the quarterly stocks. This report has moved the market in the past, but will it be enough in a market with such burdensome stocks?

At a local level, conditions across much of Australia currently seem poor for the approaching seeding period. There is still ‘some water to go under the bridge’, and hopefully we get some much-needed downpours prior to the commencement of planting.

Surge in NSW throughput but prices hold.

Anecdotal reports of the lack of rain boosting throughput levels along the East coast, particularly in NSW, are being supported by the yarding numbers this week with a spike in both sheep and lamb throughput noted. Despite the higher offering, prices have remained fairly stable with the Eastern States Trade Lamb Indicator (ESTLI) only 3¢ lower at 612¢/kg cwt and National Mutton managing to gain 2.6% to close at 437¢.

Figure 1 highlights the combined sheep and lamb throughput pattern for NSW with the jump in yarding levels on the week quite evident, coming in at 190,195 head – 54% higher than this time last season and 89% above the seasonal five-year average pattern. The high NSW yarding of lamb and sheep is a result of the lack of rain to much of the Western regions of the state.

February rainfall deciles from the Bureau of Meteorology show much of the state suffering from below average to very much below average rainfall conditions. Figure 2 and the animation of daily rainfall levels during March, emphasize the dry start to Autumn.

Elevated NSW throughput numbers for lamb and sheep have underpinned higher East coast figures on the week, with a 41% jump to over 303,000 head – figure 3. Indeed, the combined East coast lamb and sheep yarding is now sitting 54% higher than the average seasonal level for this time of the year according to the data over last five years.

Despite the additional supply at the sale yard, lamb prices across the Eastern states are holding up reasonably well. Restocker lambs are back above 600¢ in Victoria (625¢), NSW (637¢) and South Australia (600¢) with Trade and Heavy Lambs across these three states mostly unchanged on the week. Victorian mutton rebounded over 6% to see it back above 450¢, while SA mutton took a bit of a dive, down 9% to 365¢. In the West Trade Lambs went sideways, closing above 630¢ while WA Mutton bounced over 9% to get back above 410¢.

What does it mean/next week?:

There isn’t much rain on the horizon for most of the nation, although the northern tropics will get some into next week, but it’s unlikely to shake out further sheep and lamb supply as the Easter break will cause some disruption to sale yard flows.

It’s probably fair to say producers with concerns about the recent lack of rain and access to pasture have brought forward their supply, adding to this weeks elevated throughput. The prospect of tighter supply in the weeks following the return post Easter, should lend some support to prices, especially if we start to get some Autumn rain.


Wool market bouncing along.

The pattern of the wool market rising one week and falling the next continued. This week saw the market continue the weak finish to last week’s sales and post a week of price corrections.

The Eastern Market Indicator (EMI) gave up 6 cents to 1772 cents, while in US$ terms the EMI lost 3 cents to 1364 (Figure 1).

This US$ level for the EMI is the lowest the market has traded for this year, an indication that unlimited demand and price rallies are no more the case now than they were ever. It now appears that the market may have found a top (in technical or charting terms) in January, and with reports of tightening Chinese credit terms we could be lining up for weaker demand and lower prices in 2018.

The AU$ played its part and lost favour during the week, easing again by 0.5 cents to US$0.77, which softened the fall in the general market indicators. The West fared better, due to the later selling last week the market had already pulled back, in fact the Western Market Indicator (WMI) gained 2-cents to 1869 cents.

There was an interesting spectrum to the market this week; the crossbred section posted another week of increases, and due to the greater volume of crossbred wool in the Melbourne catalogue the Southern Indicator held steady.

Crossbred types for the second week in a row rallied between 10 and 20 cents. Merino skirtings performed stronger than the fleece types although generally slightly lower for the week.

Merino Cardings had another good week, posting around a 24-cent improvement across the three cardings indicators.

The past three weeks has seen the Pass-in rate fluctuate with 9%, 4.0% and this week 7.8% passed by growers as they react to the variable market week-on-week. Generally this rate has fluctuated in line with market movements week on week.

There was an increased clearance this week of 41,334 bales, almost 5,000 bales more than last week.

The week ahead

Next week is the Easter break, with sales resuming the week beginning 9th April.

On resumption, almost 49,000 bales are offered, which will test the resilience of the market. AWEX report that volumes are predicted to decline after this sale.

Cattle supply is up and so is demand it seems.

Just when you thought the rain in Queensland was starting to tighten supply, we get a week like this. Cattle slaughter was higher everywhere, and this pushed east coast slaughter to 20 month highs. The stronger supply, and limited demand for the coming week, saw prices ease.

Figure 1 shows the massive jump in east coast cattle slaughter last week with 9% more c
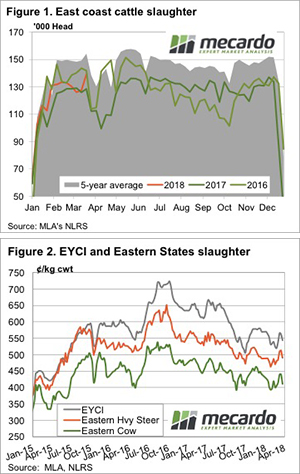
attle processed than the previousweek, and 4.3% more than the 2018 high. In fact, we haven’t seen this many cattle slaughtered in a week since June 2016.

While Queensland did have its highest slaughter week for this year, it has been higher in the last 12 months. It’s the drier states of Victoria and NSW which are driving the increase, having slaughtered 21% and 8.5% more than last year to date respectively.

Figure 2 shows the stalling rally in the Eastern Young Cattle Indicator (EYCI) and heavy steers and cows. The stronger supply has seen prices ease, but demand must be a bit stronger, as prices haven’t fallen back below February levels – yet.

In WA, young cattle prices rallied, moving 17¢ higher to 578¢/kg cwt, a one month high. Over the hooks prices remained steady in the West, as they tend to do. Currently sitting at 500-510¢ for yearlings, and 540¢ for MSA yearlings.

In the export market, the 90CL indicator remains remarkably steady. This week the US price lost a cent, but the lower Aussie dollar saw the 90CL in our terms creep 4¢ higher to 603¢/kg cwt.

The week ahead

Autumn is usually the time for peak cattle slaughter, but we weren’t expecting it this year. An autumn break in Victoria and NSW should tighten supply post Easter, but there isn’t anything on the forecast.

The good news is demand seems to be partly driving the increased slaughter, with more space being made available. If supply does tighten, stronger demand bodes well for the winter price rise that we normally see, but was absent in 2017.

US cattle cycle outlook – revised

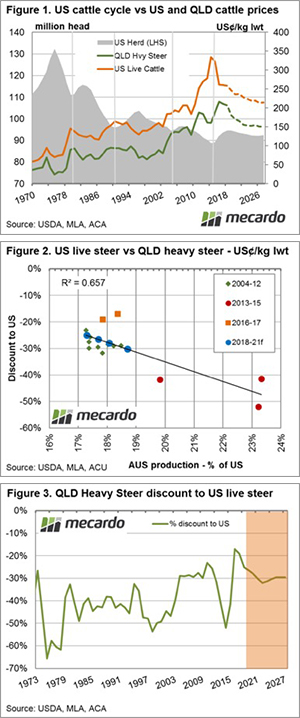
The United States Department of Agriculture (USDA) have released their updated long-term projections for key agricultural markets and they contained some adjustment to forecast herd growth, production and cattle price forecasts. This article takes a look at what these revisions mean for cattle prices and spread relationships between the US and Australia in the coming years.  

The US are a few years ahead of Australia in their herd rebuild phase and the updated USDA forecasts show that the US herd is anticipated to peak during the 2018/19 season at 94.5 million head. Revisions to the herd size beyond 2020 now show the USDA expecting a gradual liquidation as we head toward the 2025/26 season.

Figure 1 outlines the US cattle cycles back to the 1970s along with the impact changes to the herd size has had on US cattle prices. Often the peak in the herd size during the cycle corresponds with a trough in the price cycle. The chart also highlights the broad similarity in price behaviour over the longer term between the US Live Cattle price and the Queensland Heavy Steer price. Notably in the recent USDA release cattle price forecasts have been revised down by 7.5% over the 2020 to 2026 period.

Analysis of the relationship between the Australian to US production ratio and the annual average price spread between US live cattle prices and the Queensland Heavy Steer shows a moderately strong interdependence – figure 2.

During times of drought in Australia, like in the 2013-2015 period, the production ratio increased as our turnoff levels increased and placed pressure on the spread discount between US and local cattle prices to see it widen beyond 50%. Conversely, as our climate turned more favourable into 2016-17, and the herd rebuild began, the production ratio contracted and the discount narrowed to just under 20%.

Figure 3 highlights the historic pattern for the spread discount between US live cattle and the Queensland Heavy Steer. Using the production ratio estimates based off the USDA and MLA production forecasts we can see that the spread is anticipated to widen as the production ratio increases as we head toward the end of the decade.

What does it mean?  

The discount annual average spread between US live cattle and the Queensland Heavy Steer is set to move toward 30% by 2020. However, the production ratio estimates assume average seasonal conditions. As highlighted by the dip in the spread during the 2013-15 drought inspired turnoff a return to harsh seasonal conditions will see the spread come under further pressure.

After the Easter break we will run the adjusted USDA numbers through the Mecardo EYCI forecast model to see what the changes to long term forecasts for price and supply mean for local young cattle prices out to 2020 – stay tuned.

Key points:

  • The USDA have revised their projections for the US herd size, pointing to a peak in the heard of 94.5 million head during the 2018/19 season.
  • US Live cattle price forecasts beyond 2020 have been revised down by 7.5%
  • Production ratios between the US and Australia signal a widening of the discount spread between US and local prices toward 30% as we head to the end of the decade.

May you live in tranquil times.

There is an old Chinese curse, “May you live in interesting times”, used ironically to suggest that uninteresting times are more life enhancing than interesting ones. It seems our friend Donald, would like to consign us to a lifetime of interesting times.

After experiencing strong momentum in March, it seems that gravity has exerted its force on the wheat futures market, with a return to pre-rally levels (figure 1). In recent days much needed rainfall has fallen in US growing regions. It was not unreasonable to expect this fall in the market, especially as the US falls in importance on the international wheat market.

In the Black Sea nations, conditions continue to be promising for the coming season, with winter kill below average. Although the crop will be unlikely to match last year, it will still dominate the export market. Interestingly a Russian government official commented that fertilizer and seed purchases had increased 30% this season.

In figure 2, the basis levels around Australia as a percentage of the overall price has been displayed. During this harvest, basis increased dramatically, becoming a third of the pricing complex in some states. Although since weakened, basis levels remain strong, and protect us from falls in the futures market.

In recent weeks, Trump has been rattling the tariff saber with China. During the Trump election campaign, he ran on a platform of reforms to trade. In his defence, Trump has certainly gone all in, however only time will tell whether this will be to the betterment or detriment to the voters.

In figure 3,4, & 5 (animated), we can see the futures prices of a number of commodities (pork, soya, soya meal), which all have strong links with China. As we can see these markets have experienced strong falls in recent weeks, as discussions become more heated.

On a regular basis China turns around vessels of soya and corn from the US; perhaps we will see an upsurge of cargo rejections in retaliation.

What is assured, is that we are unlikely to be living in tranquil times for the foreseeable future, and black swans are likely to be a regular occurrence.

What does it mean/next week?:

The ‘tariff war’ is going to place Australia in a difficult diplomatic position, between an important customer and a traditional ally.

However, if handled well by our government could provide a favourable result for Australian industries.

Prices succumb to higher throughput.

A jump in throughput across the Eastern seaboard, particularly in NSW and Queensland, puts the heat on cattle prices this week with the Eastern Young Cattle Indicator (EYCI) shedding 3% to finish trading yesterday at 544¢/kg cwt.  

Losses were noted across the board for most cattle specifications, with only East coast trade steers managing to hold their 
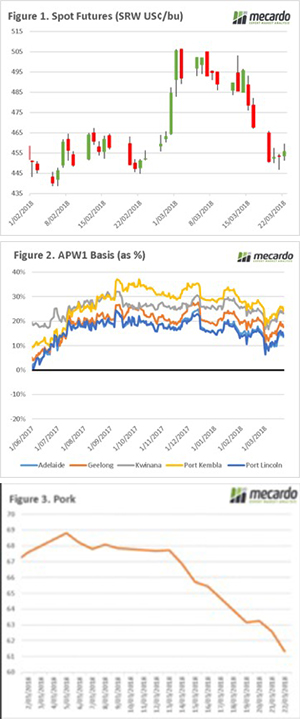
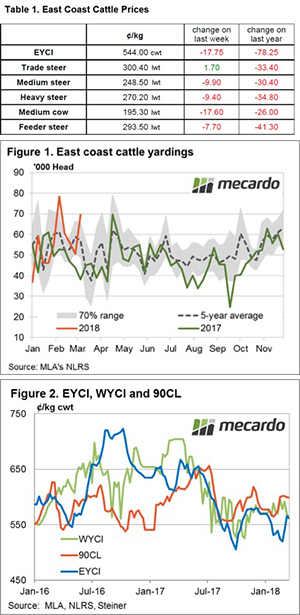
ground, trekking sideways to remain above 300¢/kg lwt. Medium cows taking the biggest hit with an 8% drop to close at 195.3¢/kg lwt – Table 1.

Figure 1 gives a clue to the pressure behind the price weakness – a 37 % lift in cattle throughput along the East coast to see 69,515 head yarded. This reflects a level 22% higher than the seasonal average pattern for this time of the year and extends above the usual range that could be expected given the historic variation in the series, as shown by the yardings pattern breaking outside the top of the grey 70% band. The primary catalysts for the lift in East coast throughput were increases on the week in NSW and Queensland yarding levels of 38% and 87%, respectively.

In the West cattle yardings trended sideways, although this week’s yarding of just over 3,000 head sits 16.5% lower than the average weekly yarding seen in WA since the start of the season. Throughout of young cattle in WA also remained subdued, easing 10% to 1,245 head and the lighter numbers here managed to help the Western Young Cattle Indicator (WYCI) hold its ground at 568.25¢/kg cwt. Offshore markets for 90CL grinding beef continue to maintain a stable footing with the sixth straight week remaining firm near the 600¢ level – Figure 2

What does it mean/next week?:

Its hard to see East coast throughput sitting this elevated for too long and the prospect of the looming Easter break along with the northern rains due, courtesy of Cyclone Nora, will see supply tighten temporarily in any event – which should give some support to prices.

Although, some meat works may take the opportunity to close for maintenance or reduce capacity during the holiday lull so processor buyers may not be as active, impacting demand in the short term. On balance we’re probably looking at some sideways price consolidation as we head to the Easter break.

Wool market bouncing along.

One week down, the next week up. This has been a familiar pattern in recent times although this week the lift in the market was all due to currency movements.

It was a tale of two markets, the opening day was where all the gains were made, with Thursday delivering a modest retracement. The Eastern Market Indicator (EMI) had picked up 27 cents to 1778 cents, ironically retrieving the same amount that was lost last week. In US$ terms the EMI actually lost 2 cents (Figure 1).

The AU$ lost favour during the week, easing by 1.3 cents to $0.775, which accounted for all the increase in the general market indicators. The West also had a good result, the Western Market Indicator (WMI) gained more than last week’s loss seeing a 35-cent improvement to 1869 cents.

The two-market story continued into the relative prices within micron categories; again, AWEX reported that better style wools, while in short supply, were keenly sought, conversely high mid-break wools were increasingly neglected and discounted.

Crossbred types also recovered all last week’s losses, rising between 10 and 20 cents. Merino skirtings followed the fleece types higher for the week and generally held the gains to the close.

Merino Cardings also had a good week, posting around a 30-cent improvement.

As has been the case in recent months, growers responded strategically to the better prices and only passed in 4.0%, down from last week’s 9%, resulting in a clearance to the trade of 36,707 bales.

The week ahead

Next week there is almost an additional 10,000 rostered, with 47,091 bales forecast on offer across the three selling centres.

Due to the Easter break, the two days of sale will be on Tuesday & Wednesday, with a one week break after Easter.

On resumption, another 47,000 bales are offered, which will test the resilience of the market. AWEX report that volumes are predicted to decline after this sale.