Tag: article

It’s a restockers market.

Lamb markets had their usual reaction when prices fall heavily, supply contracted as producers looked for alternatives to selling. Not all prices steadied though, with restocker lambs taking a hit and now looking very cheap.

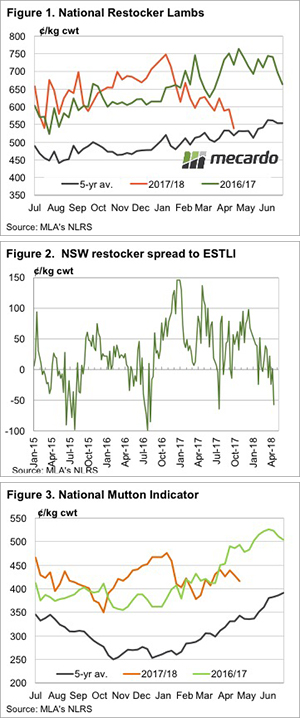
Finished lamb supply tightened, but it seems unfinished lambs kept coming. Figure 1 shows the National Restocker Indicator took a heavy hit this week, moving to a low not seen since August 2016. The difference in seasons this year and last is stark. Restocker lamb prices being 200¢ lower this year is a pretty good reflection of the lack of feed available for lambs.

Figure 2 shows NSW restocker lambs at a 60¢ discount to the Eastern States Trade Lamb Indicator (ESTLI). Even if we expected the ESTLI to stay around the 580¢ mark, we’d say restocker lambs were cheap. At 520¢ a 16kg lamb will cost $85-90. If the ESTLI gets back to 650¢/kg cwt, which it should when it rains, a 20kg lamb will make $135-140 per head. It’s a good margin.

Mutton hasn’t been so caught up in the lamb price fall. Figure 3 shows the National Mutton Indicator has lost 23¢ in the last few weeks, and is 80¢ below the same time last year.

In the West, mutton is around the same price, but WA has the most expensive lambs in the country. The Western Trade Lamb Indicator is at 614¢/kg cwt, down 18¢ on last year but still priced pretty well. There is not a lot of rain forecast for WA, so prices may start to track down towards east coast values.

The week ahead

There is not much rain forecast for anywhere over the next eight days, so it’s hard to see much upside for sheep or lamb prices in general. Don’t be surprised to see restocker prices bounce though, as figure 2 shows, they don’t stay this cheap relative to finished lambs for long.

No news is good news.

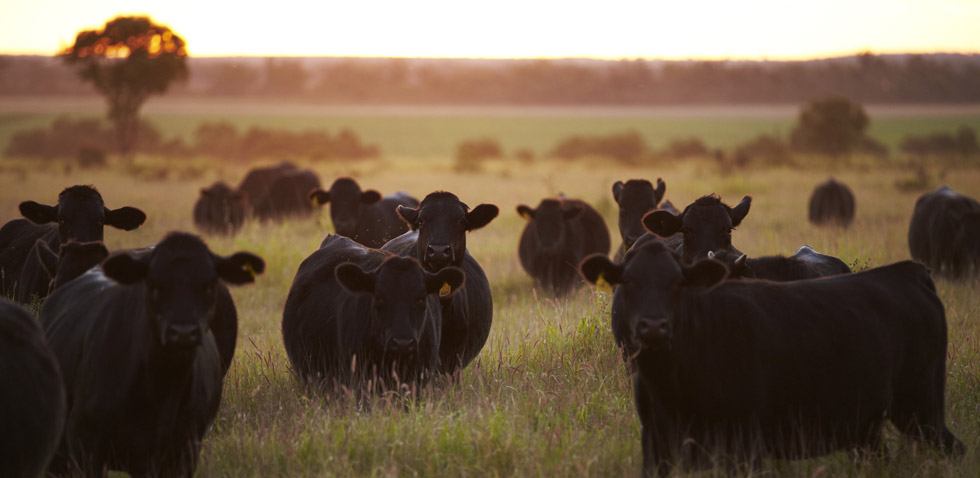
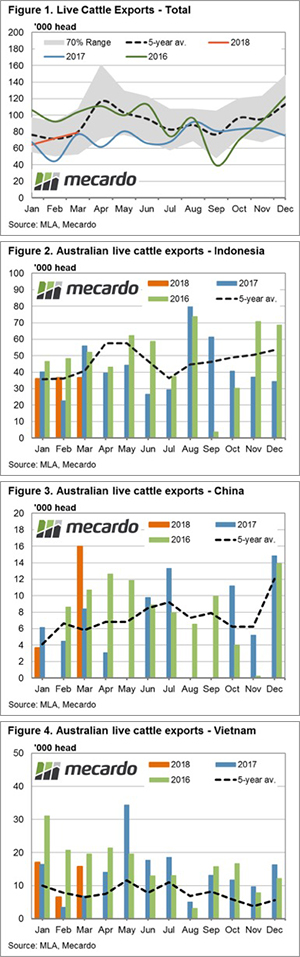
At a time when the live sheep export trade is making headlines for all the wrong reasons the big brother of the industry is quietly getting on with the job. Live cattle exports make up the lion’s share of the total trade out of Australia, with the combined beef and dairy trade representing 1.5 billion of the 1.8 billion annual farm gate returns. This piece takes a quick look at how the key markets are faring so far this season.

A look at the current seasonal pattern shows that total live cattle exports for the first quarter of 2018 have pretty much been on the five-year average trend after a slow start in January – Figure 1. Average monthly trade volumes across the first quarter of 2018 sit just 5% below the five-year first quarter average, but is 14% higher than the average monthly volumes set during the first quarter of 2017.

The trade to Indonesia dominates the market share and it is currently sitting at 50% of the 2018 total live export volumes. This is despite the first quarter of the season averaging 3% below the five-year seasonal pattern at around 36,000 head per month – Figure 2.

The flow of live cattle to China has been more erratic than the Indonesian experience so far this year. After an average start to 2018, February saw nothing delivered and then March followed up with the biggest monthly figure reported since the middle of 2015 at just under 16,000 head – Figure 3. Indeed, this is the largest March flow on record from Australia to China and represents a 175% increase on the five-year average pattern for March.

Average monthly consignments to China for the first quarter of 2018 are running 19% above the seasonal five-year trend and sit 3.5% higher than during 2017, a good sign of continued growth in the demand from China – which currently comprises about 9% of the market share of the trade out of Australia.

Vietnam holds the second spot in terms of market share of Australian live cattle exports, with the percentage of the trade so far this season sitting at around 18% of total flows. The first quarter of 2018 has begun in a reasonably solid fashion with average monthly volumes over the period sitting 61% above the five-year seasonal pattern monthly average levels – Figure 3.

What does it mean?  

Seasonal movements of total live cattle flows show that during April and December there is often a peak in trade volumes as consignments to Indonesia commonly increase during this time.  Domestic cattle prices are broadly softer and the Australian dollar has been trending lower since the January 2018 peak above 81US¢, which should assist the competitiveness of live cattle into the peak part of the season.

Combined with the strong start to the year out of Vietnam and China, it is something positive to look forward to for live export participants enduring a bit of a delicate time at the moment.

Post Easter sale success.

Sales resumed following the Easter break with the largest offering for the season requiring Melbourne to sell over three days. 54,409 bales were offered with 51,066 sold, well above the weekly average of 41,000 bales sold for this season.

Despite the increased offering, the Eastern Market Indicator (EMI) lifted 4 cents to 1776 cents, while in US$ terms the EMI found an additional 12 cents to settle at 1376 cents (Figure 1).

The AU$ didn’t provide the wool market with any favours. It’s held steady over the past couple of weeks at US$0.77 or better, which was represented by the solid result of the EMI in US$ terms. Fremantle sales also fared better, the Western Market Indicator (WMI) gained 13-cents to 1884 cents.

Despite the solid performance, sellers in W.A. were underwhelmed and still passed in over 9% on Thursday & 7.8% for the week; while nationally 6.1% was passed-in.

This week, the fourth largest weekly $ value of wool was traded since AWEX commenced reporting on auctions in 1996, with $97.4 million flowing back to wool producers for an average bale value of $1,907.

It was noted that burry or high VM lots found support, especially towards the end of the week. Our reports over the past few months have regularly noted that secondary lines were often struggling to find buyer support, so this change in sentiment is welcome news. As the higher VM volumes ease we usually see the severe discounts also ease; the next couple of weeks will tell the story if this is the start of the improvement or a one-week wonder.

Crossbred types again had a mixed result, with finer types (28 – 30 MPG) finding good support and lifting 20 to 40 cents. However, stronger microns were irregular and tended cheaper.

Merino skirtings followed the direction of the fleece types, although generally slightly more modest price increases were noted over the week.

Merino Cardings had another good week, posting another 27-cent improvement average across the three cardings indicators.

The week ahead

Next week just under 41,000 bales are offered, a significant reduction on this week’s sales.

This was another week of larger clearances than the previous sale, with the market finishing in a solid state after a slightly soft opening. It feels that the short to medium outlook is positive based on the current market levels and clearance rates.

On top of the solid performance in the current market, AWEX report that volumes are predicted to decline after this sale, with the forecast dropping below 40,000 bales in the coming weeks.

Friday the 13th, unlucky for some?

For those of a superstitious bent, Friday the 13th is considered to be unlucky. In this week’s comment, we take a look at futures pricing & the USDA update to global wheat supply and demand, in order to determine whether we are lucky or not.

The futures market rallied during has rallied strongly since the beginning of April, however in recent days prices have fallen 
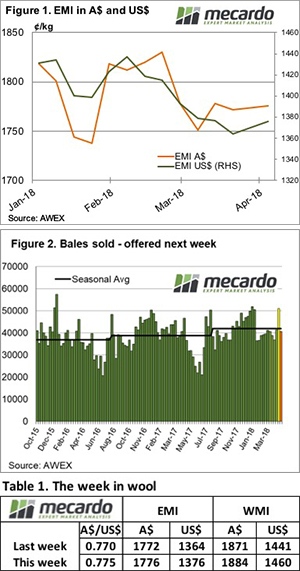
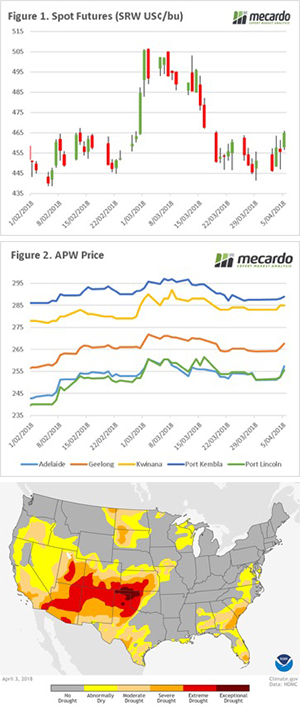
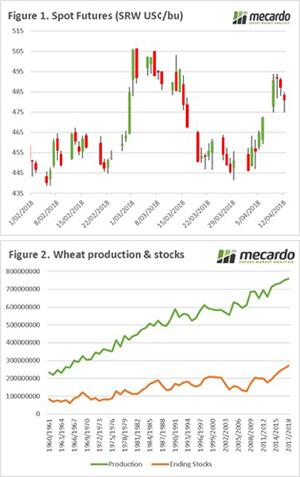
as a result of bearish data in the WASDE (more on that later), and the increasingly tense stand off between US & Syria/Russia. However, prices remain 3% higher than the close last Thursday, and 8% up on the start of the month (figure 1).  So in this case we are definitely lucky, to have much higher prices than the start of the month.

The April WASDE report was bearish for wheat, with production estimates for the current season raised by 962kmt, which mainly came from a month on month increase in production estimates of 13.47% in Morocco. Raising global production to 759mmt, the highest global production on record (figure 2).

Due to the rapid export pace in Russia, their ending stocks were reduced by 1.1mmt, which is a bullish factor. However, lower feed usage in Iran offset much of this with an increase in end stocks of 2.3mmt. Overall, global end stocks are forecast to end at 258mmt, 14mmt higher than last season and also an all-time record (figure 2).

The WASDE paints a concerning picture, with world production and stocks for 2017/18 at record highs, it reduces the potential for the market to provide sustained strong rallies. The world needs a very large drop in production in one of the major northern hemisphere to provide a drive in the market to benefit Australian producers.

I recommend you read Tuesdays article “How do you eat an elephant?”, in order to get some ideas on hedging strategies for the 2019 crop.

What does it mean/next week?:

At a local level, we need to keep a close eye on Australian weather, many cropping regions are yet to receive meaningful rain. It is however very early in the season, and there is still everything to play for.

You might notice a bit of a pattern of involvement here, but in coming weeks posturing between Trump/Russia, Trump/China and Trump/TPP countries will have an impact on global markets both for commodities and equities.

Delayed Autumn break shakes out some more supply.

Persistent dry conditions, hitting NSW particularly hard, and a delay to the Autumn rains have forced higher than average seasonal yarding levels this week. Lamb and sheep prices are reacting to the higher saleyard numbers accordingly, with declines across all Eastern mainland state categories reported by Meat and Livestock Australia.

Figure 1 highlights the weekly and historic yearly price moves across the East Coast saleyards this week, and it’s a sea of red 
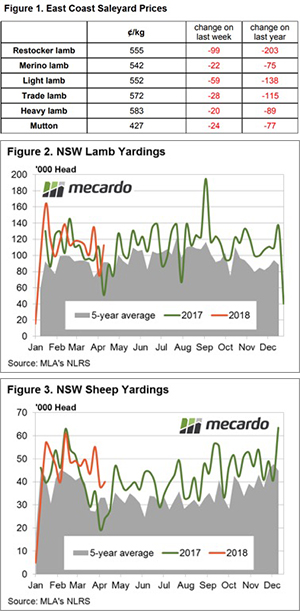
ink. Falls were recorded, ranging in magnitude from 3.5% to 17%, with Restocker Lamb taking the biggest hit, off a dollar on the week and 26.7% softer than this time last season. The Eastern States Trade Lamb Indicator (ESTLI) is mirroring the broader market decline with a 4.6% fall to close at 572¢/kg cwt.

There’s a different picture in the West with prices broadly holding their ground as lamb and sheep throughput levels are comparable to the volumes registered this time last season. WA Mutton is the laggard, off 1% on the week to sit just above 400¢ and WA Merino Lamb the star performer, registering a 5% gain to test back above 630¢/kg cwt.

Among the South Eastern regions, NSW and SA categories of lamb are leading the price declines with falls recorded in the 5%-15% magnitude, while Victorian lamb categories are not off as much, posting declines between 3%-10%.

Saleyard throughput across the East coast is reflecting the delayed start to the Autumn break with weekly numbers for both lamb and sheep above the five-year average levels. NSW is the key driver for the additional throughput as the dry conditions have been impacting producers there and having a notable effect on sheep yardings in recent weeks.

Figure 2 shows the 50% gain in throughput for NSW lamb this week and numbers spiked back toward 113,000 head, a level 22% higher than the seasonal average and 122% more than this time last year. NSW sheep yardings are showing a more definitive deviation from last seasons pattern than NSW lamb, with average weekly yarding levels for the last month sitting 46% higher than for the same timeframe last season and 39% above the longer term seasonal trend pattern – Figure 3.

What does it mean/next week?:

The rainfall forecast for the week ahead shows 5-10mm expected for most of NSW and up to 25mm for parts of Victoria, but little elsewhere is anticipated in the sheep rearing zones across the nation. It may be enough to ease the magnitude of the price declines witnessed this week, but not enough to put a solid floor under the market at this stage, nor to get prices moving higher in any significant way.

It’s a buy opportunity if you’ve got feed.

The Eastern Young Cattle Indicator’s (EYCI) decline continued this week. We’re not seeing finished cattle prices being dragged lower, especially not in the south, as the supply of slaughter ready cattle is weakening due to the dry. It’s not great for young cattle producers, but good news for traders.

The EYCI eased another 25¢ this week, heading back through support at the 514.50¢/kg cwt level. No doubt the fact that there 
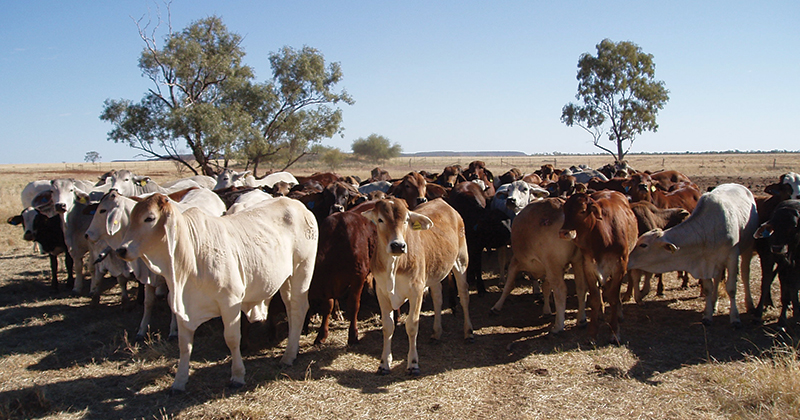
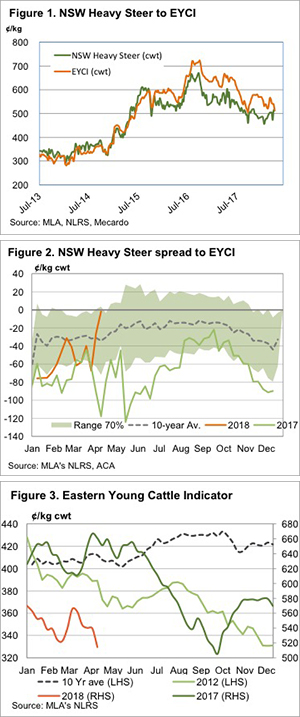
has been no real rain in April, in addition to the usual increase in young cattle supply in Northern NSW, is helping drive the EYCI lower.

Heavy cattle prices remain relatively strong however. The NSW Heavy Steer Indicator (figure 1) is actually sitting close to a nine-month high, at 512¢/kg cwt. The 2¢ discount for the Heavy Steer is as close as it’s been to the EYCI since spring 2015.

A relatively small spread between finished cattle and young cattle is not unusual for this time of year, but it’s not something we’ve seen during the herd rebuild. It suggests the young cattle supply is approaching normal, but the tight spread is obviously partly driven by the dry summer in NSW, Victoria and South Australia.

The bad news for cattle producers is that seasonality suggests that continued dry conditions are likely to see young cattle prices continue to fall. Figure 3 shows that the fall usually runs until at least May, and this could see the EYCI below 500¢ for the first time since the first half of 2015.

The week ahead

There’s not a lot of precipitation on the forecast, so we might see young cattle prices continue to ease next week.

There is opportunity for restockers to buy at close to 3 year low prices, and the fact that heavy cattle values are holding strong gives an indication that the finished cattle market might find support, making a good trade.

Low supply pressure continues for merino wool.

Supply in Australia continues to underperform for the broad merino categories, at a time when other greasy wool exporting countries are at a low point in their seasonal supply patterns. This article looks at the latest AWTA core test volume data, which allows a breakup of supply by micron category.

Figure 1 shows the year on year change for March 2018 AWTA core test volumes by micron category, running from 15 micron 
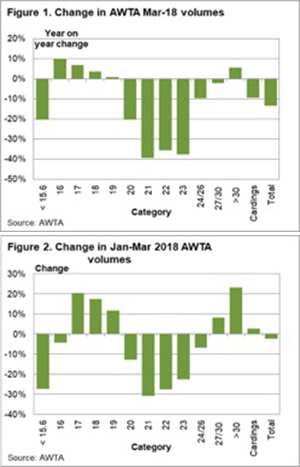
and less on the left through to greater than 30 micron, then cardings and finally total volume on the right. The 20 through 23 micron categories, effectively the merino production on the broad side of the average fibre diameter of 19 micron, stand out as having the largest fall in March. 21 to 23 micron volumes are down by 35-40%, which is a large fall, complicated by the continued high level of vegetable fault in eastern Australia.

As a check on single month variations in volume, Figure 2 shows the year on year change in volumes for the January to March period. It shows a slightly different view. However the 21 to 23 micron volumes are still down by 20-30% for the March quarter compared to a year ago which is still a large fall in supply. On the three month view, 17 to 19 micron volumes are up, as are the major crossbred micron categories. Overall the total wool volume for the March quarter is down by 2.5% compared to 2017, which does not tell what is going on for the different micron categories.

So, what is happening? In March 2017 some 59% of 21 micron wool sold at auction came from four regions; the Great Southern in Western Australia (24%), the Midlands in Western Australia (9%), northern South Australia (16%) and southern South Australia (10%). While the auction and AWTA data are not directly comparable, the drop in 21 micron volumes in these four regions accounts for some 25% of the 39% drop seen in March AWTA volumes. In other words these four regions account for about two thirds of the change seen in 21 micron volumes.

The four regions accounted for 58% of 21 micron sales in April 2017, before dropping back to around 40-44% by mid-2017. The seasonal conditions in these regions which has caused the current fall will not turn around quickly and given their continued importance to 21 micron supply in Australia, it seems likely the supply of broad merino wool will remain well below year earlier levels for the balance of this season.

Key points:

  • AWTA total core test volume fell by13% in March, and is down by a smaller 2.5% for the March quarter.
  • Changes in total volume, however, mask some quite varied changes in volume between the different micron categories.
  • In terms of micron categories, the broad merino micron categories have fallen significantly this year.
  • 17-19 micron volumes are up as are the main crossbred micron category volumes.

What does this mean?

The supply of broad merino micron wool is down by 20-30% for the three months to March and by more in March. Two thirds of this fall is coming from the Great Southern and Midlands in Western Australia and South Australia. These regions are likely to continue driving the supply of broad merino wool well below year earlier levels for the balance of the wool selling season, which should help support broad merino prices which in turn will help support medium merino prices.


Fundamentals and black swans

The market has been knocked around this week, by both fundamental factors driving pricing and the black swan event in the form of President Trump. Although volatile, the market can provide pricing opportunities for Australian producers.

This week has seen a huge degree of uncertainty across all markets. The talk has moved away from the fundamentals, and onto the spectre of a volatile trade war between the worlds two largest economies. The futures market took a dive immediately after the announcement of tariffs by China, in response to comments by Trump. Overnight however, the market recovered, taking us to two-week highs (figure 1).

At a local level, cash APW1 prices have traded in a narrow range since the fall of the market in mid-march (figure 2). This week however, prices have shown some upside, with between A$2 & A$6 rises across the country.

Although the tariff wars provide some interesting news, the fundamentals continue to be a strong driver of markets. Many areas of the US continue to experience drought conditions (see map), leading to reduced expectations for the winter crop. At present, only 32% of all winter wheat acreage in the US is considered to be good-excellent. This is an extremely low figure, and places it at the lowest level since 2002. In order to recover decent rainfall will be required in the next fortnight, without rain further downgrades are expected.

In the coming weeks we may experience some upside in pricing as markets take into account drought conditions in the US.

What does it mean/next week?:

The market is going to continue to be extremely volatile. At present, Trump has already pointed towards a further $100bn in additional trade tariffs, which will likely be met by retaliation by China. The story is far from over, and is likely to continue to be a cause for concern, although potentially offer opportunities for Australia.

All eyes need to be on the weather, with poor forecasts throughout many areas of Australia’s grain growing regions.

Easter lull hits supply.

A short week due to the Easter break has taken its toll on cattle supply with yarding levels and slaughter reflecting the holiday break. Saleyards reported some higher steer prices on the back of the reduced supply, but most other cattle categories trekked sideways in the reduced trade environment.

Table 1 outlines some price movements on the week for key categories of cattle at East coast sale yards. The benchmark EYCI was only marginally lower, closing at 539.50¢/kg cwt yesterday. Trade (298¢), Medium (274¢) and Heavy Steers (279¢) all managed 10-15¢ gains on live weight prices, while Feeder Steers lost a little ground off 2
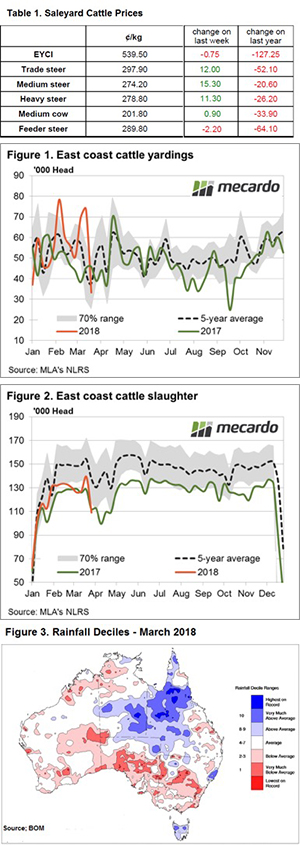
¢ to close at 289.8¢/kg lwt.

Figure 1 shows that East coast cattle throughput is back within the normal seasonal range, after posting elevated levels over the past fortnight and is now trending slightly below average at around 33,000 head. The recent volatility noted in East coast yarding levels have been mainly QLD centric with northern producers responding to monsoonal climate variability.

The East coast slaughter pattern is also reflecting the Easter inspired lull in activity and is demonstrating a similar pattern to yarding levels with a higher than 2017 pre-Easter slaughter now back under the 2017 levels this week. A 109,000-head cull was reported for the week ending 30th March – Figure 2.

In off shore markets, the 90CL frozen cow indicator continues to consolidate around 600¢/kg CIF and has been holding firm at this level for the last two months. The usual seasonal pattern for 90CL is for an increase in prices as we head toward the US grilling season with a few more burgers flipped onto the BBQ.

What does it mean/next week?’

The April Bureau of Meteorology forecast suggests average rainfall across the eastern seaboard for the month, although not much is anticipated to fall in the coming week in the South as a blocking high pressure system is keeping it clear and sunny.

Dry rainfall deciles for March across much of NSW and SA demonstrate just how some parts of the country are in need of the Autumn break and the dry conditions have been keeping prices subdued in some areas – Figure 3.

Prices are likely to keep in a consolidation phase in the coming week, with a slight downside bias as the delayed start to the break applies some pressure – all eyes are on the sky for some rainfall and some price support as we head towards Winter.

No post Easter price spike

There was no post Easter price spike this week, with processors seeming to have their supplies booked up well in advance. Saleyards were well supplied, and the good news, again, is that prices remain relatively strong despite plenty of lambs and sheep being on offer. 

Lamb prices eased marginally this week, and mutton prices were up a bit. The result has the National Mutton Indicator (NMI) sitting close to an 8 month high in relative terms. Figure 1 shows the NMI is now at a 38% discount to the Eastern States Trade Lamb Indicator (ESTLI), which is just below the mark set in December.

The NMI discount might be strong relative to the last 8 months, however strong supplies see it still sitting 8 percentage points below this time last year.

It’s interesting given the low sheep offtake shown in this week’s analysis article  that this year mutton has been more discounted than during the flock liquidation of 2014-15.  Obviously, lamb prices are a lot higher and this appears to be putting some pressure on the mutton discount, despite being in the midst of a flock rebuild.

The Aussie dollar has weakened recently (figure 2), this should be providing support for export lamb values in our biggest markets. The ESTLI in US dollar terms is now looking not that expensive. Figure 3 shows USD prices were higher last year, and in 10/11 and 14/15.

This is another indication that perhaps there is room on the demand side for lamb prices to push higher, that is if supplies do start to wane over the coming month or two.

The week ahead

The lamb market is in reasonable shape. There will be upside if or when it rains, but the trade was shaping between the US and China has added in some uncertainty. There will be no direct impact on Australian lamb, but China’s tariffs on US beef and pork are likely to have some indirect impacts on our meat values.  Which way our prices get pushed requires a bit more analysis.