Tag: Articles

Down for the count?

The grain trade awaits the release of backlogged data from the USDA which will be broadcast this evening (8th February 2019)

The spot Chicago futures contract after posting gains in the post superbowl trading days, has been hit with an almighty hammer overnight. The future contract declined by A$6 overnight (Figure 1).

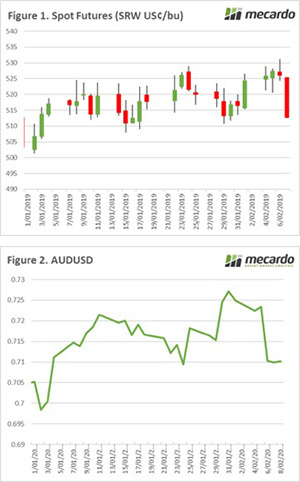
The fall in prices was due to a combination of factors (as tends to always be the case), the main ones being the expectation that XI-Trump trade talks are not as jovial as previously anticipated.

Another reason in the sharp overnight correction is due to the imminent release of backlogged data by the USDA.  The data released tonight will be the first information from the USDA since mid-December. Will this create fireworks or will it fizzle out?

The RBA have changed their tune on interest rates. In the past year the commentary was of a likely interest rate rise, however this week they are pointing towards potential interest rate falls. The impact of these statements was felt in the currency market with the AUD falling to 71¢ (Figure 2).

This is the second major crash in the AUD since the start of the year. After the last crash the market recovered shortly afterwards, the question will be – is the AUD down for the count or like Tyson Fury will it regain its legs?

A reduced local currency will help with exports. On the flipside however it will increase the cost of imported products such as fuel and fertilizer.

Due to an unexpected error, the Mecardo website has lost some functionality. We are currently working day and night to resolve the issue.

What does it mean/next week?:

The market will be chewing through the data releases from the USDA overnight, which will give the market its direction over the coming week.

The Baltic Dry Index has capsized

Australia is a net exporter of grains, most of which will make its way out of the continent on bulk vessels. Grains are undifferentiated commodities with largely no difference between origins, therefore the cost of logistics becomes a primary driver of competitiveness. In this article we dive into the Baltic Dry Index and its impact on markets.

So what is the Baltic Dry Index (BDI)? The BDI is an index which tracks the cost of bulk shipping around the world. The index is calculated on a daily basis and covers twenty typical routes using three vessel types (Capesize, Panamax and Supramax.) This gives an indication of the trend in price movement, and provides an insight into how much it will cost to transport bulk commodities i.e. a lower BDI would indicate reduced freight costs.

This is important for Australian producers as we typically export the majority of our grain and oilseed production. A low freight rate therefore reduces the benefit of geographical advantage.

The BDI has a secondary function. It is considered by many to be a leading economic indicator. The cargoes typically transported by bulk vessels are commodities requiring further processing (iron ore, coal, grains etc) to create a product. This gives a potential indication of future economic growth, as the demand for raw commodities such as iron ore will increase as economies grow.


So why are we talking about it? The BDI has submerged (pardon the pun) in recent weeks. In figure 1, the daily change in the BDI is displayed since the start of December. The last positive move was on the 8th of January. This has resulted in a 50.5% fall in the index since the start of January.

It is not however wholly unexpected to see a fall in the BDI, as seasonal trends do tend to show a dip in the first two months of the year (figure 2). The index currently sits at 634, which is a low level albeit within the range which has been experienced during this decade.

So why has it fallen? There are several theories as to why the BDI has capsized, and a combination of all are likely to have had an impact:

  • The Vale dam collapse in Brazil which has led to the loss of 134 lives has resulted in up to forty million tonnes of iron ore being removed from the market, as Vale decommissions similar facilities.
  • The Chinese economy looks to be taking a turn for the worse with the Caixin manufacturing purchasing managers index falling below expectations signaling a deterioration in the manufacturing sector.
  • Seasonal slow down ahead of the Chinese lunar new year.
  • Continued overcapacity of bulk vessels and mismatches of vessel sizes.

What does it mean/next week?:

If the sharp decline in the BDI endures, this does not bode well for global economies – especially China. The Australian economy is heavily reliant upon China as a trading partner, and any fall in their buying power will have an impact on many of our commodities and food products.

The fall in the index along with poor economic data emerging in China may spur a quick resolution by the Chinese delegation in the Trump tariff talks.

The fall in the BDI does not mean that grain prices will fall, however it does mean that traditional trade flows become less important as shipping costs fall.

Key Points

  • The BDI is an indicator of the cost of bulk shipping rates, but also holds a secondary function as a primary economic indicator.
  • The BDI has keeled over, sinking to the depths of 634 from 1282 at the start of January.
  • The sudden fall could point towards a coming slowdown in the global economy.

Plan for the worst; hope for the best (in the west).

In this update I take a look at the most recent BOM three month climate outlook. What does it mean for the 2019/20 crop? In other news there could be some excitement on the market as the USDA start releasing data after a >1 month hiatus, and the Chinese-US negotiations comes to a head.

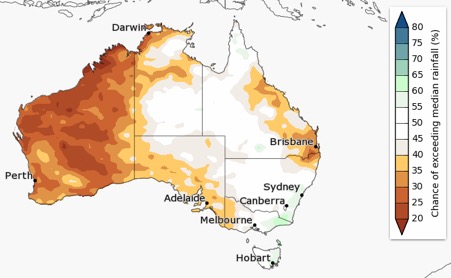
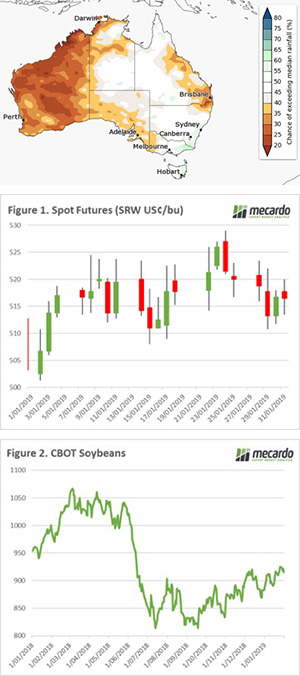
The bureau of meteorology has released its three month climate outlook. It doesn’t look good for Queensland and the West. After a fantastic year where WA produced a 17.5mmt crop, pre season rainfall has a limited chance of exceeding the median. This will put a dampener on expectations for the coming season. However, I have a few thoughts when it comes to this projection:

1. Weather projections can be highly volatile, and this may not be realized.

  1. Although subsoil moisture prior to planting is very welcome, it doesn’t make the crop.

There are a range of factors that will determine the development of the 2019/20 crop, however on the 1st of February it is far to early to judge the end result. It is always best to ‘plan for the worst, hope for the best’.

The futures market lost ground this week with spot futures back A$5 (figure 1). The market has remained subdued whilst awaiting fresh data releases by the USDA. I covered the lack of volatility and volume in late last week (see here) and on the reaction to USDA releases (see here). The release of new data after such a long hiatus could lead to increased levels of volatility, if there are any major surprises that private forecasters had not expected.

The big news to watch over the next week will be whether Trump and Xi can reach a middle ground to reduce the tensions between the two giants of trade. There looks to be some thawing of the relationship as China has agreed to purchase 5mmt of Soybeans. If you have been paying attention to my updates over the past year that soybeans have been at the centre of the trade tariffs which have resulted in US soybeans falling (and Brazilian sources rising).

As the two nations commenced negotiations the market has been quietly confident of a amicable solution being found. This has seen the market start to gain ground (figure 2), as the market opens with news of a 5mmt will we see a sharp upward trajectory?

What does it mean/next week?:
We could be in for a wild ride over the next week as the market reacts to the release of USDA data and US-China trade negotiations.

Merino lambs finding support but restockers not

The Australia Day holiday saw an interrupted week for lamb sales but prices were relatively steady for finished crossbred lambs. Though, we did see some interesting price movements for restocker and Merino lambs, as well as the Mutton indicator, which might be a preview of things to come.

Some large yards sell lambs on Monday’s so this week’s indicators could change a little come next week. It was, however, good to see the Eastern States Trade Lamb Indicator (ESTLI) move past Australia Day without falling further.

Regular readers will remember that lamb prices are usually strong in early January as lamb demand ramps up. This year processors were well prepared and booked stock early, only to see supply match demand and lower prices than expected. In the past we have seen prices fall in February as demand weakened, this year a supply drop might match it.

The steady finished lamb prices seem to be dragging restocker price expectations back. Figure 2 shows that restocker lamb prices are at their lowest level since August, as those finishing lambs adjust their buy price to reflect the finished lamb prices on offer.

Merino Lamb prices have done the opposite. Figure 3 has Merino lambs hitting a three month high.  Supplies of Merino lambs are likely to be getting thin, and maybe demand is picking up as those looking for restocking opportunities like the look of the wool value.

Mutton markets have also recovered with the National Mutton Indicator nearly back at 400¢. Still at a heavy discount to lamb, mutton has plenty of upside with some improved seasonal conditions.

Next week?

We would think the supply side of the lamb market should start seeing prices creep higher. We are already seeing a dearth of heavy lambs and we know from history that fewer heavy lambs soon translates into fewer trade lambs. Especially when feed is expensive.

As January goes…

Back in 2016 MLA put out an interesting piece that looked at the Eastern Young Cattle Indicator’s (EYCI) performance over the month of January and compared it to the rest of the season. As each January ends it makes me think of this piece. Let’s hope for our beef producer’s sake it doesn’t hold this season.

Click here to recap on the original MLA article.

The basic premise of the piece was that the year on year January performance of the EYCI was often reflected in the rest of the season’s pattern, moving in the same direction and usually by a similar magnitude. The EYCI closed at 468.75¢ yesterday, around 13% below where it closed in January 2018 – Figure 1. If the principle holds this year it would see the EYCI testing towards the 400¢ level by year end, let’s hope not.

Young cattle in the West followed the EYCI lower to see the WYCI drift below 500¢ for the first time since June 2018. However, in offshore markets the 90CL imported cow indicator managed to hold above 600¢/kg CIF for the third week in a row. Steiner reports that US demand for this type of grinding beef has been lower over January but imported beef volumes from Australia and NZ have also been lower, thus keeping the price of the 90CL reasonably stable.

In domestic markets the EYCI was the only NLRS reported category of cattle to drop this week along the East coast with gains noted between 2%-8%. Medium Cow the most improved, posting a 7.9% lift to close at 195.1¢/kg lwt – Figure 2.

East coast cattle throughput for the week ending 25th January dipping 36% from the previous weeks figure to see yarding levels 18% below the five-year average for this time in the season – Figure 3. Lower than normal cattle reported in NSW and Victorian sale yards dragging down the East coast total and the potential reason for the support being shown to most East coast cattle prices this week.

Next week

Monsoon type activity across northern Queensland will see increased rainfall levels start to impact into central Queensland in the coming week with falls between 25-100 mm expected as far south as Rockhampton, on the coast, and Charleville, in the centre.

However, there are limited falls forecast for NSW and Victoria mainly on the coastal/eastern regions. With the 90CL holding up so well its unlikely to expect the EYCI continue too much lower and with rain creeping further south in Queensland this will start to provide some support to the EYCI eligible cattle in the northern sale yards.

Minor movements for wool.

The general overview of this week’s wool market was that sellers saw minimal movements. In fact, if markets were stronger on day one they gave the gains back the next day, and vice versa if markets started softer.

Buyers began keenly but again there is evidence of wariness at these price levels, while wool growers are happy to continue to sell with a modest pass-in rate this week.

The Eastern Market Indicator (EMI) increased 7 cents on the week, ending at 1,934 cents. The Au$ compared to the last week was stronger at 0.712 US cents. That lifted the EMI in US$ terms to 1,405 cents, a strong rise of 32 cents (Table 1).

Fremantle had a smooth week of sales, with some small gains in finer MPG’s. The Western Market Indicator (WMI) rose 2 cents on the week to finish at 2,094 cents.

This week saw a supply drop on levels from the last few sales, with just 38,830 bales on offer. Growers passed in 7.2% of bales offered, resulting in a clearance to the trade of 36,027 bales. The season to date has seen 952,848 bales offered which is down 15.7% bales few than the same period in the 17/18 season.

The dollar value for the week was $73.63 million, for a combined value of $1.9 billion so far this season.

The total wool offering over all micron ranges is showing a mixed bag. Any MPG categories broader than 18.5 have presented lower volumes season on season, with the 21 MPG as an example 44% down on last year. On the other hand, finer than 18.5 MPG volume is up all the way to the superfine types. 18 MPG is up by 17% while the 15 MPG is 13.5% on a season to date comparison.

Crossbreds, while limited in offering, were keenly sought this week; it was a strong performance with the 28MPG gaining circa 90 cents in both Sydney & Melbourne. The cardings indicator fell again in all centres with reports of 20 to 25 cent falls in the East, while the West was largely unchanged.

The week ahead

Next week the offering isn’t set to reach too far from this week’s level, with 40,426 bales rostered across the three selling centres. Sydney will be holding it’s designated Superfine Sale.

Looking further ahead, a big drop is on the roster. Week 33 of the selling season is currently set for just 30,981 bales, with 30,000 to follow.

Wherefore art thou heavy lamb?

In the Friday sheep market comment we noted the lack of Heavy Lamb across NSW sale yards since the start of the season. This analysis piece looks at the other two key mainland states across the East coast to see if the pattern of Heavy Lamb throughput is being replicated.

Recap on the Friday Sheep market comment here.

Heavy Lamb yarding levels in NSW have averaged 25,750 head per week since the start of the season. Compared to this time last year NSW Heavy Lamb yarding was averaging over 42,000 head, so we are running nearly 40% below the 2018 pattern. Measuring the volumes across the last five seasons shows that Heavy Lamb throughput in NSW for the same time frame is around 33,600 head, which puts the current sale yard volumes 24% under the long-term seasonal average – Figure 1.

Victorian sale yards have been displaying a similar pattern with the current year’s volume averaging 14,226 head per week compared to nearly 21,000 head in 2018. Although not as severe a difference than in NSW it still represents a drop of 32%. A comparison to the longer-term average over the same period shows Victorian Heavy Lamb yarding levels averaging over 16,600 head per week putting the 2019 pattern nearly 15% below the five-year average – Figure 2.

The story is the same for South Australian throughput levels too, and despite the absolute yarding figures in South Australia being lower than Victoria and NSW, the magnitude of the decline in yarding volumes are like what is being experienced in NSW.

In South Australia Heavy Lamb numbers at the sale yard averaged 2,760 head per week compared to just over 4,800 head in 2018, a drop of 43%. The 2019 pattern for the five-year seasonal trend is also below average running 37% under – Figure 3.

What does it mean/next week?

Given the tough trading conditions last season and the move to flock liquidation due to the dry spell its unsurprising to see the lack of Heavy Lamb in these states. It’s likely to see Heavy Lamb prices remain well supported while the supply remains soft.

Furthermore, it won’t take much to see a kick on in lamb prices should we start to see a more favourable turn around in weather conditions as we head toward the Autumn.

Key points:

  • Victorian and South Australian sale yard throughput levels for Heavy Lamb are mirroring the reduced supply being experienced by NSW.
  • Victorian Heavy Lamb numbers are running 15% below the five-year seasonal average.
  • South Australian Heavy Lamb numbers are more pronounced, trending 37% under the five-year seasonal average.

Weekly Wool Forwards for week ending 01 February 2019

This week has seen a lot more action in the market across both fine and coarse fibers. We saw confidence in coarse wool prices decline slightly this week, after an interesting increase after the Christmas break. The rise in the Aussie dollar didn’t seem to dampen the forward market.

In the 19 micron category, six trades were dealt. Three trades were made for April, two were for 2230¢/kg and one was the first minimum price contract we’ve seen for many months.  The May trade hit at the same price, while the October and November trades were agreed at 2140¢/kg and 2128¢/kg respectively.

In the 21 micron category, five trades were dealt. Most of these were for April and May, the agreed price ranging from 2060¢/kg to 2190¢/kg. The odd one out was for October and agreed at 2060¢/kg.

In the 28 micron category, three trades were dealt, two for May for 960¢/kg and one for June for 970¢/kg.

Over the last two weeks we saw coarse wool bids close to auction levels, but this trend seems to be declining, as bids were below auction rates by more expected margins.

We saw an upswing in the Aussie dollar of nearly 1.5¢, which would usually mean less activity from overseas buyers. It didn’t appear to hold back forwards sales this week, hinting that either further upward movement or supply is a concern.

It’s so hot that the trees are whistling for the dogs

The markets have been quite quiet in recent days. In this weeks comment we are looking overseas at bearish wheat planting numbers, and the impact of heat on electricity demand.

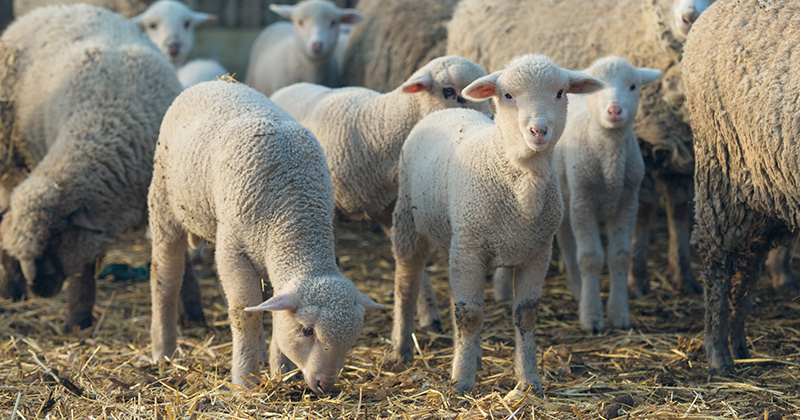
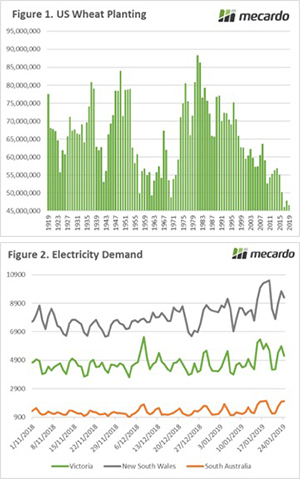
In lieu of data from the USDA, private forecasts become more important. Farm Futures in the US have conducted a survey of producers in order to gain an insight into planting expectations. It is anticipated that corn will rise by 1.3% year on year. There will however be major downward revisions to tariff impacted soybeans and sorghum with a substantial 5.5% and 12.1% reduction.

Wheat continues to lose popularity in the US, with planting levels for all wheat (spring, winter & durum) are at 46.6 million acres. This is the second lowest level in the past century (figure 1), the lowest being two years ago in 2017. Although technology has meant that yields are drastically improved from the past, this does place the US in a poor position if the weather turns poor in the growing season.

Yesterday South Australia sweltered through record temperatures, and Victoria is going to be hit with hot temperatures (and some strong winds in places). As temperatures increase demand (figure 2) on power infrastructure increases due to the number of people (myself included) sitting in air-conditioned rooms.

The weather is also starting to impact heavily upon the sorghum crop. The beneficial rainfall in December in NNSW and QLD has been followed up with dry weather, which has diminished the potential of the summer sorghum crop.

It’s important to be aware of the risk of heat stress in these hot days, so ensure that you remain fully hydrated – and slip, slap, slop.

What does it mean/next week?:

The reduction in acreage in the US starts to point toward a market balancing further and further towards a bullish sentiment. It will only take a production issue in North America or the black sea region to see a strong upward movement.

Sellers happy but buyers wary

On the surface, the wool market appears to be meandering along at a comfortable level, especially if you’re the seller. Buyers, on the other hand, are acting with caution in accepting orders for future delivery.

Another large clearance relative to the last 8 months was evident, with prices pretty much unchanged. However, looking ahead, the consensus is that the challenge of supply falling below normal expectation into the winter is rapidly approaching.

The Eastern Market Indicator (EMI) increased 4 cents on the week, ending at 1,927 cents. The Au$ compared to the last week was slightly weaker at 0.712 US cents. That put the EMI in US$ terms at 1,373 cents, a small drop of just 3 cents (Table 1).

The market in the West wasn’t able to sustain its level, that’s despite nearly 1,000 bales fewer hitting the market compared to last week. The Western Market Indicator (WMI) fell over the week to end at 2,092 cents, down 13 cents on last weeks close and all MPG’s lower.

Supply was down on previous sales, with 41,757 bales on offer. Growers passed in 9.6% of bales offered, resulting in a clearance to the trade of 37,749 bales. The season to date has seen 908,332 bales offered which is 177,718 bales few than the same period in the 17/18 season.

The dollar value for the week was $78.1 million, for a combined value of $1.82 billion so far this season.

We continue to see a divergence of demand for good quality wool with good measurements, compared to wool that has poorer measurements, generally as a result of the drought. Wool that was presented with low staple strength and high mid breaks again struggled to find buyer support this week. On the other hand, wool exhibiting high quality, high staple strength and low mid breaks were keenly sought.

Crossbreds gave up some the gains that were recognised over the last couple of weeks. 26MPG wool was the most affected, losing 35 to 40 cents while demand for 30-32 MPG saw increases. The cardings indicator fell 15 to 45 cents across eastern and western markets.

The week ahead

Next week the offering is due to be lower again, with 40,629 bales rostered across the three selling centres. The trend is set to continue for week 32 with 37,575 bales rostered, and 38,242 the following week.