Tag: Articles

Steady as she goes for weaner steers but heifers providing opportunity.

The annual Victorian Weaner festival is off and running, with sales at Naracoorte, Mortlake and Yea last week. This week sees the Hamilton and Casterton sales kick off, and unfortunately for sellers, it has been a dry Christmas and New Year period.

For those who are buying, the lack of rain has been good news in terms of prices. Early sales have been around the levels of December. Reports out of Mortlake and Yea last week pegged weaner steers at values around 300-320¢/kg lwt for all steers from 280-450kgs.

The flat ¢/kg prices, regardless of weight, is a common indicator of a tough season, and more importantly, a lack of northern buyer interest. When northern buyers are bidding, lighter cattle tend to be at a strong premium to the heavier weaners.

Your usual market reports will quote how prices perform versus last year. We like to take a longer range view and look at value. Before Christmas we produced Figure 1 and, unusually we must say, little has changed. We haven’t seen an Eastern Young Cattle Indicator (EYCI) yet, but it doesn’t seem likely to change much.

Weaner Steer prices have opened January at a four year low but remain well above historical averages. The Weaner premium to the EYCI at 9.5% is a three year low, but interestingly, still ahead of previous drought impacted sales.

Our expected sell price ranges also haven’t changed, but it’s interesting to compare steers and heifers. Heifers are selling at 240-280¢/kg lwt, which makes them a good buying opportunity, given the discount to steers.

Figure 2 shows gross margins on converting weaner steers and heifers to light MSA Yearlings. Due to the discount narrowing significantly as cattle put on weight, heifer margins are much more attractive. Most steers purchased at weaner sales will be sold as feeders, which are likely to be priced a bit higher at 425kgs, but heifers are offering good returns and probably lower risk.

What does it mean/next week?:

For those able to buy weaners at this time of year, they still look like reasonable buying. They haven’t been this cheap for four years and relative to the EYCI, feeder and finished cattle values they are priced very reasonably.

Heifers are worth consideration for buyers. They are much cheaper in dollars per head, especially for those who are looking to finish cattle and sell to processors. Additionally, if we do see a good rain, breeding stock are going to be in strong demand and there will be plenty of upside in females.

Key Points

  • Since mid-December rain has been largely absent from east coast cattle markets.
  • January weaner sales prices have been relatively steady on December.
  • Steers are selling at a strong premium to heifers, which look like good buying.

Wool outlook 2019

In this series of blog articles, we’re taking a look back at the year that was for agricultural commodities and provide our insight for the year ahead. This instalment highlights 2018’s key movements in the wool market and what to keep your eye on in 2019.

In the calendar year 1.599 million bales were sold, 182,000 fewer than for 2017. This reduction has only become a factor from July 2018 onwards with the drought impact on wool cuts and sheep numbers resulting in 177,000 bales less sold compared to the corresponding previous six-month period in 2017.

There was also a response from wool producers to the softer market and they were prepared to take a bullish stand on prices.

As with all sheep producers, wool growers have now for some time received the benefit of good sheep prices as well as prolonged strong wool prices contributing to strong income flows – this allows wool sellers to hold wool in store if they view prices as soft and likely to recover due to supply constraints.

Despite its early bravery in October, the EMI was unable to sustain the heady 2,000¢ plus levels, eventually slipping 151¢ to finish the calendar year at 1,862¢. In US$ terms it also retreated, dropping 115¢ to 1,346¢.

While November had the EMI briefly below 1,800¢, resistance to meet the market from wool producers produced a recovery which was maintained to the end of the selling year.

Reflecting on the calendar year, the EMI posted a 5.8% increase; however, this mirrored the fall almost exactly in the Au$, the EMI in US$ terms in fact is slightly lower compared to January 2018.

Moves in individual MPG categories were also impacted by the drought on the east coast; the resulting increase in fine wool constrained the finer end of the clip while reducing supply (again predominately drought-related) in medium wool MPG’s assisted the price.

The best performed were the 20 to 23 MPG’s, while the worst included Superfine types (oversupplied), 26 & 28 MPG (lack of supply reflected in reduced demand) and Cardings which have now lost all of the lustre they exhibited on their spectacular run upwards.

What to keep an eye on in 2019

  1. Continuation of supply pressure

It is unlikely that 2019 will see any change to the trend of reduced supply, as large-scale abattoir throughput of mutton sheep points to a continued destocking in drought areas. This combined with the continued dry period negatively impacting on fleece weights will retain supply pressure on the market.

Any rain-induced supply increase will take time to come through (it doesn’t rain grass!), and while growers restocking by holding onto more ewes will occur post good rain, it will also take time for the flock to grow coming of this low sheep number.

  1. Merino prices outperforming the general apparel fibre markets.

All MPG’s 23 & finer are trading above 2,000¢, and with only the Cardings indicator and 30 sitting just below the 90 Percentile level. All other types are trading at levels experienced for less than 10% of the time since 2004.

The 19 MPG at 2,248¢ (end of December) has been below this level for 98.2% of the period measured from 2004, and therefore only 1.8% of this period above the current market level.

Percentiles don’t forecast the future price levels, but they do provide a view of where a price sits from a historic perspective, confirming that this is a very good time for wool prices. That does not mean prices cannot fall, as that depends in part on the general movement of apparel fibres which have been weakening this season.

  1. Short fleeces on the rise

Shearing at shorter intervals continues to be popular. The annual supply of short length Merino combing wool (50-69 mm greasy length) as a proportion of Merino combing fleece volumes from the mid-1990s onwards has taken a sudden increase in recent times.

Farmers are good at responding to price signals and the increase in supply of short length Merino fleece since 2015-2016 fits with a delayed response to the minimal discounts for short length wool which started in 2013. The fashion cycle has turned, as it usually does, and discounts for carding length wool have reverted to pre-2013 levels. Short length Merino fleece discounts will have to contend with both this change in cardings price levels and a continued increase in supply in 2019, which should see discounts widen, especially in mid-2019.

Cattle + Sheep – January 2019

Cattle

In this series of blog articles, we’re taking a look back at the year that was for agricultural commodities and provide our insight for the year ahead. This instalment highlights 2018’s key movements in the cattle market and what to keep your eye on in 2019.

The 2018 season saw tough trading conditions for cattle farmers with a drier than average rainfall pattern impacting across the entire continent from April to September, which saw restocker activity curtailed and prices for store/young cattle ease.

The climate impact put a halt to the herd rebuild with the female slaughter ratio climbing rapidly during the first quarter of 2018 as the dry conditions intensified. Since April 2018 the female slaughter ratio extended beyond levels experienced during the last significant reduction in the cattle herd, during the 2014/15 drought, and with an annual average female slaughter ratio for 2018 above 50% demonstrates that the herd liquidation remains well entrenched.

The 2018 drought saw feed grain prices surge placing pressure on feedlot margins. However, falling feeder values and firm finished grainfed cattle prices allowed enough margin to encourage an increase in cattle on feed to record levels beyond 1.1 million head.

What to keep an eye on in 2019

  1. Climate

Global forecast models continue to suggest an El Nino is likely early in the 2019 season with warmer and drier conditions to persist for much of the country. A late start to the northern monsoon season appears likely which will continue to limit northern producer’s appetite to restock.

If the 2019 season brings another failed autumn break to the south restockers here will remain on the sidelines and will continue to pressure young/store cattle prices. However, a return to more favourable conditions will see restockers encouraged back into the market with a vengeance.

  1. USA moving to herd liquidation

The USA is our main beef competitor into the key Asian markets of Japan and South Korea, and it is also a key export destination for Australian beef, holding the second spot in annual beef export trade volumes behind Japan, so what happens in the USA can influence our cattle markets.

The USA is on the verge of entering a liquidation phase for their cattle herd during the 2019 season, which will mean additional supply will flow into the global market. Demand for beef from Asia remains strong and should be able to soak up some of the increased US production if they move into destocking phase. However, any hiccup in Asian demand could see global beef prices come under pressure and flow through to Australian markets.

  1. China

The swine flu epidemic in China will impact upon their local pork production and Chinese consumers will have to source pork elsewhere. Ongoing trade tensions between the USA and China and tariff increases during the 2018 season will mean that the US pork industry may not be a viable solution to satisfy the gap in Chinese pork supply. This could see demand for meat protein in China transition toward increased consumption of chicken, beef and mutton during the 2019 season. An increased appetite for beef from China will be a positive for Australian beef producers.

Nevertheless, concern remains regarding a looming debt crisis within China. A financial shock in the form of debt induced drop in economic growth could see Chinese wealth and consumption levels take a hit, including the consumption of beef. The contagion of a Chinese debt crisis into Asian neighbouring countries and potentially spreading to the rest of the world could set off a second global financial crisis which would have disastrous consequences for Australia, beyond the beef industry. In terms of boxed beef product China takes around 10% of our export volumes. However, Australia is heavily tied to China across a range of export commodities and they are our top trading partner, so we need to keep a close eye on developments in China during the 2019 season.

Sheep

Dry conditions during the 2018 season saw the sheep offtake ratio climb back above the 12% thresh-hold during the middle of the year. The sheep offtake ratio measures the level of sheep turnoff into meatworks or live export as a proportion of the total flock expressed as a rolling 12- month average. Historically, when the sheep offtake ratio lifts above 12% the flock numbers begin to decline. 2016 was a wet year and this allowed the offtake ratio to fall below 8% in mid-2017. Since then, seasonal conditions have been generally dry, so the sheep offtake has risen. Since July 2018 this rolling measure of offtake has been indicating downward pressure on the sheep flock by rising above 12%.

Despite the reduction in the flock and higher slaughter levels due to the dry conditions sheep and lamb prices along the East coast have managed to maintain historically high levels during the 2018 season due to robust offshore demand, particularly for mutton out of the USA and China. Indeed, from June to December 2018, average monthly exports of Australian mutton to the USA have been 88% above the five-year average level and flows to China have been 70% higher.

What to keep an eye on in 2019

  1. Move to ban live sheep exports

During 2018 live sheep exports came under the microscope and flows ground to a halt during the northern hemisphere summer. The impact of reduced volumes of live sheep exported saw lamb and sheep prices in Western Australia stagnate, failing to follow East coast prices higher and limiting WA sheep producer’s revenues. A third of WA sheep turnoff goes to live export each year so the live trade is a crucial component of the WA sheep and lamb market, helping to underpin prices in the west.

It is an election year in 2019 and the Australian Labour Party, along with several cross-bench senators, have indicated a preference to phase out live sheep exports. If those seeking to ban live sheep exports are successful it is likely just a matter of time before their target will shift toward other aspect of agriculture that they find distasteful. What will be their next target if they achieve success in banning live sheep exports? Banning intensive animal farming practices in the beef feedlot, pork, chicken and egg industries, banning long haul animal transport over land and/or any shipments of live animals overseas – including the sizeable live cattle trade? It’s a slippery slope and may extend to the use of glyphosate and GMO technology in cropping/horticulture or the practice of mulesing in the wool industry.

  1. Reduction in NZ supply

Across the ditch the switch from sheep to cattle continues with Beef and Lamb NZ forecasting further growth in the beef herd at the expense of the sheep/lamb flock during the 2018 season and this is a pattern that isn’t expected to change as we head into 2019. The net result of the contraction in breeding ewes and lambs born will push the total sheep flock in NZ to a new low of 27.3 million head, or a decline of 0.8%.

In global export terms Australia and NZ supply around 70% of the market and in many of Australia’s key international markets NZ is our only real competitor. With NZ supply forecast to continue to decline the demand from offshore will need to find a source country to secure product and Australia is the obvious solution.

  1. Growth in demand from developing world

OECD forecasts for the next five years suggest that demand for sheep meat from Asia is set to average a 2% growth rate, annually. While this doesn’t sound like much the trade into Asia was more than US$2.1 billion last season and 60% of global sheep/lamb exports are destined to head to Asian markets, so it represents a significant chunk.

Asian demand for Australian sheep meat has supported the robust prices sheep producers have enjoyed during the 2018 season and with the NZ sheep industry shrinking there is a fair chance we will see growing Asian demand continue to support the Australian sheep/lamb sector as we progress through 2019.

2019 Outlook

In this series of blog articles, we’re taking a look back at the year that was for agricultural commodities and provide our insight for the year ahead. This instalment highlights 2018’s key movements in grain markets and what to keep your eye on in 2019.

The east coast of Australia has been ravaged by poor growing conditions in 2018. Although the drought has been widely publicised, farms have also been impacted by hail, storms and frost further exacerbating the already poor production potential.

The present forecast for wheat production in the eastern states (SA, VIC, NSW & QLD) is currently estimated at 7.2-7.5mmt. This is the lowest level since the 2006/07 crop and the third lowest in the past twenty years.

In the period since 2006/07, east coast domestic consumption of wheat has increased dramatically which intensified the impact as demand exceeds supply.

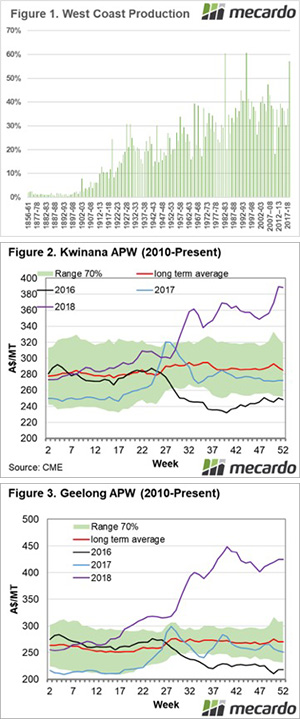
In contrast, Western Australia has taken the mantle of ‘production region of the year’. Although there were fears that frost would badly hamper Western Australia’s ability to produce a crop, however the fears were largely unjustified with production estimated at 9.6-9.9mmt. This marks only the third time in history that the west has produced more than 50% of the nation’s wheat (figure 1).

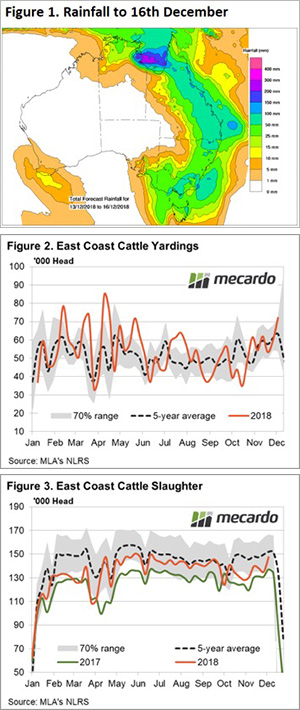
The northern growing region in New South Wales and Queensland suffered through a lack of rainfall during the winter production period. However, during the last three months of the year received above respectable levels of rainfall.

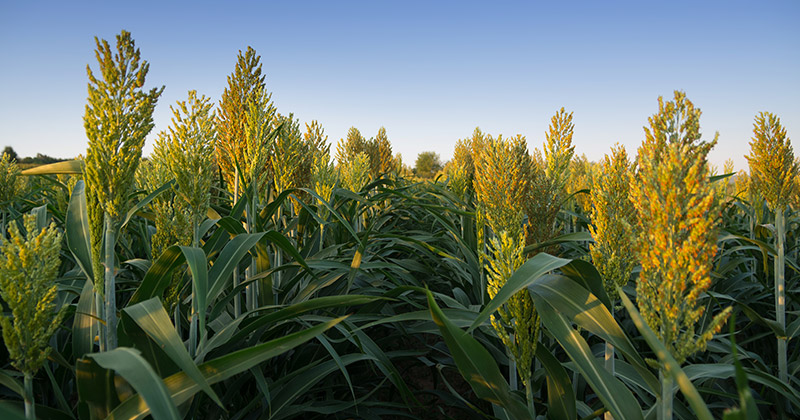
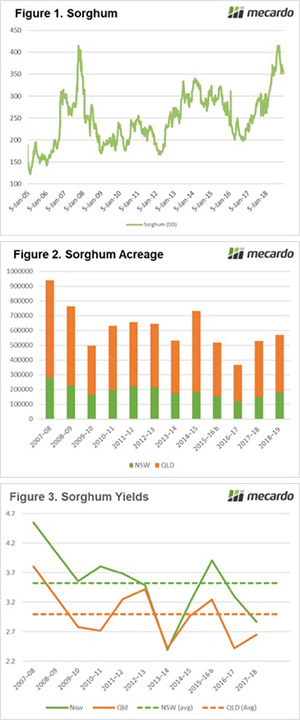
The late rainfall was welcomed by summer croppers, leading to increased planting. This rainfall will provide some surety to the sorghum crop, as there should now be sufficient moisture to get the crop through to a close to average finish.

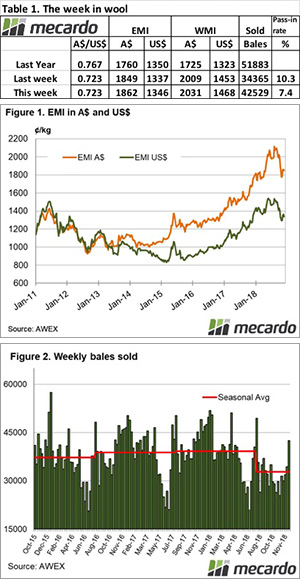
The last quarter of 2018 has seen global markets unchanged, with the average for the quarter down 7¢ per bushel and up A$1/mt. This is largely unsurprising as the last quarter of the year has few surprises to move markets drastically higher or lower. This is due to the majority of the worlds grain harvest being complete, providing an element of clarity.

At a local level the picture is very different, with local pricing diverting from the international market due to drought conditions. This has resulted in wheat pricing in eastern Australia rising to levels not seen since prior to deregulation.

Domestic demand in the eastern states has led to substantial increases in pricing levels; Geelong +A$57 & Port Kembla +A$45. There has been a flow-on effect to WA prices, as transshipments price competitively.

What to keep an eye on in 2019

1 Politics / Global Trade

2018 was a year where trade scuffles broke out between the US and China. This lead to a lot of uncertainty in the market. Initially, the US targeted Chinese imports, however, retaliation by China targeted US agricultural exports.

The biggest impact was felt in soybeans with US exports into China being extremely important for American farmers (and Trump’s support base). The tariffs leave many questions about the capability of China to continue with trade restrictions. Over the past ten years, China has on average imported 62% of the worlds export soybeans. This places a huge strain on China’s ability to find alternate sources, especially considering the US is providing 40% of the world’s exports.

To satisfy the demand into China without paying tariffs, close to 100% of the global trade in soybeans (ex USA) will have to go into China. This has huge have flow-on impacts into other soybean destinations, which will likely change origin to the USA.

US-China negotiations are currently underway and have the potential to colossally impact our economy. A positive outcome will see strong trade flows between China and the US, which will then carry through to the Australian economy due to our reliance on China as a trading partner.

If negotiations end poorly, it is highly likely that the Chinese economy will stall due to the importance of the US economy to their manufactured exports.

2 Weather

The first half of 2019 will see all eyes look to the skies above the northern hemisphere. This is the important period of time where the 2019/20 crop will be made. 2018 was the first year in the past five where production fell below consumption. The world was assisted by strong stocks globally, however, the situation will be tighter this year with the majority of stocks held in China.

China as a nation is a large producer and have huge stockpiles in their inventory, yet it very rarely sees the light of day in the export market. The average exports from China since the turn of the decade have been 917kmt. The largest year of exports since 1960 was in 2007/08 with 2.8mmt. The high domestic price in China (Gov intervention) and historical precedence would point to China being unlikely to come to the aid of the global trade.

When we exclude Chinese stocks from the global situation, the world is sitting on similar levels of stocks to 2008/09 and 2012/13. These were both periods when futures prices rose dramatically and importing countries were hit especially hard with food prices rising, especially in 2008.

This means that major production issues in Europe, the Black Sea or the US could lead to a drastic upward movement in pricing at a global level.

3 Local Conditions

Prices in Australia have risen dramatically due to strong domestic basis. Pricing levels are the highest since the start of the deregulated market. We can see in figure 2 & 3, that these prices are ‘abnormal’ compared to the past ten years.

It is important to understand that these prices are not the ‘new, new’. If we have an average or above year in 2019, the premiums currently in the market will erode very quickly. The market will move back to a pricing point based on the export market and will align with international values.

At present no-one knows how the weather will treat us in the next year. If anyone tells you that they do; they are guessing. It therefore makes sense to investigate the forward market either through physical or futures to commence a structured sales plan for 2019/20.

However, if Australia experiences another drought we will see basis remain at strong levels.
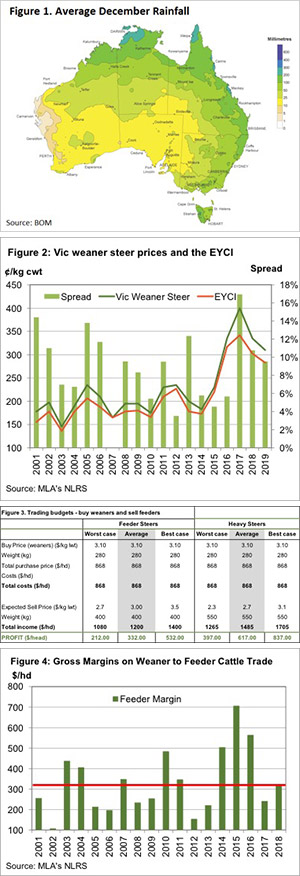
Timely rains for weaner vendors

While wiener vendors at a sausage festival are unlikely to enjoy the heavy rain we saw at the end of last week, weaner vendors in Western Victoria would have rejoiced at the blue, yellow and even purple on the radar.  Prices for weaners have been at four year lows in December, but things may change by January.   

Since last January we’ve seen pasture conditions deteriorate and grain prices rise, neither of which are good for young cattle prices.  Over the last week we’ve seen rain ranging from light to flooding across the east coast.  Despite the rain many key cattle areas in northern NSW and southern Queensland still need another 25-100mm to reach their December average (figure 1).  The drought has not broken yet.

Readers who have been with us for a few years will know we have a couple of measures of value in young cattle markets.  Looking at the absolute price is obviously what vendors are interested in, as it drives their bottom line.  For buyers the values is determined by how much money can be made out of backgrounding or growing out cattle.

The margin in backgrounding fits well with looking value in terms of price of weaners relative to the Eastern Young Cattle Indicator (EYCI).  This spread gives a good idea of restocker demand relative to the young cattle market as a whole, or compared to feeder and processor demand.

Figure 2 shows the average price of weaners at the January sales and the EYCI over the past 18 years.  For 2019 we have estimated a price based on recent store sales, with weaner steers coming in at around 310¢/kg lwt.

If markets are steady in January, a 9.5% weaner steer premium over the EYCI will make them the cheapest weaners in 3 years, and around the average premium.

Returns from backgrouding or growing steers out to Heavy Steers could be described as good to very good based on a conservative price projection.  There was a time when $200 was an acceptable gross margin for backgrounders, and this should be achieved under a worst case scenario.

What does it mean/next week?:

It seems lotfeeders and backgrounders have become quite comfortable with export feeder prices around 300¢/kg lwt.  If weaners sell for 310¢, there is a historically good gross margin in growing them out and selling at 300¢. Figure 4 shows the projected margin (red line) is similar to last year, and right on the 18 year average.

There is plenty of room for upside in the margin, and downside seems limited.  This means weaner price could feasibly be 10% higher, and those with a positive outlook on feeder values could still justify purchasing.  If we see more rain over the coming fortnight this scenario might play out, boosting vendors coffers.

Key Points

  • Recent rain should boost confidence in northern cattle areas, but more needs to come.
  • December weaner steer price seems to be around average value relative to the EYCI and potential gross margins.
  • There is room for weaner prices to rise 10% if more rain falls and demand improves.

Surety in sorghum?

When it rains, it pours. It’s been a dry year, and to end the month the east coast has received a deluge, with many areas receiving more rainfall over the past week, than they had received for the entire year. What does this mean for sorghum?


The rainfall in Queensland and Northern New South Wales was welcomed by summer croppers, with reports of 100-300mm. This rainfall will provide surety to the sorghum crop, as there should now be sufficient moisture to get the crop through to harvest.

The Sorghum price has been very strong in recent months due to a combination of drought and record numbers of cattle on feed. The peak of the year was reached in September, however has fallen 15% since this time (Figure 1). This peak was at similar levels to the previous record held in the drought year of 2007/08. Nonetheless, even with the sharp fall in pricing levels, Sorghum is still priced well above average.

The question now remains, what size will this crop be? The crop production is made up of two factors; acreage & yield.

The December ABARES report forecast the total sorghum crop acreage at 570kmt, shy of the decade average of 615kmt (Figure 2). However, these forecasts were produced before the December rains, and there is still ample time for producers to seed recently moistened paddocks. I would expect acreage to increase in following updates to levels above average.

The bumper sorghum crop in 2007/08 was due to a combination of both yield (figure 3) and acreage. This resulted in a sorghum crop of 3.7mmt. At present we would like to consider that yields will be at or above average for the coming crop due to the recent deluge. This would place the crop at approximately 1.8mmt, based on the ABARES most recent acreage forecasts. However, with acreage likely to be increased above their forecasts, a 2mmt (or above) production year is not unfeasible.

What does it mean/next week?:

The ABARES forecasts are likely to be ratcheted up as both yield and acreage projections are revised.

The bigger the sorghum crop becomes, the larger the impact will be on pricing of both Sorghum and other feed crops. This will be a relief for grain consumers up and down the east coast as the flow on effect reduces input prices.

However, with record cattle on feed and a poor northern winter crop the pricing scenarios are still expected to attractive for producers.

As always it is a good idea to consider selling in small chunks, especially as production becomes more assured. This will help average up pricing if the market does fall.

Key Points

  • The recent rainfall in NNSW and QLD will provide an element of surety to the sorghum crop.
  • The sorghum market has fallen 15% since its peak in September, however remains at historically attractive levels (for producers).
  • The acreage & yield for sorghum will increase due to positive moisture levels.

Live export buyers underpin WA prices.

An expanded cross bench in Federal parliament has placed the ban on live sheep exports back on the agenda. Mecardo thought it an opportune time to reaffirm how important the live sheep trade is for WA farmers, particularly in terms of prices they receive at the sale yard compared to their east coast counterparts for lamb and mutton, when live export buyers are active.

Price spread discounts for WA Trade Lamb and WA Mutton continue to narrow as live export buyers re-enter the market, bringing prices in the West Australian sale yards back in line with East coast prices.

The WA Trade Lamb spread pattern to the Eastern States Trade Lamb Indicator (ESTLI) shows that reduced live export volumes through the winter period saw WA producers earning 230¢ less per kilogram carcass weight than East coast producers – Figure 1. However, since the re-entry of live export buyers into the final quarter of the season the spread discount has narrowed significantly for WA Trade Lamb, sitting just below what is normal for this time in the season at a 22¢ discount to the East coast.

In a similar manner, WA mutton spreads to the ESTLI widened to a discount of 450¢ during late Winter as live export flows of sheep ground to a halt, well below what would be considered normal seasonal variation as identified by the grey shaded 70% range boundary – Figure 2. Increased activity of live exporters into the final quarter of 2018 have seen WA mutton spreads improve moving back into the normal range in recent weeks for the first time since July 2018.

Comparing the average monthly spreads for WA Trade Lamb and WA mutton to monthly live sheep flows we can see a relatively clear deterioration in prices being achieved by WA producers, compared to the East coast markets as live sheep export volumes declined from May through to August – Figure 3.

The relationship between live sheep export volumes and WA price spreads can be further demonstrated by the monthly correlation pattern between spreads and live trade volumes– Figure 4. Higher trade volumes clearly coincide with improved spreads for WA producers with WA mutton demonstrating a slightly stronger correlation coefficient (R2) of 0.6846 compared to WA Trade Lamb with a coefficient of 0.6164.

Our previous two articles on WA lamb and mutton spreads can be found on the links below

What a difference a shipment makes.

A reversal of fortune for WA producers.

What does it mean/next week?

It is pleasing to see price spreads in WA markets normalize in recent weeks with the reintroduction of more sale yard competition in the form of live export buyers. Hopefully, as Federal members deliberate the bill seeking to phase out the live sheep trade they will pause to reflect upon how important the trade is to WA farmers and the industries that support them, such as transport, fodder suppliers, merchandise stores, etc.

If those seeking to ban live sheep exports are successful it is likely just a matter of time before their target will shift toward the live cattle trade. What will be their next target if they achieve success here too? Banning intensive animal farming practices in the beef feedlot, pork, chicken and egg industries, banning long haul animal transport over land and/or any shipments of live animals overseas? It’s a slippery slope and for a member of parliament like Andrew Wilkie, representing the Tasmanian electorate of Denison, I wonder if his support for the banning of live export sheep overseas extends to the shipment of Tasmanian live sheep (and cattle) over the sea to the mainland?

Key points:

  • WA price spreads for Trade Lamb and Mutton have improved significantly since the re-emergence of live export buying competition in the last quarter of 2018.
  • A strong relationship exists between live sheep export trade volumes and WA price spreads to East coast markets for Trade Lamb and Mutton.

How lamb price perspectives can change in a year.

Perspective is a funny thing, especially when it comes to commodity prices. This time last year the Eastern States Trade Lamb Indicator (ESTLI) hit a new record high of 661¢/kg cwt and lamb producers went into Christmas a very happy bunch. This year the price is the same, but the mood is not as buoyant.

Lambs are the same price, but many producers are not seeing great prices, they are counting the missed opportunity of locking in prices at over 100¢ better than current values (Figure 1). Prices over 800¢ are also a recent memory, which adds to the perceived loss.

We know, however, that prices over 600¢ are highly profitable for those lamb businesses which haven’t been in drought, and hence the flow of lambs this November and December has been strong.

There will be some interesting supply and demand functions over the coming month. The rain falling this week should encourage retention of lambs. However, anecdotal reports suggest many Victorian processors are fully booked for January.

We may see light lamb prices rally and finished prices steady, that is unless the dearth of supply in NSW worsens and drags all prices higher.

Sheep is another story.  It’s very hard to see sheep slaughter maintaining current levels with crucial northern sheep regions getting a good downpour. We haven’t seen mutton indicators above 500¢ for any extended period of time since the middle of 2017. Next year could be a record breaker for mutton.

What does it mean/next week?:

There will be some sales early next week, but things will be quiet after that. Many of the lambs which will be killed between now and early January will have already been booked, so sending lambs to the saleyards might be a raffle.

Strong finish to a momentous year.

Exporters would be pleased with the final selling week; a solid finish before the break provides opportunity to write new orders for the re-start in 2019.

The market rose on each of the selling days, providing a sense of stability to an otherwise volatile ride for the wool market in 2018.

The Eastern Market Indicator (EMI) rose, ending the week at 1,862 cents. The Au$ was slightly stronger, closing at 0.723 US cents. That put the EMI in US$ terms at 1,346 cents, a gain of 10 cents (Table 1).

In the west, the Western Market Indicator (WMI) also rose over the week to end at 2031 cents.

Compared to the original roster posted last week, 46,003 of the 48,700 bales intended for sale this week came to the market. The stronger market meant growers only passed in 7.6% of bales offered. This resulted in a clearance to the trade for the week of 42,529 bales (Figure 2). In the auction weeks since the winter recess, 618,752 bales have been cleared to the trade. For the period up to the Christmas break, on average almost 9,500 per week or 181,400 fewer bales have been cleared to the trade compared to the same period last year.

The dollar value for the week was $83.88 million, for a combined value of $1.56 billion so far this season.

The large crossbred offering again resulted in a mixed result, with early sales for the weak softer before improving by the end of the week.

The oddments market again fell between 30 and 50 cents with Fremantle most affected.

The week ahead

This is the last sale for 2018, with a three-week recess.

The strong finish in the auction to 2018 bodes well for next year, although there are mutterings from exporters that buying orders are spasmodic and on a “just – in – time” basis.

Of note is that the forward market activity is pointing to a solid start to 2019 also.

Owen brings an early Xmas gift.

Rainfall to vast areas of the Eastern seaboard at the latter end of the week, compliments of ex-tropical cyclone Owen, has seen up to 50-100 mm recorded across Queensland, NSW and Victoria. The deluge has given a lift to cattle prices and provided some early Christmas cheer to producers.  

The Eastern Young Cattle Indicator (EYCI) managed a 2% gain on the week to close at 526.5¢/kg cwt on the back of the widespread rain event (Figure 1). Young cattle prices in WA held firm at the 550¢ level while declining levels of imported NZ grinding beef in the US has seen the 90CL frozen cow continue to climb toward 580¢/kg CIF.

The rainfall appears to be inspiring those looking for young cattle as the EYCI was one of the few NLRS reported categories in the East to post a price gain this week. East coast Feeder, Trade, Medium and Heavy Steers are all registering falls over the week between a 3-17¢ magnitude on a live weight basis. The increase in young cattle prices comes on the heels of elevated supply across the East coast, as higher cattle yarding and slaughter levels in Queensland in recent weeks has supported throughput and cull volumes across the Eastern seaboard.

The most recent Queensland cattle throughput figures show a 34% jump in saleyard numbers week on week to see over 27,000 head presented. The elevated northern volumes are underpinning a lift in East coast yardings to see numbers reach toward the upper end of the normal seasonal variation at 72,000 head, a 20% gain on the week prior (Figure 2).

East coast slaughter figures were also given a boost from Queensland with week on week numbers showing an 18% rise in slaughter in the sunshine state leading to a 9% gain in slaughter levels across the eastern states. This places weekly East coast slaughter numbers at the highest level recorded in six months at 147,531 head (Figure 3).

Next week

The increase in yardings and slaughter is likely to be the final hurrah for cattle supply this season as saleyards and meat works wind down for the Christmas period. Considering the rainfall levels seen recently, this will also give producers the chance to throw an extra few kilograms onto their cattle as we head into 2019.

Anticipate a robust finish for cattle prices for any remaining sales into next week. The current rainfall should set the cattle market up for a decent start off the blocks as we start the new year. This is the last comment for the season from Mecardo as we close shop until mid-January. Have a safe and merry festive season.