Tag: Articles

Russian rumours relegated.

Russia is in the press a lot at present, in geopolitics its due to accusations of Novichok poisoning. In grain, its rumours of export bans. In this week’s comment, we take a quick look at the chance of an export ban and the decline in the AU$.

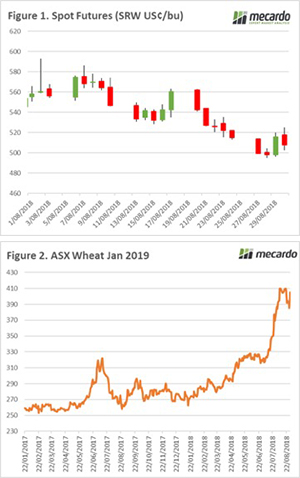
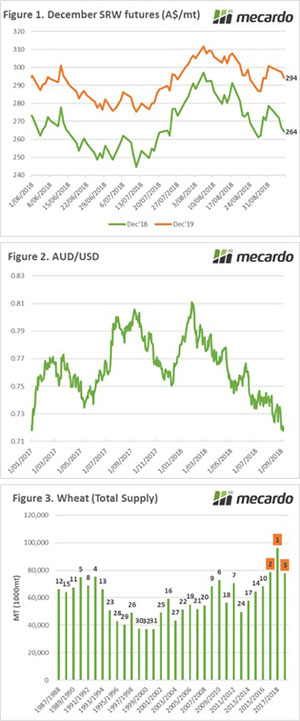
At the end of last week, I highlighted the market concern related to potential export curbs. This had led to an increase in futures values (Figure 1) towards the end of the week. There was a meeting between the Russian government and exporters to discuss export pace. My view was that this would amount to nothing and that was the case.

The lack of any export controls, alongside some very cheap sales and strong export pace, has led to a softening of Chicago futures throughout this week. At present, December 2019 (& ASX Jan 2010) still offers a reasonable hedging option for producers to lock in strong prices for next harvest.

The Australian dollar has assisted by limiting the damage caused by the decline in offshore futures. In the past week, the AU$ has fallen to 20-month lows (Figure 2). The decline is attributed to a combination of concerns, with Asian stocks taking a tumble and the bank interest rate rises out with an RBA decision, this has limited the chance of further rises in the near future.

I was asked by a client this week to elaborate on my view that there wouldn’t be an export curb in Russia. There are several reasons why restrictions are unlikely, however, the main one for me is the combination of beginning stocks and production (total supply). The current year will be ranked 3rd out of 32 for highest available production. There is no need to put in place a ban, as there are sufficient supplies for domestic demand.

*Article written on Thursday evening and may not reflect overnight moves.

What does it mean/next week?:

The next week will see the release of the WASDE and the ABARES crop report. It will be interesting to see where ABARES place the Australian crop. It should not come as a surprise to anyone that downwards in the East and upwards in the West will be the trajectory.

Steady result for wool this week.

After the volatility and interruptions of recent weeks, the wool market settled into a comfortable pattern this week with a seemingly contented balance between supply & demand at current prices.

The AU$ continues to attract focus as it jumps around on a day to day basis.

The Eastern Market Indicator (EMI) fell marginally, losing 2 cents for the week to settle at 2088 cents AU$. With the AU$ again depreciating almost 1 cent over the week, the EMI in US$ terms closed at 1,497 US cents, down 19 cents on the week. (Table 1).

News out of South Africa this week sounded remarkably similar to the local wool situation. The S.A. benchmark indicator climbed to a record 253.82 Rand, helped by a weakening currency.

After peaking at 148 million kilograms in 1966, southern African wool production has declined to about a third of that annually.

The country has about 15 million Merino sheep, with Cape Wools estimating there are as many as 9,000 commercial producers and 50,000 small-scale farmers.

Again, a relatively low pass-in rate at auctions of 4.1% for the week, resulting in a clearance to the trade of 36,927 bales passing in only 1,500 bales. This resulted in an increased dollar value for the week of $94.04 million, with a combined value of $597.0 million so far this season.

In the seven auctions held for the current selling season, the cumulative national total offering is 39,000 bales lower (-12.5%) than for the same period in 2017/18. The clearance to the trade (bales actually sold) is tracking 3,515 bales per week fewer than for the same period (Figure 2).

On the smallest national offering of crossbred wool in three years a mixed result was recorded. The Melbourne sale reported dearer for 30 MPG while cheaper for 28 MPG.

AWEX reported that Merino Cardings had only minor movements for the week and were generally unchanged.

The week ahead

Next week a smaller offering of 34,500 bales is rostered with all centres selling. With currency assisting and supply constrained we can look forward to at least a similar result as this week.

Offshore demand beefs up over August.

The latest export figures from the Department of Agriculture and Water Resources (DAWR) shows beef product exported has strengthened on the July figures with a total of 106,921 tonnes consigned during August, recording the second highest monthly total for the year.

The monthly trend in Australian beef exports for 2018 has been trekking above the seasonal average pattern since April, predominantly due to a surge in demand out of China. During August beef exports continued to climb to see it sit 8% above the five-year average for August (Figure 1).

Traditionally, export volumes tend to decline into late Winter as domestic supply tightens but with slaughter levels running the highest they have been since 2015, as dry conditions make the herd rebuild difficult, export levels have managed to outpace the previous two seasons. Indeed, beef exports for 2018 have been running 13% above 2017 levels and are 9% higher than the volume recorded for the January to August period of 2016.

Notably, in recent months there has been a resurgence in demand for Australian beef out of China and the figures released for August were no exception. Beef consignments to China last month totalled 14,516 tonnes, the highest August figure since 2013 and 38% above the five-year average level for August (Figure 2). The recovery in Chinese demand for our beef product over the last four months is a promising sign, particularly when compared to last season. May through to August has seen Chinese demand for Australian beef exports surge 75% higher than for the same time frame in 2017.

During August, China wasn’t the only export destination to contribute to the higher beef flows. South Korea registered a jump in volume over the month to see it reach the highest monthly total in nearly two years at 18,047 tonnes. The August total for South Korea is sitting 39% above the five-year seasonal trend for August (Figure 3).

What does it mean?  

The beef export figures for August demonstrate the importance of encouraging diversity in export destinations and highlights the value of market access programs organised by industry bodies such as Meat and Livestock Australia. Similarly, free trade negotiations such as those recently secured with Indonesia and our reputation as a good global citizen, such as how we interact with our neighbours in terms of foreign aid, can assist in maintaining market access for our commodities and developing new markets.

During August Australian beef flows to the US (our second largest export destination) ran 16% below average. The dip in US demand was more than offset by the Chinese and South Korean appetite reinforcing the importance of maintaining current trade relations and continuing to expand access to alternative markets.

Key points:

  • Total beef exports for August are running 8% above the five-year average for August.
  • Over the last four months, Chinese demand for Australian beef has lifted to 75% above the levels seen during 2017.
  • Monthly flow of Aussie beef to South Korea has recorded its highest level in nearly two years.

A look at cyclical price peaks in the merino market

Current merino prices are mesmerising. If you doubt this, take a look at prices being paid for stains, cardings and fine crossbred wool which can be used for blending purposes let alone the price levels for the broader merino categories. This article looks at how the current merino cycle fits with past price cycles.

Wool production has changed a lot in the past half century as has the inflation adjusted value of the currency. To accommodate these effects this article uses the average merino micron price series adjusted for inflation. This focusses the price on the core merino price, and brings past price levels up to current price levels in terms of inflation.

Figure 1 shows the deflated average merino micron price from the mid-1960s through to last week, with cyclical peaks (black squares) and cyclical low (red circles) shown. The 1973 and 1988 price cycle peaks stand out in Figure 1. In inflation adjusted terms price was stable from the mid-1970s to the mid-1980s. After the collapse of the Reserve Price Scheme the inflation adjusted price stepped down and traded in a fairly well defined range through to 2016, after which is has traded to higher levels.

Table 1 is a summary of the cyclical peaks shown in Figure 1. It shows the month of peak price, the monthly average price, the size of the price change from the previous cyclical low (in the case of 1973 3.00 means the price rose by 300%) and the time taken in months to go from the previous cyclical low to the cyclical peak. The median change in price from low to peak is 0.72, however there are a few small cycles from the peak RPS decade from the mid-1970s onwards. From 1988 onwards the median cyclical rise is 0.97 (a 97% rise in price or near doubling of price) taking a little of 2 years at 25 months.

So, where does that leave the current price cycle? In price terms the current market (August 2018) has risen by 0.99 from the last cyclical low, so it is around median level for rising cycles from the mid-1980s onwards. By this price rise standard the current cycle is nothing extraordinary, which is an interesting observation.

Strictly speaking the current rising cycle has been running for 71 months but in practical terms the cycle started to lift in late 2014 so the cycle is around 47 months old in Australian dollar terms. Either way the cycle is ancient by the standards of past cycles.

This analysis is designed to provide a base rate or base pattern for a rising price cycle in the merino greasy wool market. Each cycle will vary in the conditions applicable to the cycle. For example the 1973 cycle had a general commodity boom going on, the 2002-3 cycle was a classic post stockpile boom and the 2011 cycle was really a cotton boom. The current cycle has two observable features. Firstly the starting price was relatively high and secondly supply is low and about to be limited further by dry conditions.  At this stage the price rise is what we would expect from a standard cycle.

Key points:

  • The standard rising price cycle for the average merino micron price since the mid-1980s has resulted in prices doubling from the previous cyclical low.
  • These rising price cycles have generally taken around 2 years to play out.
  • This is the base pattern for rising price cycles.
  • In comparison the current cycle has risen by 99% from the previous cycle low, close to median , over nearly 4 years (twice as long as normal).

What does this mean?

Each price cycle will have its own peculiarities, so the median rising price cycle is only a guide to the standard pattern we can expect. At this stage the pattern tells us that price, which is high as it usually is in the upper section of a rising price cycle, has risen by a normal margin, although the time taken has been much longer than normal. It is not a super cycle.

Some relief from the dry and declining prices.

Decent rain for parts of northern NSW and south east Queensland was enough to provide a bit of a price boost across all MLA reported eastern states cattle categories this week. Although, the seasonally low throughput levels and tightening supply are just as likely causes for the price turn around.

Rainfall totals exceeding 50 mm were recorded in parts of northeastern New South Wales and inland southeastern Queensland, bringing some short-term relief to producers in these regions (Figure 1). In response to the rain, cattle prices across the east coast lifted across the board. The Eastern Young Cattle Indicator (EYCI) jumped 23¢ to close at 484¢/kg cwt.

Price gains weren’t limited to young cattle, with the Heavy Steer Indicator up 14¢ to 283¢/kg and medium steers posting a 17¢ rally to 274¢/kg on a live weight basis. Heavy and medium steer prices are once again above levels recorded this time last season (Table 1).

Weekly throughput levels for EYCI eligible cattle has been in decline since early July. As young cattle prices have eased, producers have tightened supply. Indeed, EYCI cattle yardings dropped to their lowest weekly level since April, with average daily throughput for the week hitting 9,496 head and creeping under the normal seasonal range in throughput that is expected for this time of year (Figure 2).

The EYCI yarding sits 30% under the weekly ten-year seasonal average at the moment, which is uncharacteristic for this season. As identified by the 2018 trend in the EYCI yarding, most of this year has been spent trending above average and at the upper boundary of the normal seasonal range. This is reflective of the dry conditions.

Next week

Thankfully there is more rain on the short-term horizon for much of eastern NSW and Victoria and this is likely to continue to lift spirits in areas suffering drought. However, the rainfall forecast for the month of September points to a drier than average situation.

A return to dry conditions in areas with minimal subsoil moisture in the bank could see pressure return to cattle prices in the coming weeks as many regions rely on late Winter/early Spring rains to grow enough pasture to get them over a dry Summer.

Tell the kids, there is a bit of money in rearing lambs

It’s an age old question, and one that is rarely put through a rational economic test.  It’s probably of more interest to school children on farms than farmers.  But with four mismothered lambs currently residing in a small enclosure in our yard, I thought it was time to work it out.  Is it actually worth bottle raising stray lambs?

Any sheep breeder who goes around ewes would have found mismothered lambs.  Most are left in the hope that the mother will come back and pick them up, but we know that even in the best managed twinning mobs this doesn’t always happen.

So the kids want a pet lamb, we buy a bag of milk powder and get going on raising the most expensive lamb on the property.

We paid $58 for a 10kg bag of Maxcare lamb milk replacer.  It is mixed at a ratio of 190g which makes a litre of milk.  Can you believe this comes to $1.11 per litre.  That’s right, powdered lambs milk is more expensive than supermarket milk.  It probably reflects the actual value, rather than being used as a loss leader.

The recommended feeding rates are shown in figure 1, along with the cost per day and week of feeding.  Over the 34 days of milk feeding, lambs should reach a weight of 12-18kgs at a cost of $40.57.  This doesn’t include labour, as all farm kids know their labour is free.

Even 18kgs liveweight is a very light lambs, and is at the lighter end of where lambs are normally weaned.  Lambs will need to be weaned onto high quality pasture or hay and pellets to keep them growing at a reasonable rate.

Pellets and hay at 300g per day for a month will add another $5-10 in costs for another month which would get the lambs to a saleable weight of 18-22kgs.  Not many bottle reared lambs will be sold at this age or weight, but kids might can ask mum and dad for $60-90 per head depending on breed, based on what very light lambs are making on Auctionsplus at the moment.  The best lambs to rear are first cross or maternal ewes.

What does it mean/next week?:

The numbers show that there is a little bit of money to made in bottle rearing lambs if you don’t take labour into account.  Currently as lambs move up the weight scale their value increases strongly, but the rational economist would wonder why you would rear a lamb to 20kgs when you can buy them for $60.  Obviously you can’t just buy one lamb very easily or this cheaply.

You can tell the kids that if they can rear a lamb there is likely to be $10-30 in it for them, but maybe don’t tell them which are the best lambs to rear, or they might start chasing ewes away in first cross or maternal twinning paddock.

Key Points

  • There are a lot of lambs reared on bottles, but it’s a 
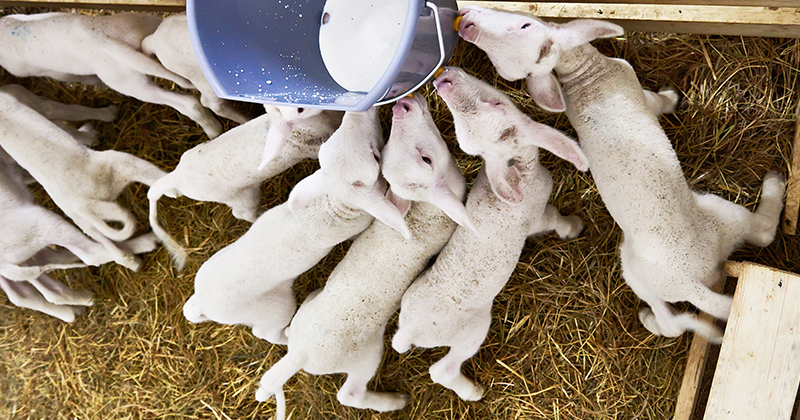
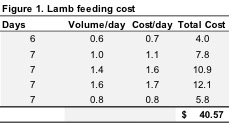
costly exercise coming at around $40 for milk.
  • Further high quality feed is required to get lambs to saleable weights, but there is a small profit in it before labour.
  • Obviously rearing ewes is a more profitable exercise, but mismothered lambs can’t always be chosen.

On tenterhooks.

The drought has put the whole country on tenterhooks. The market is currently at very strong levels, any event has the capacity to cause very big swings in pricing. The weather at present seems to be trying to play its tricks and keep everyone on their toes. 

Chicago futures received some attention this week. At the start of the week, the market was on its eighth downward session in a row. The trend was bucked, albeit correcting itself the next day (Figure 1). The rise is due to continued concerns related to curbs of exports in Russia. At present, it is a case of will they, won’t they.

Russia is always a hard place to make views on, as they tend to play by their own set of rules. My view at present is that they are unlikely to drastically curb exports and at most, we will see an export tariff.

Welcome rains were received in northern NSW and southern QLD last weekend. They were however following the pattern of forecast rainfall events that we have seen throughout the year – much lower than projected. The rainfall for most in these regions is too little, too late. The market fell on the back of the expectations and projections that this event will be supportive of summer planting of sorghum (Figure 2).

The weather, however, had another trick up its sleeve. On Tuesday morning there was a substantial frost event impacting large tracts of the east coast. It is too early to ascertain the extent of any damage; however, many plants are still immature for this point of the year.  If we are lucky, we will have dodged a bullet. But the frost concerns did drive the market back up to sit close to highs of the past month, indicating just how nervous the market is at present.

What does it mean/next week?:

Canadian crop estimates will be released overnight. They have had some poor conditions in many regions and we could see further tightening of global stocks.

Rainfall is due to hit the NSW in the middle of next week, which will hopefully provide some confidence for the summer crop.

Next stop $10?

A little bit of precipitation seemed to go a long way this week. Lamb prices jumped for all east coast categories, with the restocker lamb surprisingly doing the most. Meanwhile, heavy lambs smashed through another milestone, next stop $10.

There was some rain about in northern NSW, but it was in Victoria where restocker prices ramped up significantly. Figure 1 shows the National Restocker Indicator gaining 25% this week to hit a new record of 877¢/kg cwt.

In Victoria, the restocker lamb Indicator gained 33% to break through the 900¢ level and hit 938¢/kg cwt. For a 35kg lwt lamb, this equates to $146/hd with a $5 skin. It was only the start of July when we were getting excited about receiving $146 for 20kg lambs.

Restockers buying these expensive lambs will be okay if they are still getting $200 for 22kg cwt lambs, but looking at the forecast rainfall map (released yesterday), one might be inclined to take the great money for store lambs.

The best chart we have seen this week is Figure 3, with the symmetry of the declining lamb slaughter and rising sheep slaughter. Lamb slaughter was at its lowest full week level for five years and sheep slaughter at its highest level since 2014.

Despite the strong slaughter, mutton values rallied this week. The east coast mutton indicator gained 27¢ to 470¢/kg cwt. Processors aren’t making money on lambs, and while they might not be making money on sheep, they are losing less. Hence the extra demand for sheep.

What does it mean/next week?:

Is the next stop $10?  Well, it’s not impossible as the supply of heavy lambs isn’t going to ramp up any time soon.  At this time of year, it’s hard to see a grower with lambs at 45-50kg lwt worth $200 having the courage to hold them for another six weeks to get them to $300 lambs.

It will be the sheep markets turn to rally next, if and when it does rain there will be a supply squeeze like we haven’t seen since 2013.

It doesn’t rain grass but there might be some upside.

With a little bit of precipitation on the forecast, there is also a bit of positivity around the young cattle price. While it doesn’t rain grass, or demand, a forecast of rain will often halt supply. It seems we have seen the beginning this week.

The talk around the footy sheds last night was around buying cattle before rain tightens supply. This was in South West Victoria where normal winter rain has fallen, so the flush of grass is just around the corner and backgrounders are looking to load up.

It hasn’t rained yet, but the forecasts are promising. As usual, the Bureau of Meteorology (BOM) are the most conservative (Figure 1), but two inches over a large part of Northern NSW would obviously be a start.

We’re not sure if it’s the spectre of rain, but the Eastern Young Cattle Indicator yardings hit a new full week low of just 10,730 head (Figure 2). This was 26% lower than the previous week and 35% lower than this time last year.

It may have been the low prices which pulled back supply, and this was somewhat corrected this week, with a 10.5¢ rise in the Eastern Young Cattle Indicator (EYCI) to 461¢/kg cwt on Thursday (Figure 3).

The weaker Aussie dollar gave export prices a bit of a boost this week. The 90CL Frozen Cow managed to gain 5¢ to hit 580¢/kg swt despite a small decline in US values.

Finished cattle markets have managed to maintain their ground at a solid premium to store cattle prices. Even export feeder cattle are still around 300¢, well above their domestic counterparts at 259¢/kg lwt.

What does it mean/next week?:

There are only so many cattle that can be soaked up by wet parts of Victoria and South East SA, but they will offer some demand for the next month or so if it keeps raining.  The rain in Northern NSW should see some tightening in supply, as growers wait to see if it’s going to be followed up. There should be a little bit of price upside, with the limit likely to be 500¢ for now. More widespread rain would obviously change this.

No questions on leadership of the Ovine nation.

While there is plenty of conjecture in Canberra today as to who is leading the country, at least it’s clear in the livestock market. This week the leader remained the same, Heavy Lambs.  In NSW in particular, where buyers paid over 900¢. 

That’s right, NSW Heavy Lambs this week averaged 910¢/kg cwt! With this price being the average, obviously half the Heavy Lambs in NSW made more than this. The National Heavy Lamb Indicator (Figure 1) is an extraordinary 271¢ higher than this time last year. And the price back then was pretty good too.

The good news is that the weakening Aussie dollar continues to take the sting out of price rises in US and export market terms. Figure 2 shows the ESTLI in US¢ just tipping over 600¢. Still not as high as in 2011, and ‘only’ 27% above the same time last year.

All sheep markets managed to gain ground this week. There is a bit of rain on the forecast, and spring is just around the corner in areas that have had rain. Perhaps demand for restocker lambs is on the improve. This week the east coast restocker lamb rallied 37¢ to 696¢/kg cwt.

Mutton prices also had a marginal improvement, gaining 13¢ in the east, to 443¢. In the west, mutton eased 22¢ to 418¢/kg cwt.

As noted last week, lamb prices in the west are well behind their east coast counterparts. Heavy lambs were up 50¢ and making 726¢/kg cwt. Not 900¢, but a very good price nonetheless.

What does it mean/next week?:

The forecast rainfall won’t see finished lamb supply increase in the short term. If it’s not followed up, it won’t see finished lamb supply increase at all. We are still at least 8 weeks away from sucker lambs from wetter areas hitting the market, so it’s hard to see lamb prices falling far in the short term. The forecast rain and some follow up, would make interesting times for mutton markets. It’s hard to see where the slaughter sheep would come from.