The Chicago wheat market found a bit of strength this week on the back of some less than ideal sowing weather. This sees spring crop going in late, and the spectre of some areas not getting in at all. All this despite another relatively bearish WASDE report.
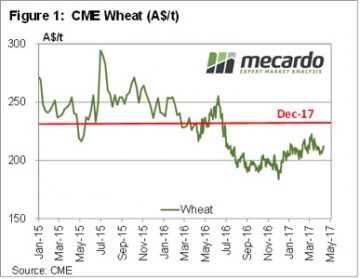 In reality, price movements were small in international markets this week. But after months of tracking sideways at low levels, commentators need something to talk about. CBOT wheat gained 9¢ over a few sessions, to hit a two week high of 432¢/bu. In our terms this puts spot wheat at $212/t (figure 1), and December 17 at $235.
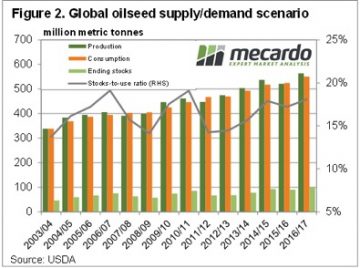
In oilseeds the usually benign April WASDE report threw up a few surprises. The USDA increased Brazilian soybean production by nearly 3mmt, which had the flow on effect of increasing global ending stocks by 5.6% (figure 2). This was well beyond expectations and saw soybeans fall around 10¢, before recovering to actually post a gain for the week.
ICE Canola followed soybeans lower, but changes were marginal with Jan 18 sitting at $481/t. With the AUD/CAD currently at parity it’s not hard to work out what the price is in our terms.
Locally there is little going on in markets. Wheat, barley and canola prices continue to track sideways as growers and buyers continue the standoff. Growers say they need higher prices, buyers know there is heaps of wheat out there which has to be sold at some stage.
The week ahead
 The coming month sees the USDA release their first estimate for the 2017/18 growing season, and this can often bring volatility to the market. There is no doubt US wheat production is going to be lower, but whether this can move the market remains to be seen.
In the short term selling opportunities continue to revolve around export deadlines and delivered markets.

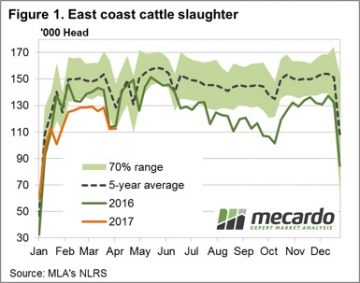 Figure 1 shows the pattern for East coast slaughter, with marginal week on week change as just over 112,000 head processed. The Easter dip in slaughter levels seeing numbers processed that were not too dissimilar to this time last season. Although for most of this season slaughter figures have been trending around 10% below the 2016 levels.
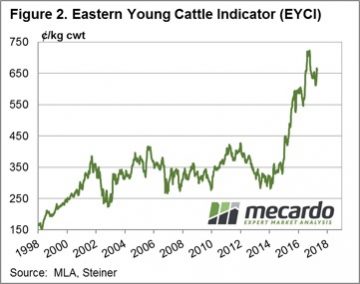 February. The increased yardings resulting in a slightly softer EYCI this week – figure 2.
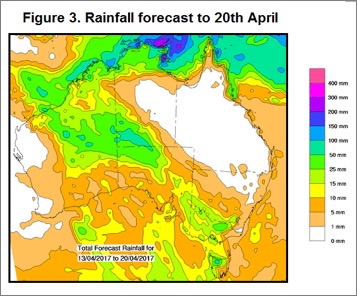
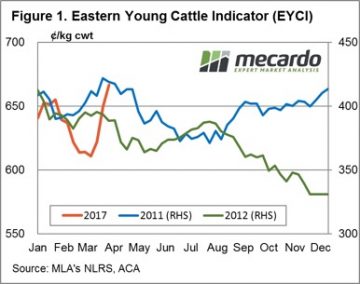 The 2016 season was without doubt the wettest for the nation since the 2010/11 deluge and has been the underlying cause of optimism among restockers, encouraging a rebuild of the herd and supporting young cattle prices to record highs. The recent rains have provided a boost to cattle prices over March – but could the prospect of a dry second quarter in 2017 and 50/50 chance of El Nino developing later in the season signal the beginning of the end for further increasing cattle prices?
 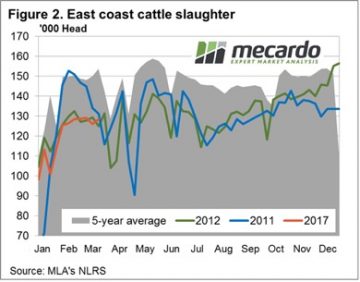 Figures 1 and 2 highlight the price and slaughter patterns comparing the current season to the 2011 and 2012 years. Interestingly, all three seasons have seen price increases for the Eastern Young Cattle Indicator (EYCI) over February/March. While the 2017 rally looks impressive, in percentage terms it is not too dissimilar to the gains recorded during 2011. The EYCI rose 8.2% over February/March 2011 compared to the 8.6% gain seen this year, albeit over a shorter timeframe. In terms of the weekly slaughter pattern there was a bit more volatility in the series during the first half of the year in 2011, although the 2012 pattern has been a reasonably good template for the current season, so far.
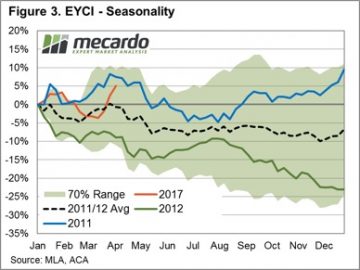 Figure 3 focuses on data from the last two transitions from a wet to dry period and how the percentage price movement of the EYCI responded over the season. Overlaid on the chart is the percentage price patterns for 2017, 2011, 2012, an average of the 2011 and 2012 pattern and a potential seasonal range (calculated from the most recent five seasons that experienced a shift from wet to dry conditions).
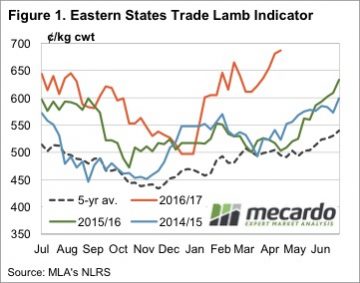 The pace of the rally in the Eastern States Trade Lamb Indicator (ESTLI) slowed this week, but it still went up. The ESTLI finished Wednesday at 687¢/kg cwt (figure 1). While the stronger prices of the last month might have something to do with a demand spike, it’s more likely to be underlying tight supply supporting values.
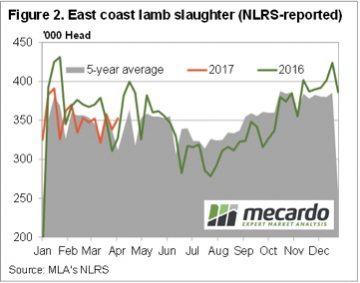 Driving MLA’s figures were results from the February MLA/AWI survey with the key figures being 34% of producers intending to increase flocks, and 59% intending to maintain. Of those intending to increase the flock, 56% are going to retain more replacement ewes. This basically means that of the fewer lambs born in 2016 and 2017, fewer are going to be available for slaughter.
 The EMI closed up a whopping 53 cents in A$ terms at 1512¢ while in Fremantle, the strong finish to the last week continued with a A$0.73 rise, the west closing at 1532 – Fig 1.
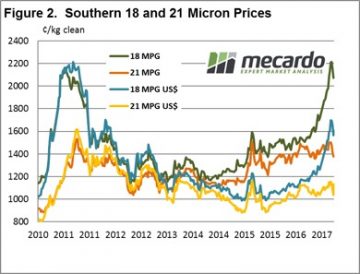 While the market in general benefited, it was the 21 MPG that was the stand out, with the market in Melbourne actually closing at a higher level than before the correction. This is quite remarkable given the increased supply of medium wool coming forward post the drought conditions of the past couple of years. Fig 2.
 Growers are in the driving seat (not often this is the case!!), as the shortage of any buffer stocks means sellers can confidently withdraw wool from the market and have little risk that better prices won’t appear later. When combined with record income from any sheep or lamb sales (
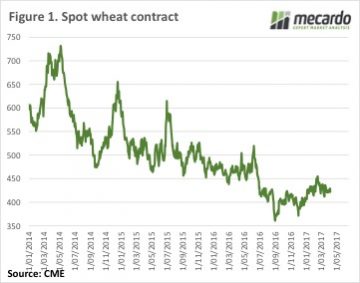 Figure 1 shows a rather boring CBOT wheat chart. Recent swings in prices have been small on an historical scale. As the volume of supplies dampens any attempts at a real price rally.
 There has been intermittent interest in Canola, ASW and Feed Barley in recent weeks, with some growers managing $10-20 premium on published bids when buyers are trying to fill ships. If you’ve got wheat in store it’s worth looking at the shipping stem to see when boats are going and trying your luck with offers on Clear, or by talking to buyers or brokers.
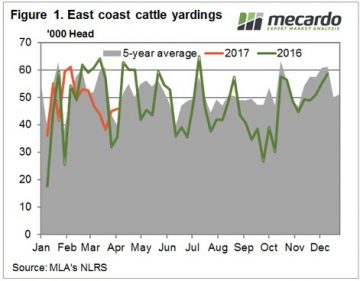 Figure 1 shows that the strong prices failed to draw out more cattle this week, with East Coast cattle yardings increasing just 1,300 head. Cattle yardings were down 28% on the same week last year. In fact almost every week of autumn (except for Easter) 2016 saw yardings above 60,000 head. Over the last 8 weeks cattle yardings haven’t managed to crack 52,000 head.
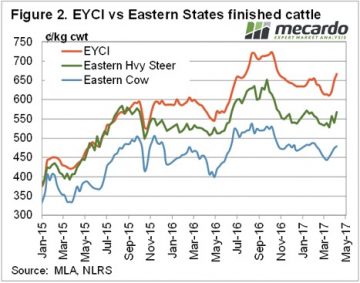 Slaughter cattle prices haven’t managed to hit new 2017 highs yet. Heavy steers bounced back this week, gaining 27¢ on the east coast to sit just below the opening price of 2017, at 568¢/kg cwt. It’s s similar story for Cows, with prices sitting a few cents below the February high.
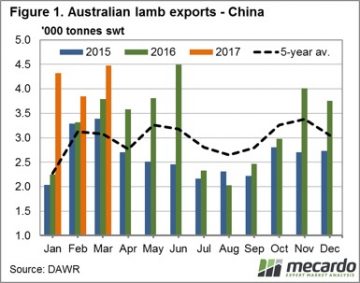 Figure 1 shows the lamb export volumes for 2017 sitting at 49% above the seasonal five year average levels for this quarter. Volumes increased again for March to 4,477 tonnes swt, just shy of the record high in June 2016. This is deviating from the usual March drop that occurs towards the seasonal trough.
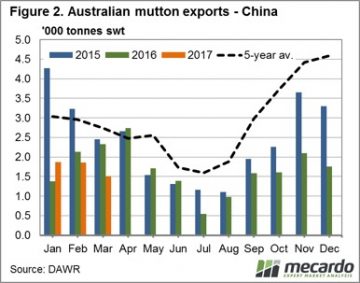 To delve a little deeper into the question, in Figure 3 we have lined up the change in mutton and lamb export volumes from 2015 to 2017 for the season so far. Interestingly, we can see that where mutton volume has dropped off very closely aligns with increases in lamb consignments. Particularly in the months of January and March, there is a near exact shift in volumes from the one sheep meat to the other.
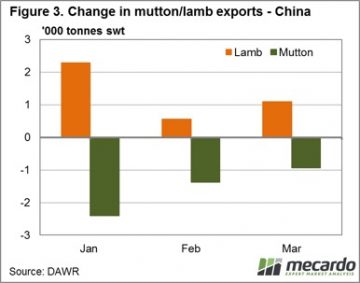 Our current sheep meat export prices may also be playing a part in the changing trade trends within China. Over the last season, the basis of the spread between mutton and lamb has narrowed significantly. In 2015, we had the price of mutton at around 50% of lamb but now we’re seeing the mutton price close in.
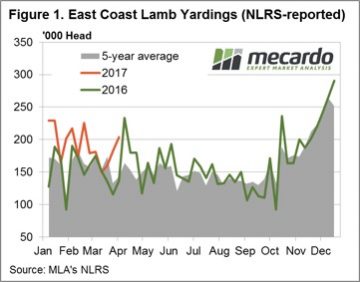 Figure 1. shows the rising trend over the last few weeks in East coast lamb throughput with a further 21,000 head added to yarding numbers this week to reach just short of 204,000 head. Since the recent dip in mid-March, lamb throughput has risen 35.4% in response to the firmer prices on offer at the saleyard.
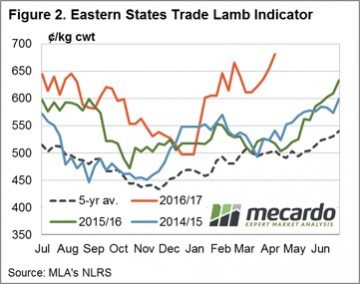 In US$ terms, lamb prices have reached a seasonal peak at 513US¢/kg cwt, this is only the second week it has been above 500US¢ this year – Figure 3. Despite the record local prices for Aussie lamb being received by producers at the moment lamb prices in US terms have been a lot higher. During the 2010/11 season our lamb in US terms reached toward 675US¢/kg cwt so at current levels it is still 24% off its all-time highs.
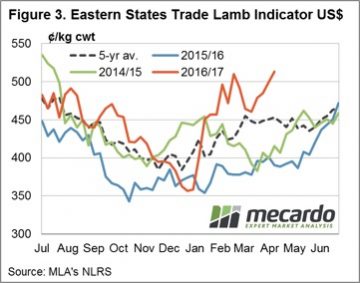

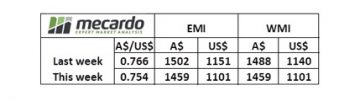
 The EMI closed down 43 cents in A$ terms at 1449¢ and also softer in US$ terms at 1101¢, down 50¢. In Fremantle, the later selling time and strong finish to the week resulted in an indicator less effected with a 29¢ decline in A$. terms for the week – Fig 1.
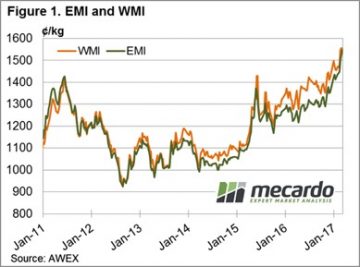 The reversal on Thursday saw the EMI gain 2 cents, however the WMI finished plus 19 cents for the day with reports of a strong finish to the market. Gains were across the Merino combing section, 18 MPG plus 16 and 21 plus 19 cents in Melbourne.
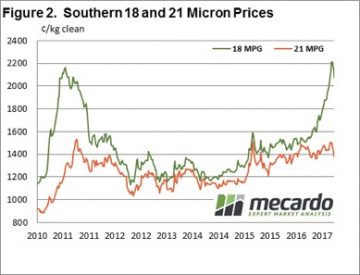 It seems that the falls on Wednesday encouraged exporters to book business and when they returned on Thursday to a reduced offering we saw the resultant rally. This caused the pass-in rate to fall compared to Wednesday, in Fremantle for example the first day a total of 29% was passed-in, however the next day this rate fell to 11.4%. Also impacting was the withdrawal of 20% in reaction to the price falls of the previous day.
 Wool producers are not in any hurry to sell wool if the market retraces like this week, and conversely, they have been keen to sell wool as the market rallied.