Lamb markets seem to have found some sort of level where buyers and sellers are happy, with prices largely steady this week in the east. In the West the lambs were the most expensive in the country.
 Supply was back this week on the east coast, as the public holiday in Victoria impacted numbers. It was in NSW and SA where prices rallied however, with their respective trade lamb indicators gaining 10 and 17¢ to 622 (NSW) and 576¢/kg cwt (SA).
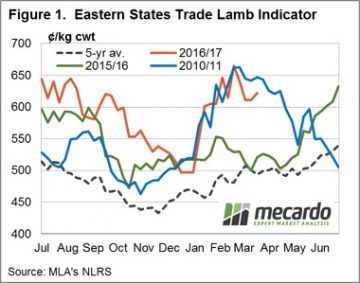
This lifted the Eastern States Trade Lamb Indicator (ESTLI) to 622¢/kg cwt, a three week high. Figure 1 shows that it has deviated slightly from the trend seen in 2011, but still remains very strong. Lamb producers are basically getting $20-25/head more for their lambs this year than last year, which is a pretty good result.
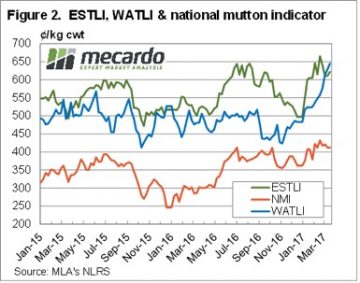 Figure 2 shows the stellar rise of lamb prices in WA, as they move to a premium to the ESTLI for the first time in 15 months. Lamb prices in WA have rallied for four and a half months, and added 200¢, or 44%. This weeks 16¢ rise to 645¢/kg cwt was in spite of a 40% increase in yardings. The lift in yardings might be due to over the hooks quotes running almost 100¢ behind the saleyards.
Mutton values remain strong, with Victoria having an average price of 443¢/kg cwt this week, the highest in the country. In the west mutton is slightly behind, having fallen 46¢ to 438¢/kg cwt this week.
The week ahead
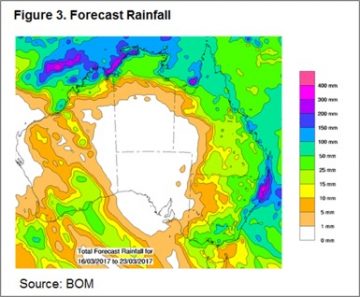 The rain forecast in figure 3 should see solid support for lamb and sheep prices over the coming weeks. It will encourage holding lambs, and sheep as it looks like an autumn break for at least some parts of the country.
Downside is likely limited in the short term, unless there is a backlog of lambs about to hit the market. It’s hard to imagine they’ve been held this long with prices at these levels.
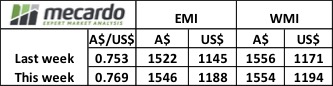 This was a big week for prices on top of a stellar run over the past few sales. The EMI lifted 24 cents, but with a stronger Au$ it was 43 cents higher in US$ terms. To pick a MPG category, 18.5 was quoted +80 cents in Melbourne, +95 cents in Sydney and +59 cents in Fremantle over the week.
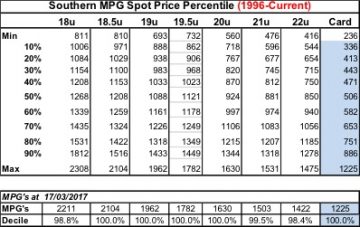 One way to put perspective on where prices are relative to the past is via Percentile Tables. Since 1996 only 18, 21 & 22 MPG have reached higher levels, that is for 100% of the time since 1996 the market has been lower than the current price for all other Merino micron types. No doubt a fitting reward for those that have stayed the course and are now selling wool at very exciting prices.
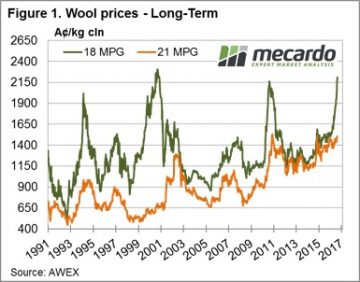 Coupled with the virtual non-existence of any wool stocks either on farm, in brokers stores or in mills; then the outlook has little supply pressures ahead.
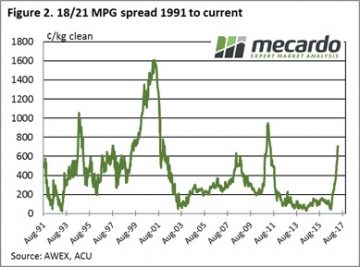 The market in Fremantle closed a little softer for 20.5 and coarser wool so some caution for the 2 day sale next week. A increased offering of 51,200 bales is rostered for next week, over 10,000 up on this week’s clearance of 39,800. In subsequent weeks though, AWEX is forecasting back to 42,000 bales per week.
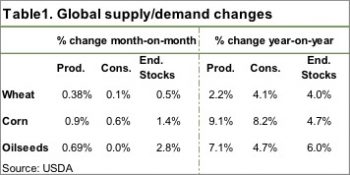 It’s a bit unusual to get large shifts in supply or demand in the WASDE report at this end of the growing season. Most world crops are all but in the bin, with just South American summer crops, corn and soybeans still to be harvested.
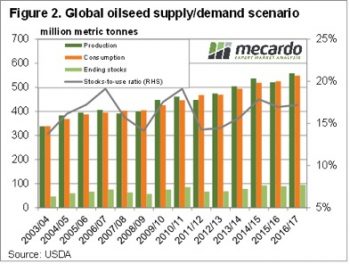 The USDA also lifted Brazilian corn production, increasing 5mmt, and Argentina by 1mmt. This increased world ending stocks by 1.4% thanks to some increases in consumption. This sees the global stocks to use ratio still marginally lower than last year, which should provide some price support.
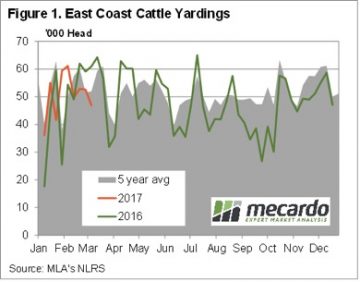 East Coast cattle yardings fell to 6 week lows this week, as lower prices deterred growers from sending cattle to the yards. Figure 1 shows that yardings this week were down 10% for the week, and 23% on the same time last year. With the public holiday next week in Victoria, yardings are likely to be lower again.
 In the West the rain and dearth of supply has the market sitting well above the east coast. While there were no quotes from saleyards, over the hooks yearling cattle remain in the 580-630¢ range.
 All going well, and with the rain landing in the right places at the right time, Australia can be expected to have a bumper canola crop. This is a story likely to be repeated across the rest of the world with the fall in cereal prices.
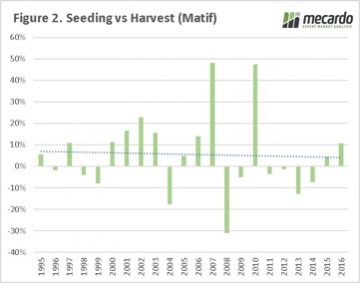 When the Matif contract is examined a different picture emerges. The price during the Australian harvest has been lower only 10 times out of the past 22 seasons, with an average positive change of 5%. However, if we preclude the large changes in 2007 and 2010 the average drops to a meagre 1%.
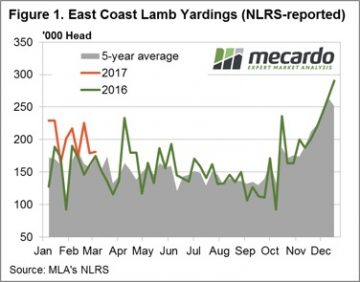 Figure 1 highlights the recent pattern of east coast lamb throughput showing a much more subdued pattern this week, in contrast to the seesaw of the weeks prior. Yarding figures hardly budging with a meagre 1.4% rise to sneak above 181,000 head. The Eastern States Trade Lamb Indicator (ESTLI) responding to the stable throughput settling exactly where is closed this time last week at 611¢/kg cwt. Stability in price the order of the day for most categories of lamb in the national indicators too with 0-1% gains in all classes of lamb, except national restocker lambs, down 3% to $96 per head.
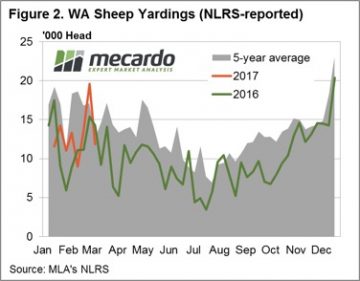 In contrast, WA mutton experiencing a stellar performance with an 11% price rise to 478¢/kg cwt. Spurred on by much softer supply (as shown in figure 2) with WA mutton throughput down 39.6%. The impressive performance this season not limited to mutton in the west with the Western Australian Trade Lamb Indicator (WATLI) continuing to press higher this week to close at 629¢ – figure 3. The tighter season and firm export demand helping support WATLI and WA mutton, 31% and 78% higher than this time last year – respectively.
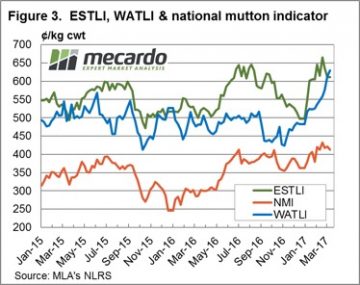 Forecast rainfall between 5-15 mm to much of the sheep bearing regions of the nation next week will give slight relief to the recent dry spell to much of SA and Western Victoria during the last fortnight. This is likely to encourage further price consolidation to continue for the next few weeks for lamb and sheep markets.
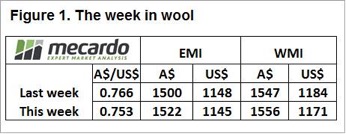 Again, fine wool was the outstanding performer but the underpinning of the medium wool price (21 MPG) is providing support and optimism for the ongoing strong market outlook.
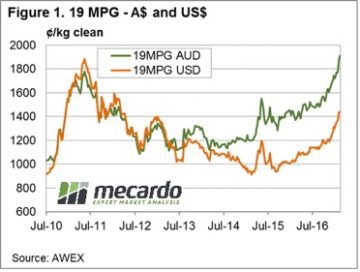 Cardings again were dearer, with all selling centres reporting the Carding indicator comfortably above 1200 cents. The average price for Merino wool is currently boosted by the prices for the lessor lines, all contributing to the best cash flows seem for wool producers for many a year.
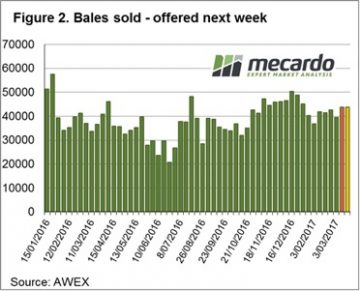 The ongoing strong auction is providing good opportunities in the forward market with
 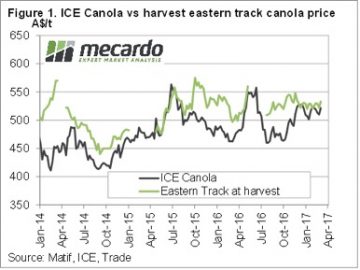 There were rumours this week that there might be some form of ‘Executive Order’ regarding the amount of Ethanol to be produced in the US. Without boring you with the details, the market took the view that Trump was going to increase the demand for ethanol, which means more corn and oilseeds will be required in the US to make it.
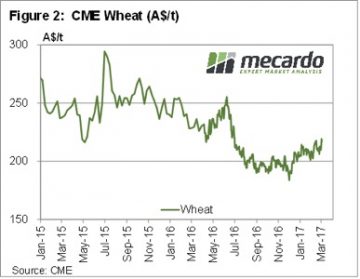 The grim weather outlook released last week might add a bit of strength to grain prices. From now on many grower will take the view that grain in store is a good drought hedge, with prices likely to have a lift if the autumn break is late, or worst case, non-existent.
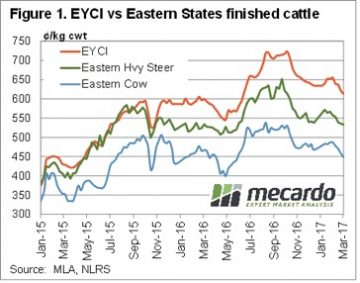 Just as spring price peaks lasted a lot longer in 2016, the autumn price decline appears to be coming early in 2017. While finished cattle prices were relatively steady this week, waning restocker demand appears to be seeing young cattle prices continue easing.
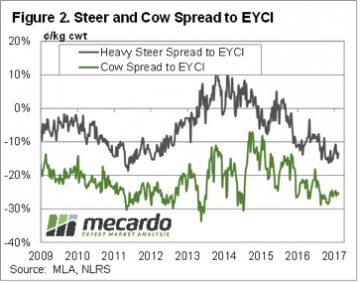 Young cattle still have some way to fall before they are back in line with ‘normal’ discounts to the EYCI. Figure 2 shows that despite the fall in the EYCI, Heavy steers remain at a 15% discount to the EYCI, while Cows are at a 25% discount. Heavy slaughter cattle discounts have narrowed marginally from two and five year lows, but are still a long way from their long term averages.
 Frequent readers of Mecardo will not find it surprising that long-term annual average local cattle prices have a strong correlation to annual average US prices. This analysis takes a look at the US cattle cycle patterns since 1920 to get a perspective of what the normal cycle looks like, where we are currently in the cycle and the usual price activity during herd growth and herd decline.
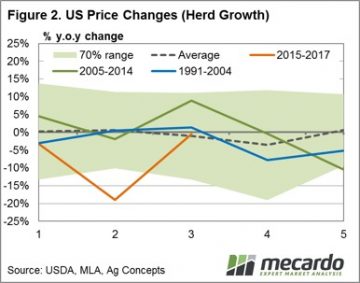 Given the average cycle lasts ten years and the near 50/50 split between herd rebuild to herd decline during the cycle we took a look at annual price percentage changes during the first five years of each cycle (the herd rebuild) and the final five years of each cycle (the herd decline). Figure 2 shows the annual price change pattern for the first five years of the cycle. Interestingly, the data since 1920 demonstrates that the average price gain pattern for the first five years is reasonably smooth and tends toward 0% price movement, yet can fluctuate plus or minus 15% throughout the period. It suggests that there is a reasonably even chance of price gains or falls of a 15% magnitude during the herd rebuild phase of the US cycle – almost like a toss of a coin.
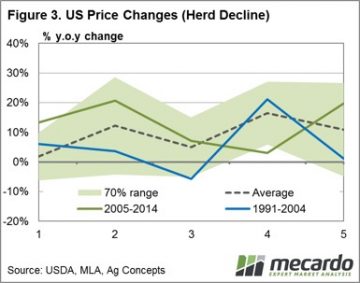 Given where we sit in the current cycle there is the potential for another 2-3 years of further gains to US herd size, albeit at a diminishing rate. Herd decline is expected to start around the end of decade and is likely to see cattle price supported in the US from 2020 onwards.