Tag: Cattle

Cow flush from across the ditch finished

There was a lot of talk back at the end of May around the slaughter of 150,000 New Zealand Dairy Cows, and how it might impact manufacturing beef markets.  With NZ’s seasonal cow slaughter peak now behind us, we take a look at whether how slaughter rates reacted, and if we might expect the impact to last.
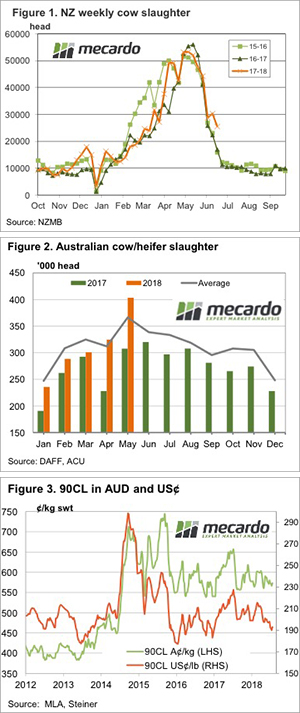
In an effort to wipe out a bacterium that causes a range of infections and diseases in Dairy Cows it was announced at the end of May that 150,000 cow would need to slaughtered from around 200 farms.  While cattle were able to be slaughtered for beef production, it hasn’t seen slaughter increase by as much as might be expected.

For the period from May to late June has seen total NZ cow slaughter up by just 12,575 head, as shown in figure 1.  There have been a few week when NZ cow slaughter has outstripped last year significantly, with the last two reported weeks in June being 43% higher.  Perhaps the cull is keeping slaughter rates stronger for longer.

The culled cows will have to be replaced by farmer to maintain milk production.  The fact that we haven’t seen a large lift in cow slaughter rates might be attributed to cows which might have been culled leading up to winter, are being held to replace the affected cows.

Retaining cows which might have been culled will have an impact on milk production, with poorer performing cows remaining in the herd.  However, for many farmers, keeping or buying older cows will be better than waiting to breed up numbers.

Almost all of New Zealand’s manufacturing beef is exported, so any increase in cow slaughter has an impact on international beef markets.  At its peak in April and May NZ cow slaughter breaks even or outstrips Australian cow slaughter levels.

The latest Australian slaughter numbers from the Bureau of Statistics (ABS) show May was a massive month for female slaughter (figure 2).  Combined with the increase in supply from New Zealand it was good for cattle producers to see 90CL Frozen Cow export prices holding their ground, as shown in figure 3.

What does it mean/next week?:

Figure 3 also shows the 90CL in US terms, and prices have declined 10% for imported.  Obviously the weaker Aussie dollar has helped offset some of the supply driven price declines.  And prices haven’t really fallen very far given the lift in supply in recent months.

Looking forward the end of the cull in New Zealand should see a slight tightening in supply for the autumn flush next year, while it has been well documented that some widespread rainfall will see Australian cow supply tighten significantly.  This points towards some strong potential for upside in manufacturing export prices, which will feed through to cattle markets.

Key Points

  • The NZ Cow cull has had a relatively minor impact on NZ Cow slaughter rates in recent months.
  • The lift in Australian cow slaughter in May coinciding with the NZ peak saw strong supplies on the market.
  • Manufacturing beef prices have held relatively well, and have upside with tighter supply.

Prices hold up well despite increased throughput.

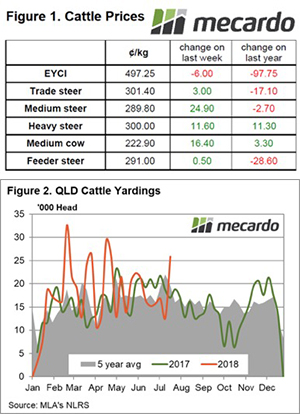
A surge in cattle yardings in Queensland this week encouraged the broader East coast yarding levels higher. However, the increased supply at the sale yard is doing little to dampen buyer interest as all categories of East coast cattle indicators, other than the EYCI, managed a firmer result.

Figure 1 outlines the summary of sale yard price movements this week. The Eastern Young Cattle Indicator was the only one to soften, with a 1.2% decline to slip back under the 500¢ level. Interestingly, Heavy Steers continue to find buyer support, lifting 4% to climb back above the 300¢ barrier on a live weight measure.

A contrast of the yearly price performance of young cattle to the finished product is demonstrating the impact of the dry conditions and the tight supply of heavy stock. This is due to the relatively low herd numbers with the EYCI 16.5% lower than this time last year, while heavy steers remain 4% higher.

Figure 2 shows the surge in cattle numbers presented at sale yards in Queensland this week. A 103% gain on last week’s throughput was recorded. The impact of the higher northern supply is pushing the East coast yarding figures to sit 20% above the seasonal five-year average level for this time of the year to just over 59,000 head.

Western young cattle markets are mirroring the East coast this week to see the WYCI dip 4% to 517¢/kg cwt. In offshore markets, the 90CL frozen cow indicator gained 1.1% to close at 573.2¢/kg CIF (Figure 3). The benchmark US grinding beef import indicator is seemingly unaffected so far by reports of the US-China trade war negatively impacting US pork prices and dragging US cattle prices lower.

What does it mean/next week?

No significant rain forecast for the nation beyond the coastal fringe of WA and Victoria isn’t going to provide much support to young cattle prices in the coming week. Although healthy processor margins being recorded at the moment (according to the Mecardo cut out model highlighted in this week’s analysis) should see them active at the sale yard, buying on any price dips and keeping prices from sliding too far. It seems like consolidation of prices is the likely order of the day for the short term.

Dry times a processors friend

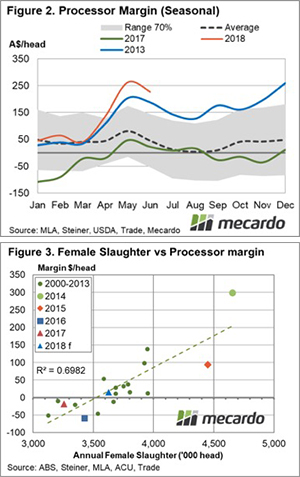
Processor margins have increased dramatically in this last quarter, sitting significantly higher that historical averages. The large margins have been linked with the low rainfall patterns that have occurred this year. Similar conditions were seen 2013 and if that is anything to go on the Mecardo theoretical cut-out model is projecting firmer processor annual margins, like that which were seen during 2013-15.

The Figure 1 animated graphic illustrates the similar rainfall patterns that occurred in 2012-13 and 2017-18, according to the Bureau of Meteorology (BOM). From this we can see that severe dry conditions have occurred all around the eastern end of Australia. 2012-13 saw these severe conditions affect the entire eastern region whilst 2017-18 seems to be greatly affecting the central eastern and south-eastern regions.

With the combination of dry conditions and the “grilling season” underway in the US, it is quite likely the coming quarters should remain strong for processor margins. The January margin in 2018 began at $45/head and throughout the quarter has never exceeded past $65, 2013 values also began low with margins ranging from $28-39. After the initial slow start both 2013 and 2018 margins rose dramatically hitting quarterly highs in May at $203 and $263 respectively.

From figure 2 we can see that the seasonal margins for 2013 and 2018 follow a similar trend, they are both started near the average and dramatically increased April onwards. It is likely that this year with the combination of dry conditions and the increased rate of herd liquidation (as noted in an earlier Mecardo piece with the increase in the female slaughter ratio) that processor margins will remain robust. This trend has occurred before during the cattle turnoff in 2013-2015 where processor margins were significantly higher than average, 2014 being the strongest year with $298.83/head.

The shortage of rainfall has also increased the culling rate of females, as we have now entered a herd liquidation phase. As projected in previously should the following quarter remain dry we could see any even larger increase in the slaughter ratio of females.

N.B – Input data to the Mecardo cutout model, such as beef export prices/cutout values and co-product prices, can be revised post reporting each month. These amendments to can sometimes see the previous monthly margin figures revised to factor in the input revisions.

What does it mean?

Drier conditions result in lower feasibility for grazing leading to increased slaughter rates. From figure 3 we can see that the high female slaughter ratio is correlated to the high margins that processors are currently experiencing.

We can also see that during the 2016-17 processors saw negative margin periods due to wetter conditions generating a herd rebuilding phase. Whilst the 2013-15 periods saw robust profits due to dry conditions creating a herd liquation phase, like what we are experiencing right now. The dry forecast leading into Spring issued by the BOM should continue to support firm processor margins into the second half of this year.

Key points:

  • The rainfall trends for 2013 and 2018 are similar indicating the processing margins will also be similar
  • Monthly data indicates that processor margins will remain robust in the coming quarters
  • Female slaughter data indicates we have entered the herd liquidation phase which often means improved processor margins

It seems 500 is the key level.

Last week it was young cattle prices on the rise, this week its supply. Young cattle yardings jumped higher as growers took the opportunity provided by higher prices to offload more cattle.

We think it was the higher prices, or perhaps the fact that there has been no real follow-up rain to the bit received a fortnight ago, but young cattle flooded into Eastern Young Cattle Indicator (EYCI) saleyards this week.

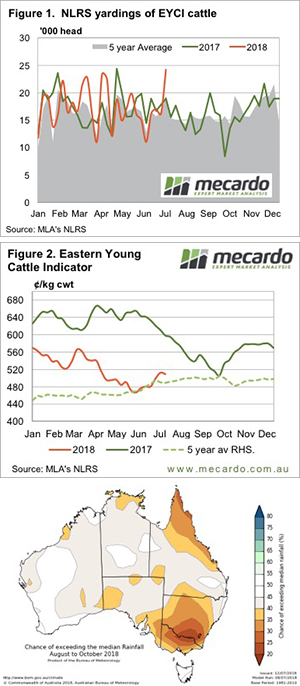
This week’s EYCI yarding hitting a 14 month high and is sitting just 170 head shy of a two and a half year peak (Figure 1).  Roma contributed 34% of EYCI cattle this week with a big yardings, while Dalby chipped in with 7%. NSW was also strong, Dubbo, Gunnedah and Wagga contributed a further 25%, with those five yards making up 66% of the EYCI this week.

Some demand must have shown up as the price of the EYCI didn’t actually fall too far. Compared to last week, the EYCI lost just 3¢ to hold at 509¢/kg cwt on Thursday (Figure 2).

Cow prices managed to rally back above the 200¢/kg lwt in Victoria and NSW, gaining 13 and 16¢ respectively, while Queensland also gained 9¢, but sits at 194¢.

In the West, the Western Young Cattle Indicator extended its premium over its east coast counterpart. The WYCI was up to 543¢/kg cwt, which sits just shy of the MSA Steer Over the Hooks price. This is a sign that the season is ok in the west, contrasting the east where the EYCI is at a discount to trade steer values.

What does it mean/next week?:

The Bureau of Meteorology map shows the latest awful three-month forecast for much of NSW and Victoria. The chances of receiving better than median rainfall over the next three months in minimal. This is obviously bad news for store cattle markets, and it is a real worry for the supply of finished cattle.

Back through 500 for the EYCI but heavies doing better

A bit of precipitation and weakening supply has seen cattle prices continue to rally this week, with the Eastern Young Cattle Indicator (EYCI) breaking back through the important 500¢ mark.  Slaughter cattle prices also improved, as supply goes into its usual winter hibernation.
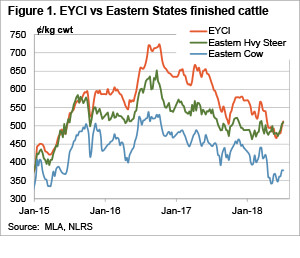
It’s strange to look at the weekly eastern cattle indicators and see the EYCI at a 98¢ discount to this time last year, while the Medium and Heavy Steer Indicators are just 10¢ behind this time last year (figure 1).

While finished cattle are showing some strength, cows have also rallied, but are nowhere near their prices of last year, at an 80¢ discount. The bit of rain which has been seen in some parts of southern Queensland and northern NSW needs some serious follow up before we see the supply of cows weaken.

It was Queensland where the main price movements were this week.  The Queensland Heavy Steer gained 48¢ to hit 516¢/kg cwt.  This is still well behind NSW (562¢) and Victoria (533¢) where the tight finished cattle supply is hitting hardest.

Given the lack of grass available in NSW and Queensland there is unlikely to be a lot of finished grassfed cattle around for some time.  This might see prices continue to rally, or at least maintain strength, and also support grainfed prices.

The Western Young Cattle Indicator (WYCI) is still outstripping its east coast counterpart, gaining 10¢ this week to move back to 526¢/kg cwt.

Export prices remain solid, with the 90CL sticking at 571¢/kg swt, while the Grassfed fullset to Japan is at the same price as last year.  Little wonder Heavy Grassfed Steer prices remain strong.

What does it mean/next week?:

There’s not a lot of rain on the forecast, so the dry continues.  It’s hard to see the young cattle rally continuing under these conditions.  Strength should remain for anything heavy enough to feed or finished enough to kill, but the little light cattle might start to struggle again.

Export demand soaking up extra supply

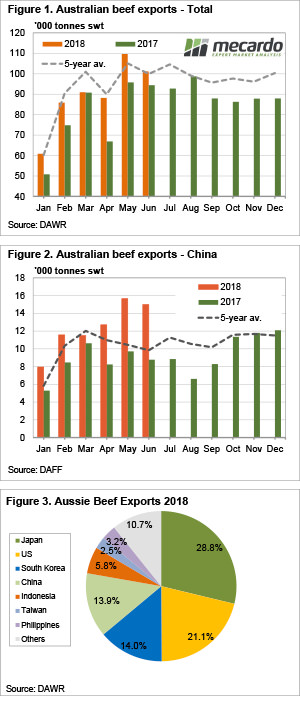
Cattle slaughter remained relatively strong in June, and this flowed through to export, which, while being down on May were still at their second highest level for the year. China maintained it’s very strong demand for frozen beef, helping keep export prices elevated despite cheaper cattle prices.
Australian beef exports fell 8% in June, but this was from a two and a half year high. As such, June was the second highest beef export month since the end of 2015. At just over 101,000 tonnes, beef exports were just above the five-year average and 7% higher than last June.

It appears that in manufacturing beef, China and the US are competing strongly. Figure 2 shows that exports to China only fell 4% and managed to post a 71% increase on June 2017. Exports to the US were down 3% in May and 10% on June last year. Increasing US beef production and increasing Chinese demand has seen less beef heading to our second biggest market.

Indonesia is another market competing for lower value frozen beef. Beef exports to Indonesia in June were up 63% on last year while being down 17% on May at 6,672 tonnes. Indonesia is now our fifth largest export market.

In higher value beef export markets Japan continues to dominate. Chilled beef exports to Japan totalled 10,839 tonnes, accounting for 45% of total chilled beef. Chilled beef exports to the US continue to rise, with demand for grassfed beef continuing to improve. The US took 23% of our chilled beef exports, while South Korea accounted for 11%.

Traditionally Japan, the US and South Korea would have accounted for 90% of total beef exports, but market diversification has seen smaller markets taking more beef. Figure 3 shows the range of markets we have exported to in 2018, which is good for competition, demand and prices.

What does it mean/next week?:

There is still plenty of demand for Aussie beef, with the weaker Aussie dollar obviously helping us compete with US beef in higher value markets and making our beef cheaper in the US.  The solid export market is helping support cattle prices in the face of dry weather and the strongest supply in three years.

Demand suggests plenty of cattle upside

The cattle market appears to have found a base in recent weeks, and this is due to supply finding a top, and good processor margins seeing cattle being soaked up.  So where to from here?  This week we take a look at demand, and where the market will head when supply tightens up again.
The fact that beef is sold into a competitive international market means that supply and price have a variable relationship. As opposed to lamb, where shifts in supply are generally the driver of price, cattle markets are more subject to things beyond producer control.  Factors like beef production in competing nations, shifts in demand and exchange rates tend to be the main driver of cattle prices.

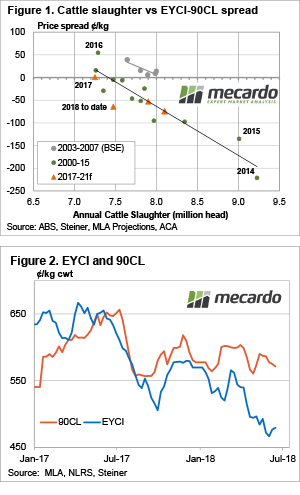
So a traditional supply and demand curve doesn’t exist for Australian cattle prices. However, a couple of years ago we discovered a supply and demand relationship which does tend to ring fairly true. If we take the 90CL Frozen Cow export price and deduct the Eastern Young Cattle Indicator (EYCI) it gives us a measure of how local prices are faring relative to the international market.

In Figure 1, we have plotted the annual cattle supply against the 90CL/EYCI spread. It shows that the higher supply is on the X axis, the lower the spread is on the Y axis, and vice versa. The extraordinary season in 2016 saw the EYCI rise above the trend line, with restocker demand holding the spread at more like the levels seen during the years when BSE locked US beef out of Japan and Korea.

The weaker EYCI relative to the 90CL during the second half of 2017 saw the 90CL/EYCI spread at close to zero, slightly below the 16¢ that the trendline predicts with the annual slaughter of 7.16 million head.

Figure 1 also shows Meat and Livestock Australia’s projection for cattle slaughter in 2018, along with the 90CL/EYCI spread for the year to date. Cattle slaughter is running a bit ahead of MLA’s schedule, which accounts for some of the larger than expected spread, but weak restocker demand is also depressing the EYCI.

What does it mean/next week?:

While the Bureau of Meteorology increased the chance of El Nino to 50%, it still leaves at least a 50% chance of getting rain in the spring, or early summer. With rain, comes restocker demand, and weakening supply of store cattle and higher prices. The question of how much higher is limited by export prices, but under current values, a return to zero spread would see the EYCI gain 90¢ (Figure 2).

With the herd rebuild being put on hold, and maybe some more liquidation taking place, total cattle slaughter is likely to fall, meaning the EYCI could again move to a premium to the 90CL and take prices back towards 600¢.

No World Cup dive for our cattle prices

It does seem fashionable to take an easy dive now with the World Cup in full flight. Alas, the Socceroos are out and our ovine market commentator was right, I was up bleary-eyed mid-week to see the crashing exit. But at least there is something to cheer about when it comes to cattle prices this week.
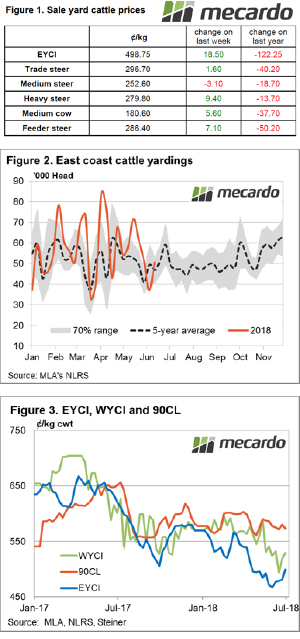
The Eastern Young Cattle Indicator (EYCI) is mirroring Messi’s last-minute breakthrough against Nigeria to see a solid 4% gain on the week to close just shy of $5 a kilo cwt. As noted in our beef comment from last week some rain in NSW and Queensland has helped the EYCI to lift. In addition, our analysis earlier in the month on improving processor margins suggested this could help see the EYCI recover toward the 500¢ level mid-Winter.

In other sale yard cattle categories prices were also improved this week with gains noted between 0.5% to 3.5%. Medium Steers were the only type to show some red ink (indeed as red faced as the Germans after their shock exit), closing at 252.6¢/kg lwt – Figure 1.

East coast throughput rebounded 37% this week to see it sitting comfortably within the normal seasonal range for this time of the year and slightly above the five-year average – Figure 2. NSW was the only state to record throughput levels above the seasonal average this week, suggesting the dry spell still having an impact there on sale yard cattle numbers.

In the West, cattle yardings have eased 16% and this has given the Western Young Cattle Indicator a bit of a lift too, posting a 2.3% gain to close at 529.5¢/kg cwt. In offshore markets the 90CL down a mere 1.3% and still sitting at good levels at 572.7¢/kg CIF – Figure 3.

What does it mean/next week?

Light rain forecast for Victorian and some central Queensland regions, along with some good falls for WA, should keep the cattle markets ticking along nicely. And with an early prediction for the World Cup final expect to see Belgium take on England, with the English taking the cup after a 52-year hiatus. You heard it here first…

Restocker demand down but a base might have been found.

With drought conditions in much of New South Wales and parts of Queensland, it has been interesting to see the Eastern Young Cattle Indicator (EYCI) find somewhat of a base in the last couple of weeks. With further dry weather forecast, we attempt to ascertain whether this is a support that’ll track along for a while, or whether it’ll take another leg lower.

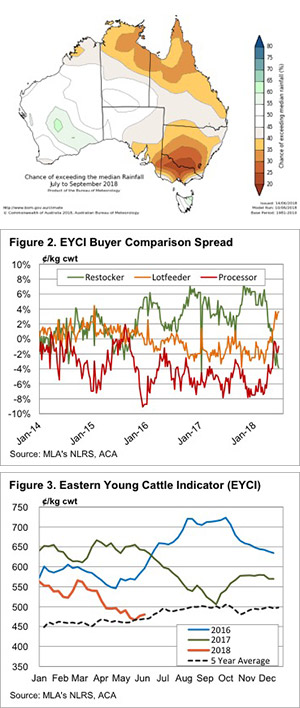
It was only a fortnight ago the Bureau of Meteorology (BOM) released a depressing looking three-month rainfall outlook formuch of the east coast. If you thought it couldn’t get any worse, think again, with the mid-month update released last Thursday trumping the previous one for depressing brown areas. Figure 1 shows most of NSW and Victoria have a low chance of exceeding median rainfall from July to September.

The latest three-month outlook comes just as the EYCI is starting to find a base. Having fallen consistently for two months, the EYCI hit 466¢/kg cwt a fortnight ago and has since rallied 14¢ to 488¢. It’s worth noting that prices remain very good considering the conditions. The last time we had a dry spell like this, the EYCI was much closer to 300¢ than 500¢.

Figure 2 shows weakening restocker demand has been assisting the EYCI lower. Restockers have gone from paying a 6% premium to the EYCI itself to a 4% discount. The restocker spread has never been this low for very long. During the height of the 2013-14 drought, restockers were getting their cattle for a 2% discount.

Part of the reason the restocker discount is larger than in 2013-14 is that lotfeeders are still paying strong prices. In EYCI saleyards, lotfeeders are paying a 3.5% premium to the EYCI despite grain prices at close to 10-year highs. This tells us that there are some good prices for finished cattle being offered down the track.

While it’s a little counter-intuitive, the dry weather looks to be raising serious concerns around the late winter and spring finished cattle supply. Additionally, the herd rebuild didn’t gain enough momentum to see processors swamped with unfinished cattle and cows. The supply and demand of slaughter cattle looks to have found an equilibrium of sorts.

What does it mean/next week?:

We know it will take rain for the EYCI to move higher, but based on export prices and supply it looks like prices might have found a base for now, and will track sideways for a while. If the winter and early spring remain exceptionally dry, supply could increase and push price lower, but for now, it looks like things might hold, with the five-year average (Figure 3) seemingly the most obvious path.

Key Points

  • The latest BOM forecast has pegged the probability of better than median rainfall is low.
  • Historically restocker demand hasn’t been weaker, processor and feeder demand is still strong.
  • Despite the dry forecast, young cattle prices might find support at current levels.

Cow prices responding to margins.

Cattle markets continue to defy the dry weather, remaining steady for another week despite supply picking up. In general, prices were steady but there are signs of things turning around in the short term thanks to weakening supply.

With a bit of rain about through Victoria and parts of southern NSW and SA over the last 10 days, some producers look like they are taking a wait and see approach, and pulling back supply. It shouldn’t be too hard for supply to weaken either, as there are still not that many cattle out there.

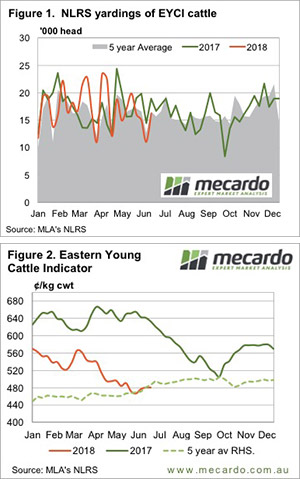
Figure 1 shows the Eastern Young Cattle Indicator (EYCI) yardings rising after the Queen’s Birthday holiday, but remained below last year’s levels (Figure 1). Yesterday at Dubbo, one of the driest areas, 2240 head of young cattle sold for 525¢/kg cwt. This was 45¢ above the EYCI itself and shows that there is still some demand out there for young cattle. The EYCI was basically steady this week (Figure 2) as the market continues to take stock.

Amongst a lot of largely steady prices this week, the Cow indicators in Victoria, Queensland and NSW stood out. All three Medium Cow indicators gained ground. NSW the least, up 17¢, and Victoria the most, up 48¢. Matt’s article from earlier in the week outlines pretty clearly why Cow prices are up, processors can afford to bid up given current margins. Saleyard Cow prices merely returned to where over the hooks values are.

In WA prices rebounded back above 500¢ to make the WA average price the most expensive in the country. The Western Young Cattle Indicator sits at 517¢, still 80¢ below the same time last year.

The week ahead

There is some reasonable rain forecast for South East Queensland over the coming week. This should see further support arrive for cattle prices and young cattle in particular. The Roma Store sale averaged 465¢/kg cwt this week, and it was the biggest contributor to the EYCI. Rain in that area should see the EYCI rally.