Last August Mecardo reviewed the supply of short wool in the clip and drew the conclusion that overall the proportion, while varying, did not have a definable trend. This time around we look at much shorter term data and drill down by micron category to see what changes are present in the current market.
 In the earlier analysis (Is there more short wool in the clip August 2016) the focus was on the overall proportion of short wool within the Australian merino clip. The current market has a raft of changes in supply going on, which vary markedly between micron categories. This is a function of different seasonal conditions between regions, with wool from the various regions having quite different characteristics. The article from last week (Where is all the broad merino wool coming from) was based on this principle.
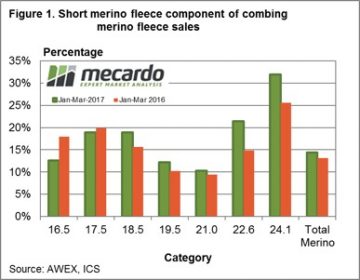
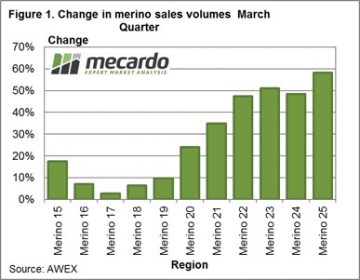
Figure 1 shows the proportion of short (50 to 69 mm staple length) merino fleece wool sold during the March quarter this year and in 2016. The volumes are broken up by micron category. These categories are set roughly to match the old Chinese wool types, with a total merino fleece proportion shown on the right hand side. Generally the proportion of short fleece wool early in the calendar years has been around 15-20% for 17.5-18.5 micron, 10% for 19.5-21 micron and higher for the broader merino categories. Overall around 13-14% of merino fleece sold is in the 50-69 mm staple length category.
 Figure 2 is where the data becomes interesting. This shows the year on year change in volume for 50-69 mm length merino fleece wool by the micron ranges, for the January to March period. The changes vary widely. There has been a lot broader short staple fleece wool sold in 2017. This fits with the analysis from last week of the broader merino micron volumes. It points to plenty of downward pressure developing in the market as it struggles to absorb increases in the range of 40% to 100% of broad short staple fleece wool. This explains some of the low quotes coming out of the market for wool in these categories.
Once again we are reminded that the analysis of wool supply needs to drill down to levels at which the supply chain operates. Mills do not source merino wool as such, but merino wool of certain characteristics. When the supply of wool of the characteristics changes relative prices in the market will adjust. The conclusion in August that there was no discernible trend in the supply of short staple merino wool, while correct, neglected to look at changes at a lower level. Figure 3 shows a similar analysis to Figure 1, except it is a snapshot from a decade earlier. The proportions of short staple wool are markedly different between the micron categories. They are a lot higher for fine wool and much lower for broad merino wool.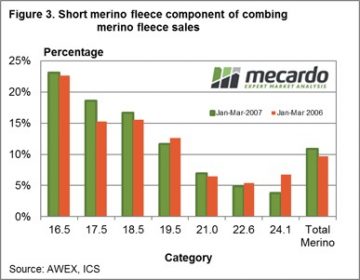
Key points:
- The proportion of short staple merino fleece in the clip varies between micron categories.
- The proportion is higher for broad merino categories.
- Broad merino short staple wool supplies are up by 40-100% in 2017 so far.
- A decade ago fine merino categories had the highest proportion of short staple fleece.
What does this mean?
The supply of short staple fleece has increased in broad merino wool during the past decade, and has picked up markedly compared to year ago levels. Price relativities will react to the increased supply by discounting the shorter staple wool, which may have implications for farmers planning shearing at shorter staple lengths.
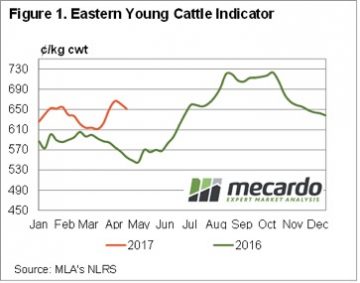
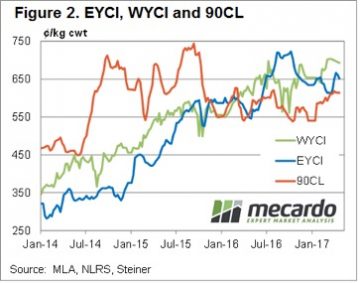 Figure 2 also shows the 90CL export beef indicator holding onto a price around 20 month highs. This week the 90CL sits at 614¢/kg swt, supported by tight supply from Australia and New Zealand.
 Recent sales volumes and AWTA data have shown strong increases in the supply of broad merino wool in Australia. While the supply was expected to pick up on the back of improved seasonal conditions in 2016, the rise has been faster than anticipated. This article takes a look at where the wool is coming from.
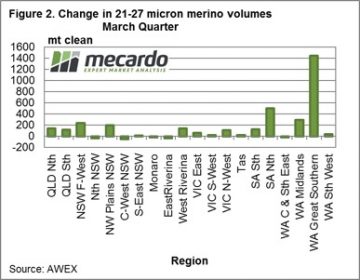 The question is where is the extra broad merino wool coming from? As Mecardo showed in an article a couple of weeks ago (
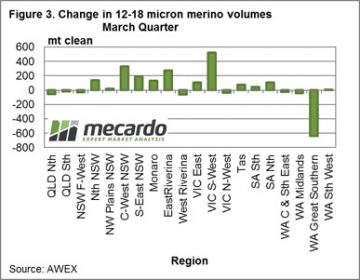 As a check on this change, Figure 3 shows the year on year change in the volume of 12-18 micron wool sold by each region in the March quarter. The big swing to broader wool in the Great Southern region is matched by a big drop in 12-18 micron volumes. Notice the higher rainfall NSW regions have had increased fine wool sales this year, along with south-west Victoria (which was coming off a drought induced low base). The expected decrease in supply of fine wool from NSW has not eventuated, except for the western Riverina. Good seasonal conditions in 2017 (which has started in the Monaro) will be required to pull the micron broader in the regions, in order to lower the supply of fine merino wool.
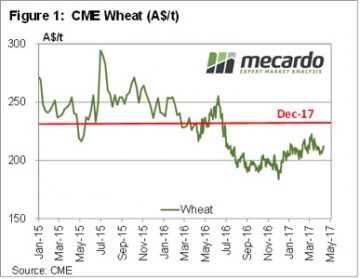 In reality, price movements were small in international markets this week. But after months of tracking sideways at low levels, commentators need something to talk about. CBOT wheat gained 9¢ over a few sessions, to hit a two week high of 432¢/bu. In our terms this puts spot wheat at $212/t (figure 1), and December 17 at $235.
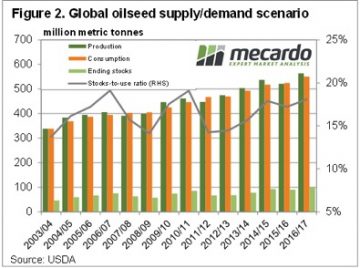 The coming month sees the USDA release their first estimate for the 2017/18 growing season, and this can often bring volatility to the market. There is no doubt US wheat production is going to be lower, but whether this can move the market remains to be seen.
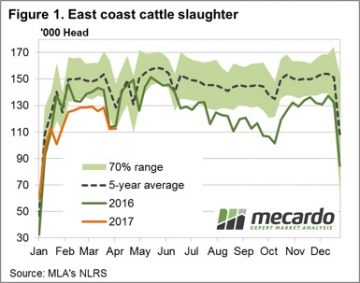 Figure 1 shows the pattern for East coast slaughter, with marginal week on week change as just over 112,000 head processed. The Easter dip in slaughter levels seeing numbers processed that were not too dissimilar to this time last season. Although for most of this season slaughter figures have been trending around 10% below the 2016 levels.
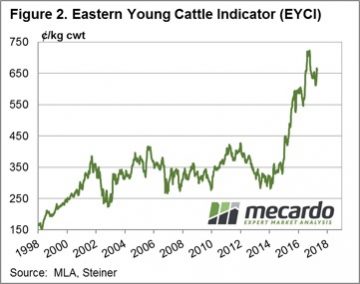 February. The increased yardings resulting in a slightly softer EYCI this week – figure 2.
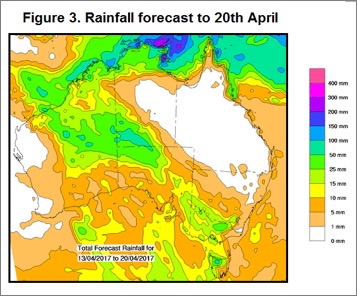
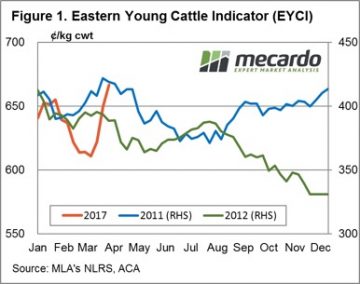 The 2016 season was without doubt the wettest for the nation since the 2010/11 deluge and has been the underlying cause of optimism among restockers, encouraging a rebuild of the herd and supporting young cattle prices to record highs. The recent rains have provided a boost to cattle prices over March – but could the prospect of a dry second quarter in 2017 and 50/50 chance of El Nino developing later in the season signal the beginning of the end for further increasing cattle prices?
 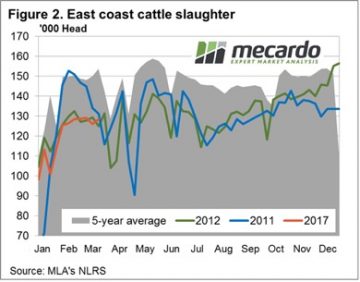 Figures 1 and 2 highlight the price and slaughter patterns comparing the current season to the 2011 and 2012 years. Interestingly, all three seasons have seen price increases for the Eastern Young Cattle Indicator (EYCI) over February/March. While the 2017 rally looks impressive, in percentage terms it is not too dissimilar to the gains recorded during 2011. The EYCI rose 8.2% over February/March 2011 compared to the 8.6% gain seen this year, albeit over a shorter timeframe. In terms of the weekly slaughter pattern there was a bit more volatility in the series during the first half of the year in 2011, although the 2012 pattern has been a reasonably good template for the current season, so far.
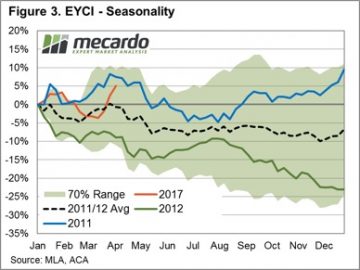 Figure 3 focuses on data from the last two transitions from a wet to dry period and how the percentage price movement of the EYCI responded over the season. Overlaid on the chart is the percentage price patterns for 2017, 2011, 2012, an average of the 2011 and 2012 pattern and a potential seasonal range (calculated from the most recent five seasons that experienced a shift from wet to dry conditions).
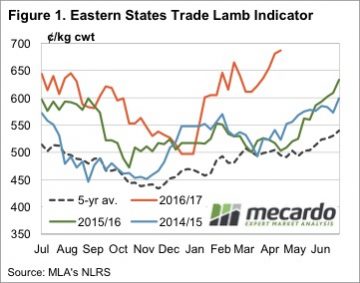 The pace of the rally in the Eastern States Trade Lamb Indicator (ESTLI) slowed this week, but it still went up. The ESTLI finished Wednesday at 687¢/kg cwt (figure 1). While the stronger prices of the last month might have something to do with a demand spike, it’s more likely to be underlying tight supply supporting values.
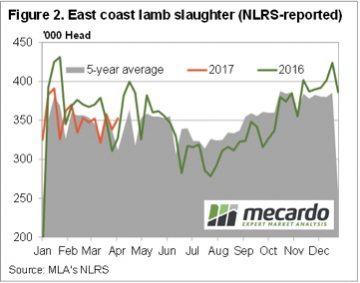 Driving MLA’s figures were results from the February MLA/AWI survey with the key figures being 34% of producers intending to increase flocks, and 59% intending to maintain. Of those intending to increase the flock, 56% are going to retain more replacement ewes. This basically means that of the fewer lambs born in 2016 and 2017, fewer are going to be available for slaughter.
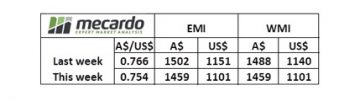 The EMI closed up a whopping 53 cents in A$ terms at 1512¢ while in Fremantle, the strong finish to the last week continued with a A$0.73 rise, the west closing at 1532 – Fig 1.
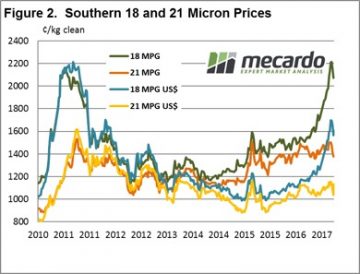 While the market in general benefited, it was the 21 MPG that was the stand out, with the market in Melbourne actually closing at a higher level than before the correction. This is quite remarkable given the increased supply of medium wool coming forward post the drought conditions of the past couple of years. Fig 2.
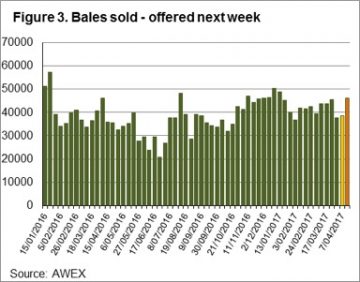 Growers are in the driving seat (not often this is the case!!), as the shortage of any buffer stocks means sellers can confidently withdraw wool from the market and have little risk that better prices won’t appear later. When combined with record income from any sheep or lamb sales (
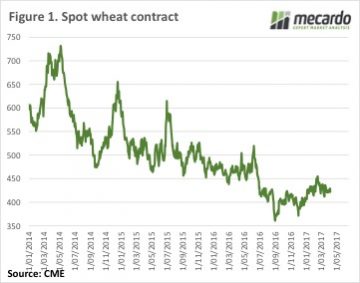 Figure 1 shows a rather boring CBOT wheat chart. Recent swings in prices have been small on an historical scale. As the volume of supplies dampens any attempts at a real price rally.
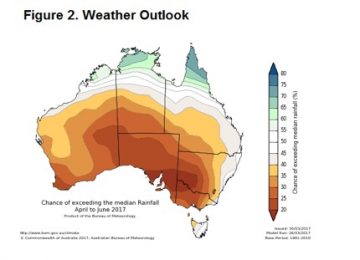 There has been intermittent interest in Canola, ASW and Feed Barley in recent weeks, with some growers managing $10-20 premium on published bids when buyers are trying to fill ships. If you’ve got wheat in store it’s worth looking at the shipping stem to see when boats are going and trying your luck with offers on Clear, or by talking to buyers or brokers.
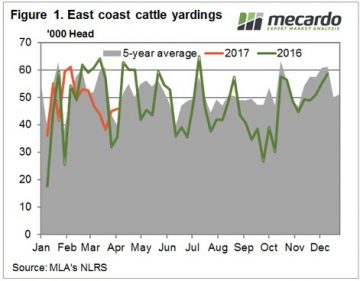 Figure 1 shows that the strong prices failed to draw out more cattle this week, with East Coast cattle yardings increasing just 1,300 head. Cattle yardings were down 28% on the same week last year. In fact almost every week of autumn (except for Easter) 2016 saw yardings above 60,000 head. Over the last 8 weeks cattle yardings haven’t managed to crack 52,000 head.
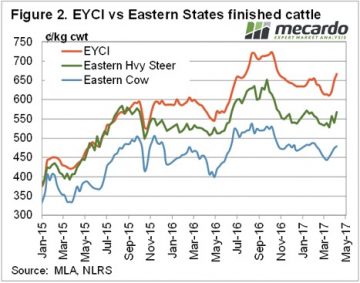 Slaughter cattle prices haven’t managed to hit new 2017 highs yet. Heavy steers bounced back this week, gaining 27¢ on the east coast to sit just below the opening price of 2017, at 568¢/kg cwt. It’s s similar story for Cows, with prices sitting a few cents below the February high.