 In recent times, there have been accusations of Russian tampering in western politics. In the wheat game, the Russian crop is interfering with our grain pricing! In this week’s comment, we highlight the Black Sea, and its impact on global pricing.
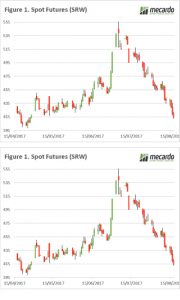
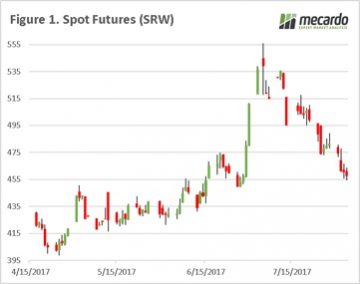
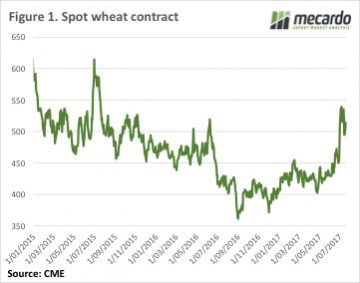
In figure 1, the spot futures are plotted. It’s not a pretty chart. The Chicago futures market has lost 142¢/bu or approximately A$66 since the peak of the season in July. This rally has provided many of our readers with good opportunities, for those who covered swaps or confidently contracted physical forwards. It is important that when we have such an oversupplied market that, when markets rally substantially, we begin to lock away price. We must make sure we don’t aim to hit the top of the market, as you will be perpetually disappointed.
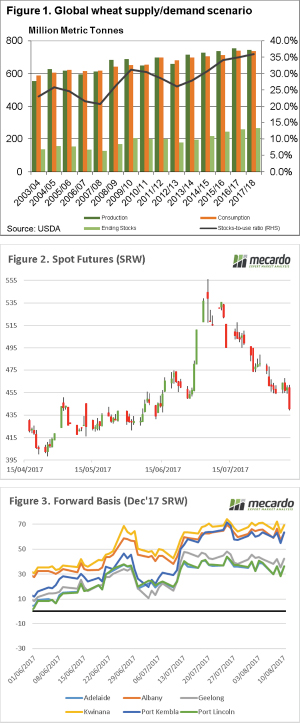
The recent fall in the market can partially be attributed to growing expectations of the Russian wheat crop. The recent WASDE report, alongside many private forecasters have tipped that the Russian crop will be the largest the country has produced at 77mt (figure 2), 7% above last year and well above (+40%) the ten-year average of 55mmt. Although, the Ukrainian crop has marginally dropped year on year, it also remains large at 22% above average.
The expectations of an immense Russian crop, alongside a low rouble, has resulted in Russian wheat becoming extremely attractive with an A$/mt terms 12.5% protein wheat pricing at $233 fob. The Black Sea crop will continue to place pressure on prices, as their export program will be substantial this year, and will be competing into similar markets to Australia.
Next Week/What does this mean?
This year seems to have parallels with the past two seasons, however last year the majority were gifted with strong production in Australia.
The focus at a local level will firmly be on the crop, at the moment the rain is coming in leaps and bounds. How long will this continue, and how much surety in the crop do we have. At present estimates of the overall crop have improved from the end of July, and it wouldn’t be unexpected to reach the upper end of the 17-22mt range.
 In the past week there has been significant posturing from both the Donald, and North Korea threatening to bring ‘fire and fury’ upon one another. It looks like the USDA might have fired the first salvo, with the release of the August WASDE report. In this week’s comment, we will look at what the fallout has been.
 The first week in August. This month is one of the most important in the cropping year, as we will have increased certainty on the rest of the world’s crop, and start to gain greater clarity on how good (or bad) Australia is going to be come December. It is the knife edge time of year.
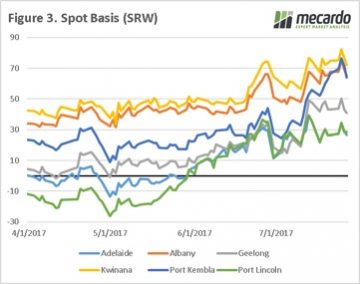
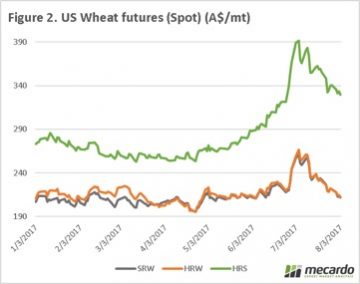 At a local level flat price around the country have fallen since a peak on the 11th of July (figure 3). During the first week of July all port zones were able to achieve historically competitive prices, however few growers have taken advantage of the prices available. Since the 11th, across all ports in figure 3, the price has dropped by $32 per mt.
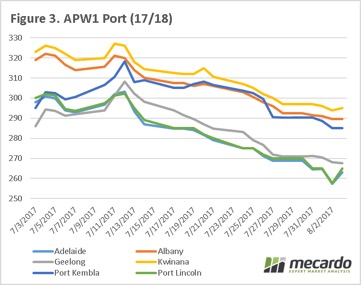

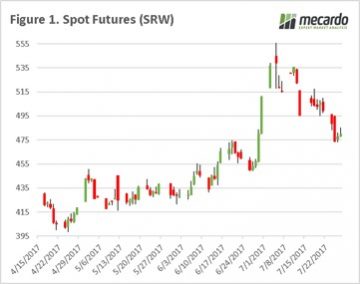 At global level, we have seen further deterioration of Chicago wheat futures, with the spot market falling to as low as 474¢/bu, from a high at the end of June of 539¢/bu (figure 1). The market has lost 3/4 of its gains in ¢/bu since the rally in the end of June. The fall in SRW wheat is not unexpected as weather issues around the world are more a quality than quantity issue at present, and with beneficial rains being received throughout the US, risk to this crop has reduced and priced into the market.
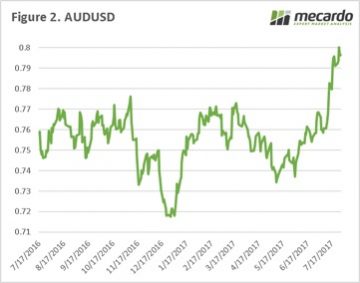
 CBOT wheat prices managed to track sideways this week as the market digested the World Agricultural Supply and Demand (WASDE) report and weather outlooks improved. While the spot and Dec-17 CBOT wheat have fallen 50¢ from the peak, the Dec-18 contract is down 35¢. Dec-17 currently sits at 529¢/bu, with Dec-18 at 585¢ and full carry back in the market.
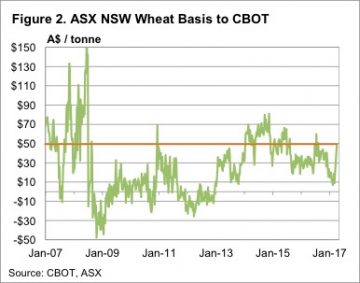 After also falling heavily last week, ICE Canola for Jan-18 has steadied at the $515CAD/t level. The Canadian dollar has matched the AUD increases, with the two currencies locked at parity, so swap prices remain around the $515/t value. With local port prices at $530-535/t, the basis value doesn’t look to be there, so swaps would be the way to go at the moment.
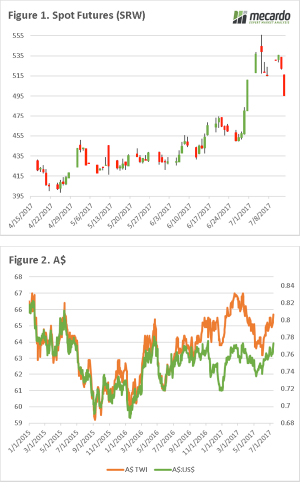 This week we saw the USDA release their July World Agricultural Supply and Demand estimates, the market has reacted to this news. In this update, we take a short look at Chicago futures & the dollar.
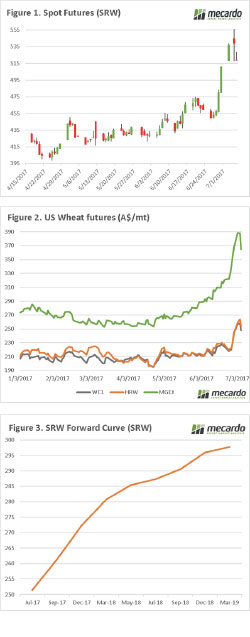 In the late 1600’s Sir Isaac Newton, developed the theory of gravity. It seems that in addition to determining that apples will fall from trees, it seems that what goes up in the grain market also comes down. After a sustained rally over recent weeks, some of the gains have been lost, however there are still good opportunities.
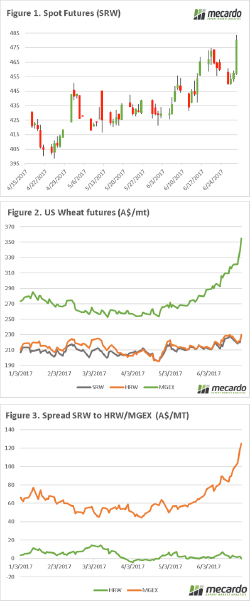 Well this is good news, wheat is on a journey to the moon, and at this rate beyond the planets. The downtrend of the past week has been reversed in dramatic fashion, is this a sign of things to come?
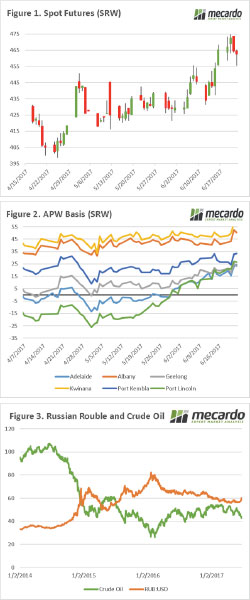 There has been a slight turnaround in the market, but overall prices are substantially more attractive than they have been in the post-harvest period. In this week’s commentary, we examine the potential impact of crude oil on Australian wheat, and why we should be aware of it.
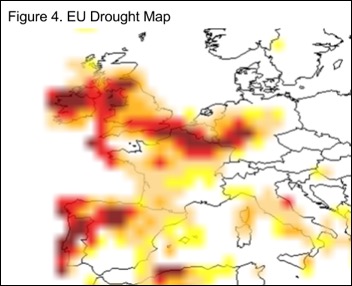
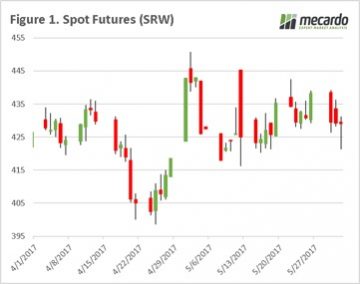 In our grain article yesterday, we picked out a few bullish factors at play in the market. Our view is that based on current market factors that pricing is close to the floor. In this weekly comment, we look at current pricing and the situation in Spain.
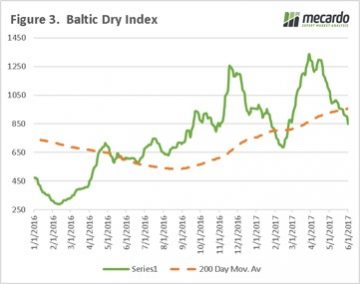
 In the past week, we have also seen the Baltic Dry Index (BDI) fall below the 200-day moving average (Fig 3). The BDI is considered a leading economic indicator as the cargoes typically transported by bulk vessels are commodities requiring further processing (iron ore, coal, grains etc) to create an end product, thereby giving an insight into future economic performance. The poor economic data in China, and declining Iron Ore returns could place further pressure on the A$.