Tag: Opportunities

34 micron prices low against polyester staple fibres

Key points:

  • 34 micron prices are trading at 25 year lows in Australian dollar terms.
  • In US dollar terms, 34 micron prices are trading near the low levels reached in the last 1990s and early 2009.
  • In US dollar terms the 34 micron price has returned to low levels of basis to polyester staple fibre prices, similar to that seen in the late 1990s and the middle of the last decade.

Broad crossbred prices continue to plumb new lows, a mere five years after they had spent five years (2010 to 2015) trading at stratospheric levels. This article takes a look at an Australian 34 micron prices series and its relationship to polyester staple fibre prices.

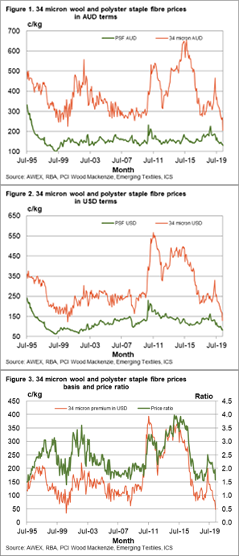
In Figure 1 a 34 micron price series from Australian auctions is shown running from mid-1995 onwards, along with a polyester staple fibre (PSF) price series. In Australian dollar terms, the 34 micron price series is at 25 year lows, close to 200 cents which is well below previous periods of low prices such as the late 1990s and the middle of the last decade. The PSF price series bubbles along at appreciably low levels.

Figure 2 shows the same series as Figure 1, but in US dollar terms as the supply chain would generally view them. The high prices from 2002 in Figure 1 disappear (a function of exchange rates), as do a lot of the boom price levels of 2015, again a function of exchange rates rather than demand. The current low price for 34 micron also changes, as in US dollar terms it is on par with the lows of the late 1990s when apparel fibre prices were generally depressed for an extended period (fine Merino wool was one notable exception at the time).

Note that the 34 micron and PSF price series follow similar trends and cycles, except for 2012-2015 when 34 microns buck the trend and trade at high levels. During that period most apparel fibre prices trended lower.

In Figure 3 the relationship between the 34 micron and PSF prices series is shown in US cents per kg (left hand axis) and as a simple price ratio (right hand axis). In terms of the price ratio, the low point of the past 25 years has been around 1.5-1.6. This is the ratio the 34 micron has fallen to, well down from the ratio of 3.5-4 reached in 2015-2016. In terms of the premium in US cents per kg terms, 50-70 cents has been the low reached in the late 1990s and again briefly in early 2009. The premium has shrunk to the low range again.

Energy prices have fallen this year, which will put some downward pressure on PSF prices. The PSF price is approaching the low levels reached in the depressed late 1990s, so the scope for further downward movement in the PSF is hopefully limited. Stabilisation in PSF prices looks to be required to help the 34 micron price steady.

What does this mean?

In proportional terms, farmers have been building stocks of broad crossbred wool on par with other micron categories this season. While that has not been a successful strategy, it may start to be worthwhile, given the low price level in US dollar terms, the low basis to polyester staple fibre price, and the (hopefully) limited downside for polyester staple fibre prices. Time will be the key to a recovery and that will require two components which are, firstly a pickup in economic terms and secondly a pickup in demand for broad crossbred wool in relation to other fibre prices.

Market has a positive bounce

While last week the MPG indicators across the board were showing negative, this week it was a “sea of green”. The market performed strongly on a small offering. From the open in Sydney & Melbourne, through to the final sales in Fremantle on Wednesday, it was obvious that buyer sentiment had improved.

The Eastern Market Indicator (EMI) lifted 15¢ or just over 1% this week to close at 1,170¢. The Australian dollar was also up almost a full cent to US$0.664, which elevated the EMI in USD terms by 21¢ to 777¢. The Western Market Indicator also posted a good gain, up by 25¢, fully regaining last weeks fall to close at 1,239¢.

Turnover this week was lower at $22.24 million as a result of the smaller offering. This moved the average bale value to $1,282 per bale, taking the season to date value to $1,878 million.

The pass-in rate was lower at 7.9%, 4.7% below last weeks level after growers withdrew 11.2% of the offered bales pre-sale. This resulted in 17,343 bales clearing, just over 1,000 fewer than last week.

Apparel fibre prices peaked in mid-2018 and then began a cyclical downturn. By late 2019 the average Merino micron price was down by 29-30% in both AUD and USD terms, a modest down cycle over 18 months. Then came the pandemic.

As Andrew Woods wrote on Mecardo, “Since January the price of Merino wool has fallen by 27% in US dollar terms and 23% in Australian dollar terms (monthly averages). The pandemic downturn is a separate and additional downturn to the already existing down cycle from 2018.”

The gains this week in the market were “across the board” with all MPG’s rising, however, notable rises were in the 18 to 21 MPG range with 20 to 30 cent gains. Fremantle followed the eastern states lead on Tuesday with 29 – 38 cent gains across its micron range, as well as a 37-cent lift in the Cardings.

A small offering of Crossbred wool came forward and met solid competition, with the strongest rises coming in the 26.0 to 28.0 MPG range. Cardings followed the combing wool lead, with 20, 16 & 37 rises in Sydney, Melbourne & Fremantle respectively.

The week ahead

Next week’s national offering is reduced again to 17,136 bales with only Sydney & Melbourne selling on Tuesday & Wednesday.

Better buyer sentiment and a reduced offering should provide support to the market.

Look at them go

A good winter outlook, moisture in the soil and the lowest yarding levels all season have seen cattle prices hold ground this week for most categories. Although over the longer term it has been a good run for prices all year with average monthly price gains since January between 18%-35% across the CV19 reported categories.

The Bureau of Meteorology released their end of May three-month climate outlook yesterday and it shows a 60-80% chance of a wetter than average winter is expected for much of Australia. Furthermore, the very much above average root zone soil moisture seen during May across large areas of eastern NSW is giving some confidence back to producers impacted by the dry conditions seen in 2019 (Figure 1).

East coast cattle yarding levels have eased to the lowest weekly point this season with only 15,558 head presented for the week ending 22nd May, which represents a 73% reduction from the five-year average trend for this time in the year (Figure 2).

A breakdown of the three key east coast states shows cattle yarding in Queensland is running 63% under the five-year trend, while Victoria is at 73% below average levels. However, the state really dragging down the total east coast yarding numbers is NSW with a mere 3,841 head presented last week, 83% below the seasonal trend for this time in the year.

The combination of a favourable climatic situation and tight supply lent support to some cattle categories this week. The MLA CV19 for National Vealer Steer indicator showing the best result with a weekly gain of 4.4% to close at 420¢/kg lwt. National Medium Steer was up 2.4% and Medium Cow managed a 1.2% lift.

The National Heavy Steer softened 1% on the week to close at 351¢/kg lwt and Yearling Steers were off by 4.5%. However, a look at price gains since the start of the season highlights how 2020 has turned to favour producers with gains from 18%-35% across all reported categories (Figure 3).

What does it mean/next week?’

As outlined in last week’s market comment the improving picture in US Live Cattle Futures markets (up nearly 4% this week and closing at 101.6US¢/lb overnight) along with the combination of tight local supply and a good rainfall forecast all bodes well for cattle producers as we head into winter. Expect domestic cattle prices to continue to be supported over the short term.

Sheep and lambs “stay home”

One could be forgiven for thinking that sheep and lambs were on paddock lockdown last week based on the saleyard throughput figures. Weekly east coast lamb yardings were already tight for this time in the season, but last week reached a low that pre-dates Mecardo’s records.

East coast lamb yardings were 79% below the five year average trend at just 39,798 head (Figure 1). We’ve been looking at the 2011 season as a reference point of how supply played out during a rebuild. However, last weeks throughput suggests that we might be reaching into new territory. The low in 2011 still saw 70,000 lambs pass through east coast yards and this was during a week of Easter disruption.

The story was much the same for sheep yardings. East coast sheep throughput fell 66% from the week prior and was 83% below the five year average trend (Figure 2). Zoning in on the various states and it was clear who drove the dramatic fall in yardings. New South Wales combined sheep and lamb yardings were 89% below the five year average, while Victoria wasn’t far behind at 69% below the average trend for this time of the season. Recent rain in these regions appears to be adding more optimism to the outlook and incentivizing producers to hold onto stock.

Sheep and lamb slaughter volumes saw little change from the week prior. Weekly east coast sheep slaughter remains at 53% below the same period last year (Figure 3). For the calendar year 2020 to April, sheep slaughter was down 25%, so the trend is increasing which is positive for the Australian flock.

All CV indicators responded to the lower supply with gains. The Mutton CV19 indicator lifted 5.3% on the week to $180/head and the Processor lamb indicator picked up an impressive 10% to $220/head. The Restocker lamb CV19 indicator also had a modest rise over the week of 3.8% to sit at $164/head on Thursday.

Next week:

The winter rainfall outlook released by the Bureau of Meteorology this week looks promising for much of the country. Tight supply is certainly here to stay. Whether last week’s slaughter and yardings figures hint at just how tight we can expect the next few months to be, is something we’ll be watching closely.

You don’t know what you’ve got til it’s gone

Key Points

As we head into June, a period of uncertainty looms. Do we see price rises as weather concerns mount, or does a large global crop hamper upside? One thing for sure is that the next two months will be volatile.

CBOT wheat futures lost steam this week but have tried to regain ground overnight. There are concerns that poor weather in Europe has hampered crop production. The December wheat futures in US$/mt have returned to the same level as last Thursday. The Australian dollar has gained ground however and is currently trading A$4 below last Thursday.

Risk management and examining prices are some of the most important factors in running a grain growing enterprise. There were fantastic opportunities to lock in high futures levels in March. The market since then has fallen from A$355 to A$291 (Figure 1).

There is always a potential for the market to rise back to those levels, but it’s always advisable to take some cover when it is available – at least for a small portion.

As a tip, it is important to ensure that you have the correct facilities available and open to use the market to your advantage. It takes time to set up the correct facilities and by the time they are in place, the opportunity may have passed. You don’t know what you’ve got til its gone.

At a local level, the ASX futures market has slightly declined, with both old and new crop pricing down around A$2/mt (Figure 2). As we draw ever closer to harvest we are likely to see the spread between new crop and old crop trend lower. There may be times when the market jumps up as domestic buyers hit the market, however, the trendline will be for that spread to narrow.

If you are holding old crop, it might be time to sell and take advantage of the remaining drought premium.

The three-month outlook for Australia looks positive (see here).

What does it mean/next week?

Next week we will be moving into June. If previous years are any indicator, we are likely to see some volatility. This could provide opportunities for farmers to increase their hedge positions, especially as good rainfall reduces potential production risk.

End of quarter surge in live sheep exports

Key points:

  • During January and February flows to Qatar and Kuwait were 31% and 54% below trend.
  • Australian live sheep export flows to Kuwait for March increased to 58,864 head to see it 14% above the five-year average trend.
  • Jordan and the UAE also saw increased flows in March, but Qatar remained below the five-year average seasonal trend.

It has been a while since we took a look at the status of live sheep exports so we thought a summary of the first quarter of 2020 was in order. After a slow start to trade volumes the quarter finished with a bang as Kuwait, Jordan and the UAE ramped up demand.

Figure 1 highlights the 2020 trend in Australian live sheep export volumes showing a January/February period trending 54% below the five-year seasonal average.  The three top export destinations for Aussie live sheep exports are Qatar, Kuwait and Jordan. During January and February flows to Qatar and Kuwait were 31% and 54% below trend, respectively. While no Australian sheep were shipped to Jordan.

However, March saw a big turnaround. While Qatar remained 15% below the five-year trend for March, there were significant lifts for Kuwait, Jordan and the UAE. Figure 2 displays the Kuwaiti trade in Australian live sheep with flows for March increasing to 58,864 head to see it sit 14% ahead of the five-year average pattern for the month. Jordan saw 43,004 head transported in March, the second highest monthly volume in four years. Meanwhile, the UAE recorded 22,000 head shipped during March to see it 117% above the five-year average monthly trend.

Although Kuwait saw a significant jump in live sheep imported from Australia in March it wasn’t enough to unseat Qatar from the top export destination for the 2020 season. Qatar has received a total of 100,000 head for the first quarter of the year, accounting for 34% of all live sheep exports from Australia. The tally so far this season to Kuwait sits at just over 91,000 head, or 31% of the total flows (Figure 3).

What does it mean?:

After the slow start to 2020, it is pleasing to see live sheep export volumes lift above the average trend in March given there will be another moratorium in the trade over the northern hemisphere summer this season.

COVID-19 lockdown regulations have given employees in retail, tourism and hospitality sectors a taste of what it is like to have your industry ground to a halt for 3-4 months of the year. However, this is a scenario that has impacted employees across the live sheep export supply chain since 2018. Hopefully we see a few more months of above average volumes during April and May to compensate for the live sheep export lockdown when it comes in June.

Positive note short-lived

The modest gains posted last week proved short-lived. The opening day in Melbourne provided some optimism but the market was unable to maintain the early price improvement to eventually end on a disappointing note.

The Eastern Market Indicator (EMI) fell by 24¢ this week to close at 1,155¢. The Australian dollar was up 0.73¢ to US$0.655, which cushioned the EMI in US$ terms, only falling by 7 cents to 756¢. The Western Market Indicator also fell, losing 23¢ to close at 1,214¢.

Turnover this week was down marginally at $23.76 million or $1,287 per bale, taking the season to date value to $1,856 million.

The pass-in rate was up marginally on last week to sit at 12.5%, after growers withdrew 8.6% of the offered bales pre-sale. This resulted in 18,455 bales clearing, just on 3,000 fewer than last week.

While the season to date weekly average sale clearance is at 27,595 bales (34,400 same period last year), the past 10 weeks has seen the clearance volume slip to an average of 22,600.

Supply is remaining constrained as growers wait and hold wool, with the expectation (hope?) that prices will recover soon. Many are supported by recent high price sales of clips over the past 2-3 years, as well as strong sheepmeat sales. However, this can only last for so long. We are now seeing growers increasingly concerned about the short and medium-term outlook for prices.

The falls were spread mainly across the Merino MPG’s with 8 to 64 cents falls reported, in fact, the EMI would have reported a larger fall if not for the fact that the Crossbred section remained unchanged.

Nationally just 2,342 bales of Crossbred designated wool was offered with 2,070 selling, with the Cardings section also clearing a modest 2,100 bales. This reduced offering pushed the Cardings indicators up in all centres, with an average 28¢ lift.

The week ahead

Next week’s national offering is a slightly smaller offering of 20,359 bales with Sydney & Melbourne selling on Tuesday, while Melbourne & Fremantle will offer on Wednesday.

To say we are in unchartered waters is an understatement, with a buying trade operating under severe limitations.

One market two periods.

The grains industry has been fully focused on barley this week. This is hardly surprising considering the enormity of the impact of the Chinese import tariff. In this week’s comment, we will be giving barley a little break. Let’s look at what is happening in the wheat world.

The local market is a tale of two time periods. The weekly average price for the old crop has declined A$6 week on week. Last week the old crop price averaged A$366, this week it has declined to A$360. As Australia moves on from the recent drought, pricing is destined to remain high until new crop supplies can fill the pantry.

The inverse between old and new has fallen A$6 to A$56. This remains high and as time ticks closer to harvest, there will be a point where the two pricing points converge. As we have discussed in many articles and podcasts, it is highly unlikely that new crop pricing levels will rise to meet old crop levels.

After falling two weeks ago, the new crop pricing level has remained solidly at A$303, albeit with very little activity.

As we move into the silly season, when grain market volatility increases, we will experience wild price swings. We have experienced a taste this week with CBOT wheat futures rallying from 509¢/bu to 527¢/bu. In local terms, December CBOT was unchanged from last week as a result of the higher AUD.

Next week?

Historically the May-July period has been one of great volatility. This is due to the northern hemisphere ‘weather market’. Any little move or concern will likely lead to large swings in pricing (both ways).

Waning supply keeping prices steady

It seems to be steady as she goes for lamb and mutton prices at the moment, with declining supplies translating into solid support for prices. This week mutton and restocker indicators received a lift with the flock rebuild intensifying.

It was way back in 2011 when a full week of sheep slaughter fell below 44,000 head, and that was only for two weeks at the end of July (Figure 1).  The 2011 trend in figure 1 does give an indication of what we can export in terms of sheep slaughter this year.

Sheep slaughter in late spring more than doubles that of autumn and winter, but we all know there are fewer sheep in the flock now. If, and it’s a big IF, we get a good spring, weekly sheep slaughter could stall around 80,000 head from October to November, but it remains to be seen if restockers will still be there to bolster prices.

This week the CV-19 Mutton Indicator gained $7 to $171/head, only $15 off the peaks of March, but 80% more sheep were being killed then.  COVID-19 has impacted demand for sheep as well as lambs.

Processor lambs were basically steady, at just above $200/head, while restocker lambs were up $10 to $158/head. A $40-50 spread between store and finished lambs is a pretty reasonable margin if grass is abundant. The spread was around $55-60 in March (Figure 2) when grain was still the main feed to finish lambs.

Next Week.

Tight supply is here for the next two months at least, but we might see NSW supply coming at more of a ‘normal’ time this year. Traditionally NSW suckers have started to hit the market in earnest in July, as growers try to catch winter premiums. There might be fewer lambs this year than historically, but we expect supply to ramp up quickly in mid-winter, then again in spring which could see a return to the average price trend shown in figure 3.

Offshore markets and supply provide support

Some good weekly price gains were noted for the MLA CV-19 cattle indicators this week as a continued situation of tight domestic supply and improved offshore markets underpin local sales.

East coast cattle throughput levels have been rising from the seasonal low registered in April. However, compared to the five-year average trend and the 2019 pattern, yarding levels remain well below the normal situation (Figure 1).

During May, weekly east coast cattle yardings averaged 30% below the five-year pattern. Compared to 2019 the picture is even tighter, running 38% under levels seen this time last year.

Similarly, east coast cattle slaughter volumes show a tight result too. Since early May, weekly slaughter figures have continued to ease, drifting outside the lower end of the normal seasonal range. Indeed, the average weekly slaughter volume for May now sits 13% below the five-year average trend (Figure 2).

Across in the USA, the supply picture remains tight as well, albeit for slightly different reasons. Steiner report that the US Fed Cattle slaughter levels remain nearly 30% below this time last season, as processing plants still grapple with the supply chain impacts of the COVID-19 pandemic.

The tight conditions in the US providing some good support for the imported 90CL frozen cow indicator to see a strong increase on the previous week, up 4% to reach 804.2 AU¢/kg CIF – the highest it has been this year (Figure 3).

In further good news for global cattle market sentiment, the US Live Cattle Futures price has rebounded 22% from the seasonal lows seen in late April to trade just a fraction under 100US¢/lb this week. For those subscribers that managed to see the COVID-19 webinar (still available on MLA’s Youtube Channel) I participated in last month, they would recall that getting back above the 100US¢/lb level is crucial for longer term support into the Australian market. So, it is good to see some price improvement returning.

Local CV-19 cattle indicators are all benefiting from the tight supply and improved offshore situation with the National Yearling Steer leading the charge, up 11% on the week to 393¢/kg lwt. Medium Steer, Feeder Steer and Finished Steers are all putting in a good show too, up 7% (331¢/kg), 5% (377¢/kg) and 3.5% (349¢/kg), respectively.

Next week?

Tight supply, improving offshore prices and a good rainfall outlook heading into winter all play into the hands of cattle producers currently. This should continue to provide support to domestic cattle prices into the short term.

Continue to keep an eye on the US Live Cattle Futures price as the ability for it to gain a strong foothold above 100US¢/lb into the medium to longer term is key to keeping local prices underpinned.