Key points:
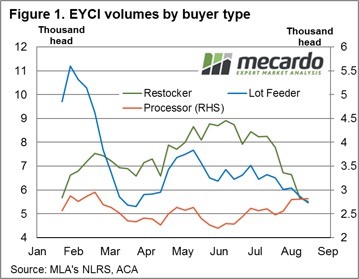
- Current average monthly restocker purchases of EYCI cattle at the saleyard are at 5,500 head per week and is sitting 24% below the seasonal weekly average of 7,250 head.
- Current average monthly lot feeder purchases are at 5,700 head per week and is placed 18% below the seasonal weekly average of 7,000 head.
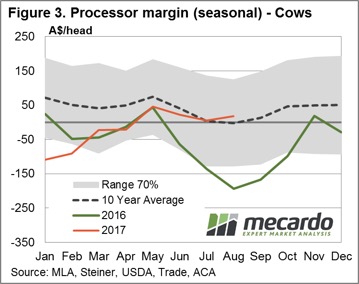
- Current average monthly processor purchase volumes are at 2,800 head per week and is 10% above the weekly average of 2,550 head recorded so far this season.
 Since the start of Winter there has been a changing dynamic at the saleyard for young cattle purchases. Declines in average volumes have been noted for restockers and lot feeders, on the back of reduced pasture availability and higher feed costs. However, processor purchases have bucked the trend as their margins are stubbornly clinging on to positive territory.
Analysis of saleyard average weekly volumes from the underlying EYCI data shows that over the last three months both restockers and feed lots have been reducing their buying activity, despite the price of young cattle declining 16% since the start of June. Figure 1 shows the weekly purchase volumes by buyer types averaged over each month since the start of the season. The recent decline in purchases of EYCI style cattle by restockers and lot feeders is clearly evident, with restocker volumes currently 24% below the seasonal average and lot feeders are 18% under. Interestingly, over the same time frame processors have increased their activity at the saleyard, such that current processor volumes are sitting 10% above the seasonal average.
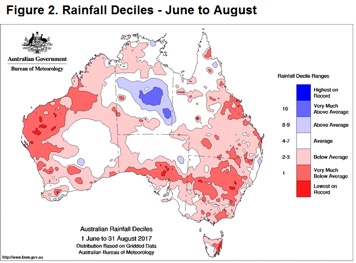 Over the season so far, restocker purchases have been averaging around 7,250 head of EYCI cattle per week. However, average purchases for the last month have reduced to 5,500 head as unseasonal dry conditions, highlighted by the rainfall deciles from June to August (figure 2), sap some of the optimism out of restocker demand.
Similarly, feed lots had been averaging purchase volumes of around 7,000 head per week since the start of the season, but in the last month this has reduced to an average of 5,700 head. A spike in global grain prices saw feeder margins squeezed in early Winter. This was followed by higher basis levels for grain, particularly in the Northern NSW and Southern Queensland regions, as the persistent dry and frost events begin to impact upon expected yields in these areas. Read more about current feeder margins here.
An updated Mecardo processor margin model (figure 3) shows August remains in the black, with an average per head profit of $17.50 recorded for the month. Indeed, the processor margin has been positive since May and this probably accounts for why the current processor purchase activity of around 2,800 head per week is sitting above the average recorded since the 2,550 head at the start of the season.
What does this mean?
 The updated Bureau of Meteorology three-month weather outlook indicates a move to a more neutral condition for much of the country. The BOM expect rainfall to be below average in southwest Australia, above average in parts of southeast Queensland, and has a 50/50 chance of being above or below average elsewhere.
The prospect of higher than average rainfall to parts of southern Queensland and Northern NSW may see a revival in restocker activity here, providing some support to young cattle prices in these areas. Although, it may be too little too late to provide some relief for lot feeders in the form of a narrowing basis, particularly if forecast frosts into September continues to weigh on expected yields in these regions.
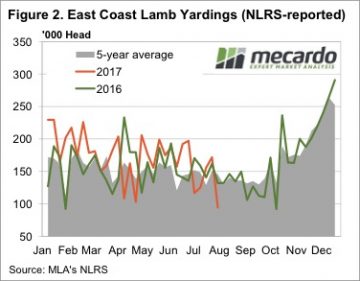
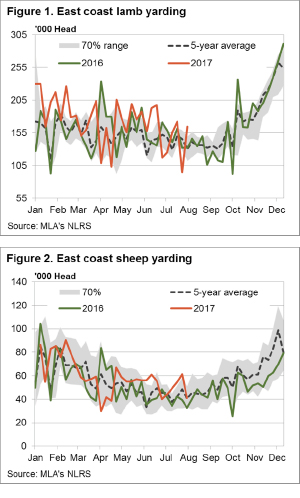
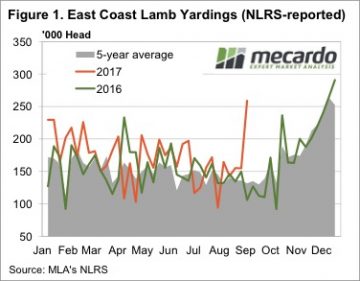 It was a rather extraordinary week for lamb supply at saleyards. In NSW lamb prices not only hit a record, but were 28.5% higher than the previous record, at 194,781 head. Lamb yardings in Victoria more than doubled, pushing East Coast yardings to a 67.5% rise for the week.
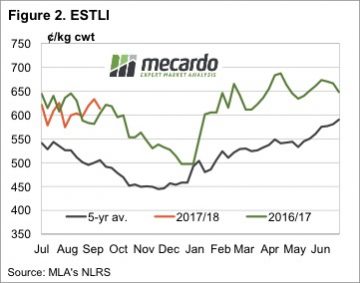 It’s hard to see lamb supply maintaining the extraordinary levels of this week, but we don’t expect a fall in yardings to do much to price. New season lambs are now flowing fairly steadily, with the only question being over the weight of lambs. This could see heavy and trade lambs hold their ground to an extent, in the face of easing light and restocker lamb prices.
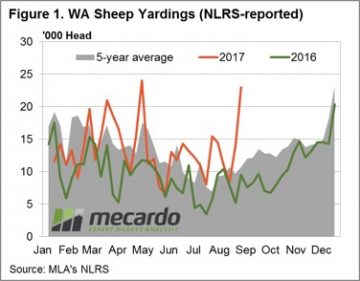 Figure 1 highlights the reaction of Western mutton producers this week to the robust prices for sheep and lamb prices being experienced recently, as covered by our
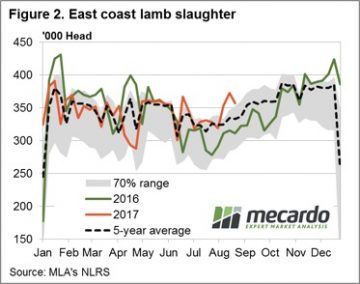
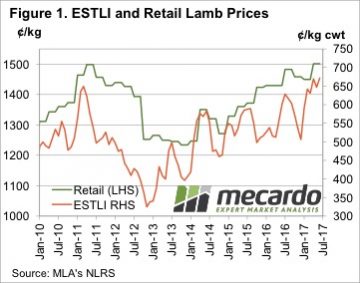 The sharp rise in saleyard and over the hooks lamb prices in the first half of 2017 took a while to translate into strong retail lamb prices, but it did eventually push them to a record. The average retail lamb price increased 51.77¢, or 3.6%, to move to 1501.37¢/kg rwt.
 Things are a bit different this time. Obviously in real terms lamb remains cheaper than it was in 2011, and compared to its main red meat competitor it is not yet in the expensive range. Figure 3 shows retail beef prices remained strong in the June quarter, and despite the rise in lamb values, beef it still at a 22% premium. In 2011 the beef premium shrunk to just 4%, and this put considerable pressure on lamb demand.
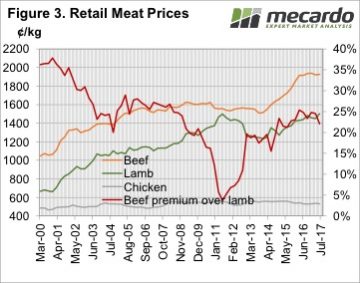 There remains some concern in the expensive red meat prices relative to static cheap chicken prices, and this is being borne out in consumption levels.
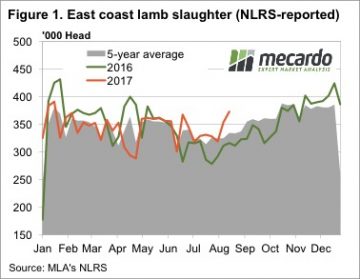 Markets can sometimes defy even the most rusted on seasonal trend. A couple of anomalies caught our eye this week. Figure 1 shows the massive jump in lamb slaughter over the last two weeks, to the point where for the week ending the 18th August, we hit its highest level since the third week of 2017. In fact lamb slaughter last week was the third highest for the year.
 There has been some talk around about slow lamb growth rates impacting on the supply of finished lambs early in the selling season. While this could explain continued strong prices, the high slaughter rates suggest supply is ok, and demand may be pushing prices higher.
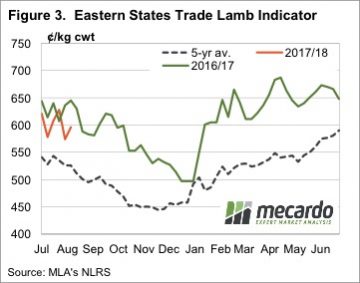
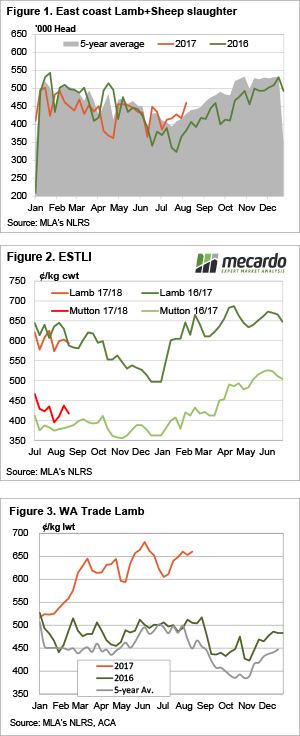 Average trade lamb prices continue to track around the 600¢ mark on the east coast, and higher in the west. Lamb and sheep slaughter has rallied and is sitting well above last year’s mark, but demand appear to be keeping pace with supply.
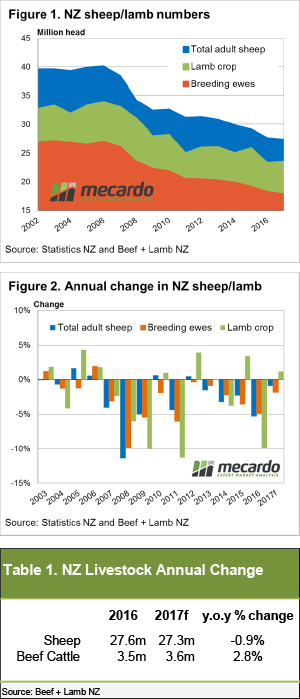 Beef and Lamb NZ’s mid-year stock number survey shows the Kiwi sheep flock and number of breeding ewes continuing to decline into 2017, albeit at a lesser degree than in previous seasons. Although, good pasture and ewe condition throughout the breeding cycle has seen an improvement in the anticipated lamb crop for this year.
 Some big moves again in East coast lamb and sheep yardings this week, heavily influenced by NSW flows, but for the most part prices around the country finished firmer. The headline, Eastern States Trade Lamb Indicator rising 1.3% to break back above 600¢ – although stronger gains were noted across other categories of lamb across the country.
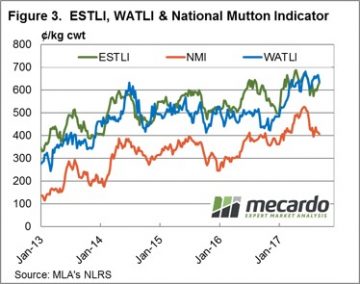
 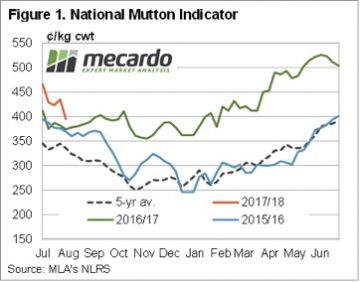 While mutton markets have participated in the decline in ovine markets since mid-June, unlike lamb markets, mutton values have managed to remain strong relative to last year’s levels. Figure 1 shows the National Mutton Indicator (NMI), which last week fell to a six month low of 395¢/kg cwt.
 In 2016 the mutton market eased a little, but found solid support at 350¢ as the good season and flock rebuild supported prices. From 2012-2015 the NMI averaged 230¢/kg cwt in October, so it’s the exception for mutton to be valued at better than 300¢ in the spring.
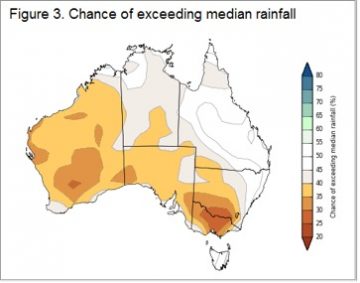 Obviously there is no guarantee that Australian sheep areas will have a dry spring. The BOM have been in pretty good form this year, and their latest forecast doesn’t paint a rosy picture (figure 3). Simply based on historical mutton prices during strong supply, we would put the NMI in the 200-250¢/kg cwt range.
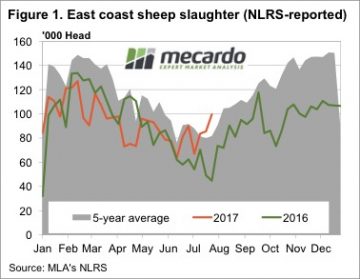 Figure 1 shows the rapid increase in sheep slaughter over the past month. This is a sure sign of moisture stress for sheep growers. Lambs can’t be offloaded as they are not ready, so it is sheep which are hitting the market, most likely wethers. Sheep slaughter for the week ending the 28th July was the more than double the same week in 2016, and the highest level since 2013, but only marginally beating 2014.